. 2017 May 18;169(5):905-917.e11.
doi: 10.1016/j.cell.2017.04.036.

Widespread Influence of 3'-End Structures on Mammalian mRNA Processing and Stability

Affiliations

Widespread Influence of 3'-End Structures on Mammalian mRNA Processing and Stability

Xuebing Wu et al. Cell. .

Abstract

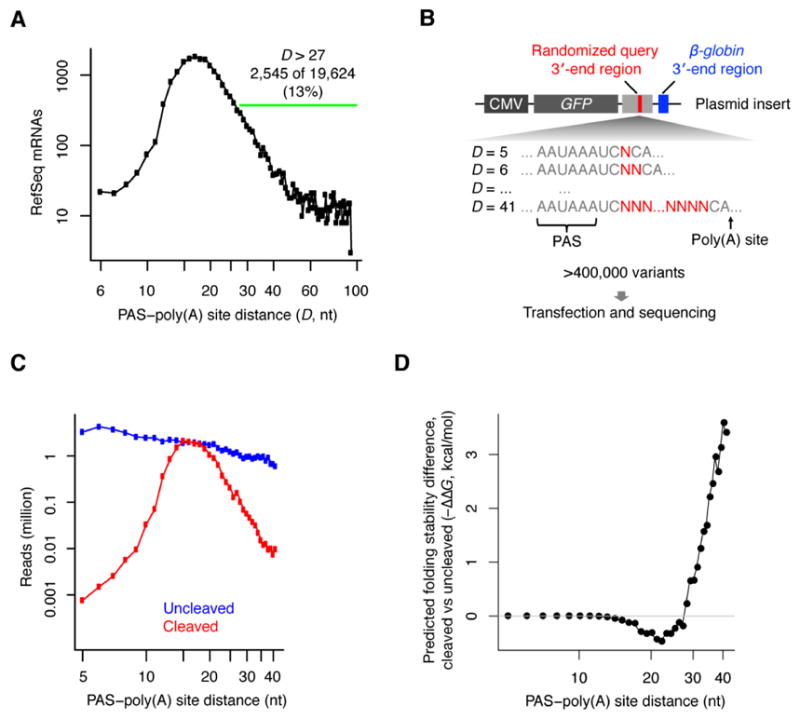
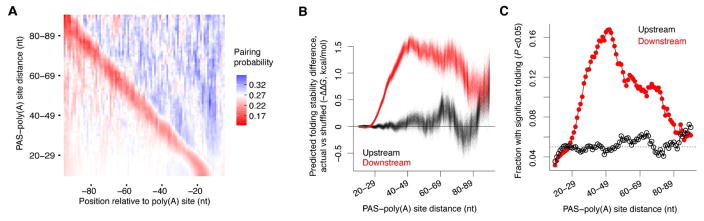
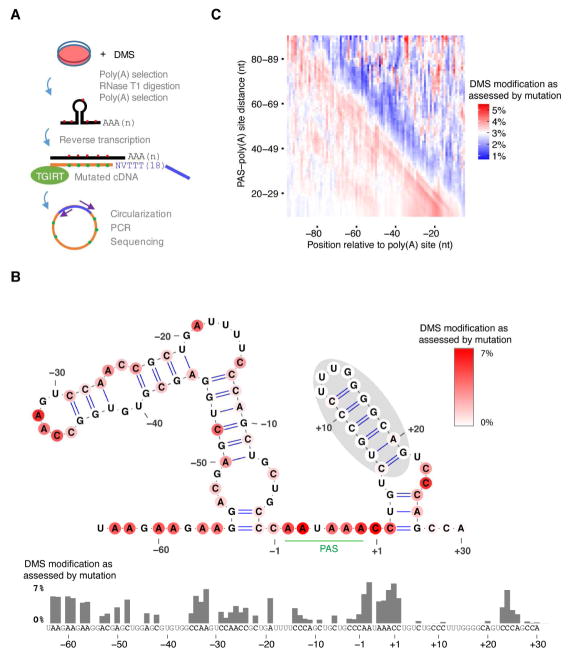
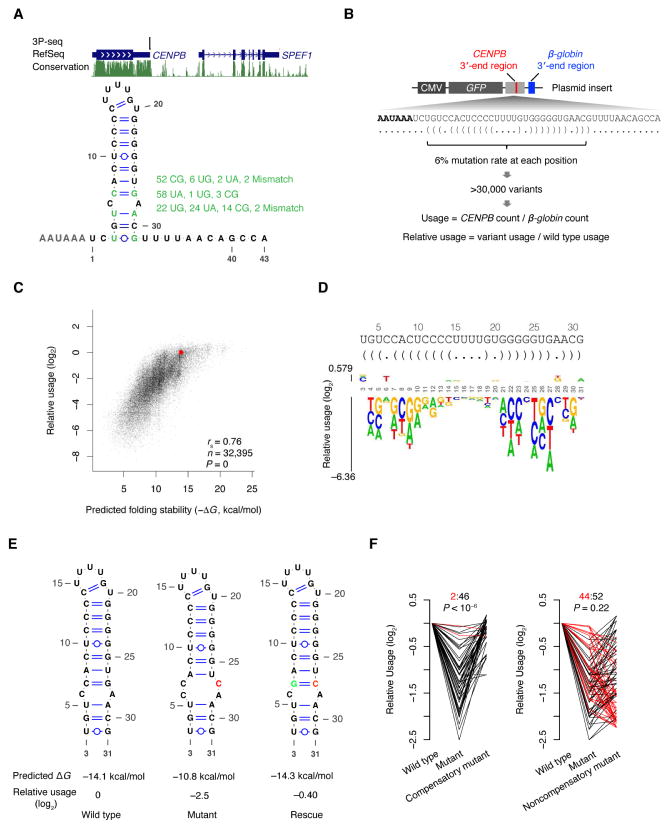
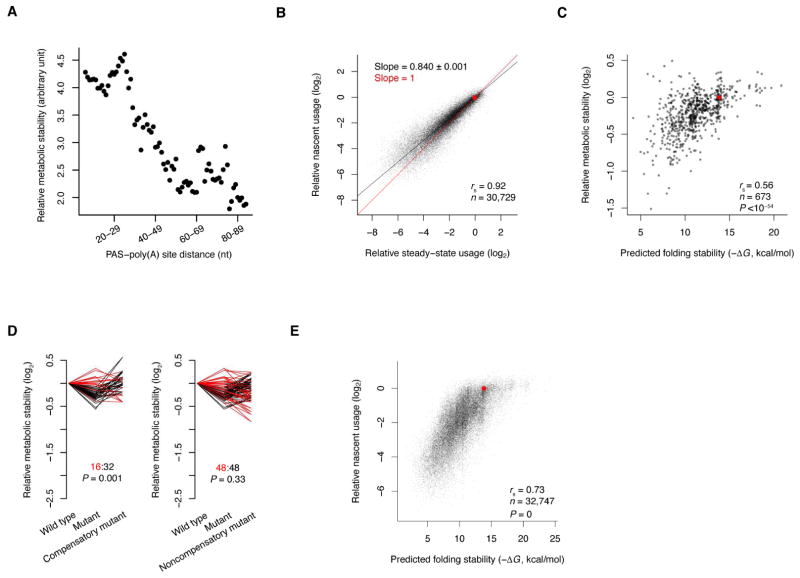
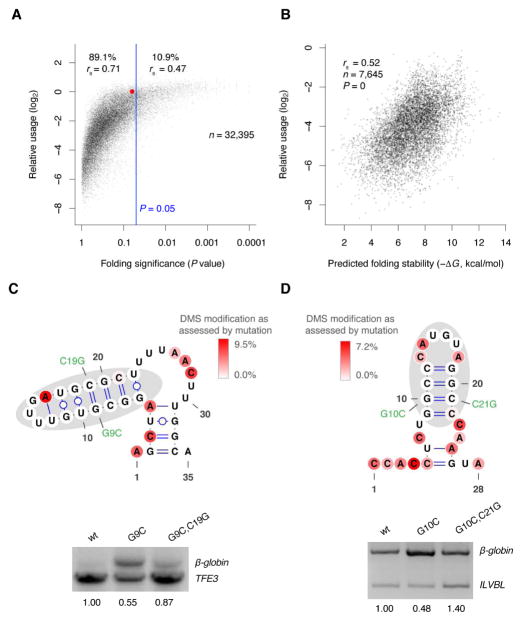
The physiological relevance of structures within mammalian mRNAs has been elusive, as these mRNAs are less folded in cells than in vitro and have predicted secondary structures no more stable than those of random sequences. Here, we investigate the possibility that mRNA structures facilitate the 3'-end processing of thousands of human mRNAs by juxtaposing poly(A) signals (PASs) and cleavage sites that are otherwise too far apart. We find that RNA structures are predicted to be more prevalent within these extended 3'-end regions than within PAS-upstream regions and indeed are substantially more folded within cells, as determined by intracellular probing. Analyses of thousands of ectopically expressed variants demonstrate that this folding both enhances processing and increases mRNA metabolic stability. Even folds with predicted stabilities resembling those of random sequences can enhance processing. Structure-controlled processing can also regulate neighboring gene expression. Thus, RNA structure has widespread roles in mammalian mRNA biogenesis and metabolism.

Keywords: CRISPR/Cas9; DMS-seq; RNA metabolic labeling; cleavage and polyadenylation; high-throughput analysis; in vivo structural probing; mRNA 3′ end processing; mRNA stability; mRNA structure.


Figures

Figure 1
Figure 1. The Distance Constraints on PASs and the Potential Influence of Predicted mRNA Structures
(A) The distribution of distances between canonical PASs (AAUAAA/AUUAAA) and poly(A) sites in human RefSeq mRNA annotations with a canonical PAS within their last 100 nt. (B) Schematic of an experiment that simultaneously measured the processing efficiency of many 3′-end variants encoded by a library of plasmids. Each member of the library contained two potential poly(A) sites. The upstream poly(A) site was within the query 3′-end region, which included a segment (red bar) that was randomized (red Ns) with respect to both nucleotide identity and nucleotide number, such that the distance between the query PAS and the poly(A) site (D) ranged from 5–41 nt. The downstream poly(A) site was from the β-globin 3′-end region. (C) Relationship between cleavage efficiency and PAS–poly(A) site distance. Plotted are the numbers of reads representing variants with each indicated distance, distinguishing between reads for transcripts processed at the query site (cleaved, red) and those for transcripts that failed to be processed at the query site but were processed at the downstream β-globin site (uncleaved, blue). (D) Relationship between the predicted folding stability differences and PAS–poly(A) site distance. Plotted is the difference of average predicted folding stability (−ΔG) observed between transcripts processed at the query site (cleaved) and transcripts that failed to be processed at the query site but were processed at the downstream β-globin site (uncleaved). Transcripts with <7 reads were excluded.
Figure 2
Figure 2. Predicted Structures Are Enriched at Endogenous 3′-End Regions with Distal PASs
(A) Differences in pairing probabilities upstream and downstream of endogenous mRNA PASs. Each row of the heat map shows the mean probabilities (color-coded according to the key) predicted for the group of 3′ ends with similar PAS–poly(A) site distance (10-nt sliding window, 1-nt step), and each column shows the mean probabilities at the indicated position relative to the poly(A) site (position 0). (B) Differences in predicted folding stability observed between PAS-downstream sequences and shuffled sequences (red), and between length-matched PAS-upstream sequences and shuffled sequences (black), plotted with respect to PAS–poly(A) distance. The 3′-end regions were grouped by PAS–poly(A) site distance as in (A). Each color depicts the overlay of 1,000 lines, with each line showing the result of one random shuffling. The increased fluctuation observed at larger distances reflects the fewer regions with larger distances. (C) The fraction of PAS-downstream regions (red) and PAS-upstream regions (black) predicted to be significantly more stably folded (P <0.05) than shuffled control sequences, plotted as a function of PAS–poly(A) distance. The 3′-end regions were grouped by PAS–poly(A) site distance as in (A).
Figure 3
Figure 3. Global In Vivo Probing of RNA 3′-End Structures
(A) Schematic of DIM-2P-seq, a method for intracellular probing of RNA structure within 3′-end regions of polyadenylated transcripts. See text for details. (B) Probing results for the last 100 nt of RPS5 mRNA. The DIM-2P-seq mutation frequencies, which represent intracellular DMS accessibility of A and C residues, are plotted in the bar graph and color-coded on the predicted secondary structure, according to the key. DIM-2P-seq coverage for this region was >70,000 reads. The nucleotides immediately upstream and downstream of the AAUAAA PAS motif are numbered −1 and +1, respectively. (C) Differences in intracellular structure-probing results upstream and downstream of endogenous mRNA PASs. The heat map was generated as in Figure 2A, except the values represent the mean DIM-2P-seq mutation frequencies at A and C residues. See also Figure S1.
Figure 4
Figure 4. Causality between RNA Folding and Poly(A)-Site Usage
(A) A conserved stem-loop within the CENPB 3′-end region. Genome-browser tracks (top) show 3P-seq signal in HEK293T cells, RefSeq gene annotations, and mammalian PhastCons conservation scores. The secondary structure (bottom) shows the predicted fold of the CENPB segment spanning the PAS and the poly(A) site. Positions with multiple covariations supporting pairing among the aligned mammalian genomes are highlighted, with alternative pairs and their frequencies listed (green). (B) Schematic of an experiment resembling that of Figure 1B, which simultaneously measured the processing efficiency of many CENPB 3′-end variants encoded by a library of plasmids. See also Figure S2. (C) The relationship between usage and predicted folding stability (−ΔG) for CENPB 3′-end variants. Plotted are results for all variants with ≥20 reads supporting cleavage at the β-globin poly(A) site in HEK293T cells. (D) The effect of single-nucleotide substitutions on poly(A)-site usage, depicted as a sequence logo. The height of each base was scaled by its usage relative to wild type, and bases were stacked, placing the substitutions with stronger effects closer to the x-axis. The sequence and secondary structure (bracket notation) are shown above. The logo plot was generated by kpLogo (Wu and Bartel, 2017). (E) Example of a mutant–rescue pair. Shown are the predicted secondary structure, predicted ΔG of folding, and relative usage for the wild type, mutant (G27C), and compensatory mutant (G27C+C7G). (F) The relative usage for all 48 mutant–compensatory-mutant pairs (left) and all 96 mutant–noncompensatory-mutant pairs (right) in the library. Pairs with usage values inconsistent with rescue are highlighted (red). Shown at the top are the ratios of rescueinconsistent: rescue-consistent pairs, as well as the P value for observing at least this number of rescue-consistent pairs, estimated from 106 shufflings of the usage measurements.
Figure 5
Figure 5. The Functional Roles of Endogenous CENPB 3′-End Structure
(A) The 10 most frequently sequenced CENPB variants generated by Cas9. The wild-type sequence and the predicted structure (bracket notation) are also shown (bottom), with the expected Cas9 cut site (red vertical line). (B) The relationship between relative usage (defined as the ratio of RNA:DNA reads normalized to that of wild type) and predicted RNA folding stability for Cas9-induced mutants. Shown are results for mutants with ≥100 DNA reads, ≥2 RNA reads, and PAS–poly(A) site distances >27 nt. (C) Relationship between usage and PAS–poly(A) site distance for all variants with ≥100 DNA reads and ≥2 RNA reads. See also Figure S3. (D) Effects of mutating the CENPB 3′-end region on the expression of CENPB and SPEF1. Shown are expression values for the mutagenized cells relative to those of wild type cells after mutagenesis for the indicated number of days. Expression was determined using RT-qPCR, normalizing to results for GAPDH. Error bars indicate standard deviation based on three technical replicates. The positions of the primer pairs relative to the gene models are shown below the graph. See also Figure S4.
Figure 6
Figure 6. RNA Folding Enhances mRNA Metabolic Stability
(A) Relationship between mRNA stability and PAS–poly(A) site distance. The 3′-end regions of endogenous mRNAs were grouped by PAS–poly(A) site distance as in Figure 2A, and for each group, metabolic stability was calculated as the number of reads from the steady-state RNA divided by the number of reads from nascent RNA isolated after labeling with 4sU for 30 minutes. (B) Relative usage of CENPB variants, comparing values generated using steady-state RNA (which were prone to be influenced by differences in mRNA stability) with those generated using nascent RNA (which were less prone to be influenced by differences in mRNA stability). Nascent RNA was isolated after labeling with 4sU for 30 minutes. Results are plotted for all variants with ≥20 reads from the β-globin poly(A) site in each sample. The slope of the linear fit through the origin (black line; slope shown ± s.e.) differed from that of equal usage (red line, y = x; origin, red point). (C) Relationship between relative metabolic stability and predicted folding stability for abundant CENPB variants. Metabolic stability was measured as in panel (A) and is plotted relative to that of the wild type for all variants with ≥1,000 reads from the β-globin poly(A) site in at least one sample. The correlation decreased when using less stringent read cutoffs, which was entirely attributable to increased noise in stability measurements (Figure S5D–F). (D) The relative metabolic stability of all 48 mutant–compensatory-mutant pairs (left) and all 96 mutant–noncompensatory-mutant pairs (right) in the library; otherwise as in Figure 4F. (E) The relationship between nascent usage and predicted folding stability for CENPB 3′-end variants; otherwise as in Figure 4C. See also Figure S5.
Figure 7
Figure 7. Structures with Predicted Stabilities Resembling Those of Random sequences Are Functional
(A) The relationship between site usage and folding significance (P value) for CENPB variants in HEK293T cells. The result for the wild type is highlighted (red). Also shown are the number of variants (n) passing the cutoff for analysis [20 reads from β-globin poly(A) site], the percent of variants with P <0.05 and P ≥0.05 (right and left of blue line, respectively), and correlation coefficients for the relationship between usage and P value for these two subsets of variants. (B) Relationship between usage and predicted folding stability for variants with structures predicted to be less stable than those of most random sequences (P >0.5). (C) The presence and function of structure in the TFE3 3′-end region. Probing results are displayed on the predicted secondary structure of the PAS-downstream sequence, as in Figure 3B. DIM-2P-seq coverage for this region was >700 reads. Shown at the bottom are the relative usages of a mutant–compensatory-mutant pair, as determined using agarose-gel electrophoresis to resolve RT-PCR products (usage values, normalized to that of wild type, shown below gel). (D) The presence and function of structure in the ILVBL 3′-end region. DIM-2P-seq coverage for this region was >3,000 reads. Otherwise, this panel is as in (C). See also Figure S6.

References

    1. Ahmed YF, Gilmartin GM, Hanly SM, Nevins JR, Greene WC. The HTLV-I Rex response element mediates a novel form of mRNA polyadenylation. Cell. 1991;64:727–737. - PubMed
    1. Brown JA, Valenstein ML, Yario TA, Tycowski KT, Steitz JA. Formation of triple-helical structures by the 3′-end sequences of MALAT1 and MEN noncoding RNAs. Proc Natl Acad Sci. 2012;109:19202–19207. - PMC - PubMed
    1. Brown PH, Tiley LS, Cullen BR. Effect of RNA secondary structure on polyadenylation site selection. Genes Dev. 1991;5:1277–1284. - PubMed
    1. Chan SW, Fowler KJ, Choo KHA, Kalitsis P. Spef1, a conserved novel testis protein found in mouse sperm flagella. Gene. 2005;353:189–199. - PubMed
    1. Chen F, MacDonald CC, Wilusz J. Cleavage site determinants in the mammalian polyadenylation signal. Nucleic Acids Res. 1995;23:2614–2620. - PMC - PubMed