. 2017 Jun 15;198(12):4753-4763.
doi: 10.4049/jimmunol.1602019. Epub 2017 May 19.

Adoptive Transfer of Phosphoantigen-Specific γδ T Cell Subset Attenuates Mycobacterium tuberculosis Infection in Nonhuman Primates

Affiliations

Adoptive Transfer of Phosphoantigen-Specific γδ T Cell Subset Attenuates Mycobacterium tuberculosis Infection in Nonhuman Primates

Arwa Qaqish et al. J Immunol. .

Abstract

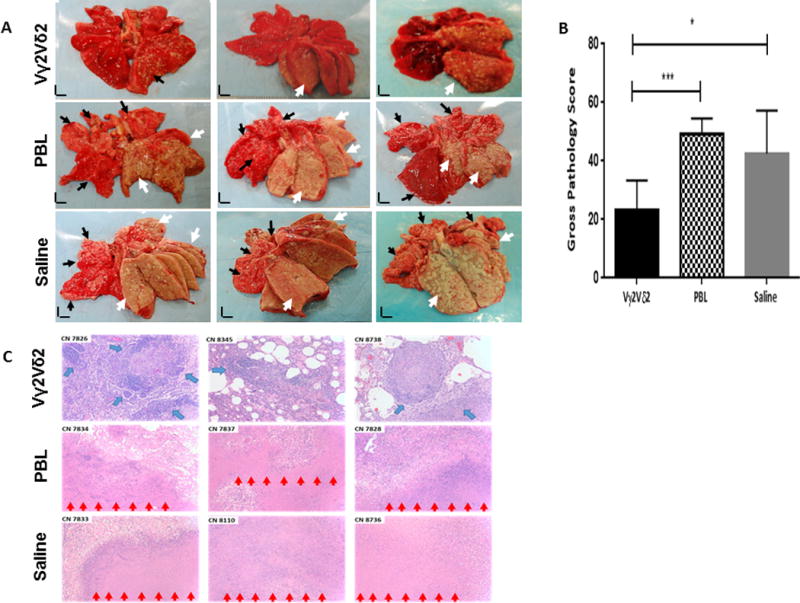
The dominant Vγ2Vδ2 T cell subset recognizes phosphoantigen and exists only in humans and nonhuman primates. Despite the discovery of γδ T cells >30 y ago, a proof-of-concept study has not been done to prove the principle that the Vγ2Vδ2 T cell subset is protective against Mycobacterium tuberculosis and other infections. In this study, we used an adoptive cell-transfer strategy to define the protective role of Vγ2Vδ2 T cells in a primate tuberculosis (TB) model. Vγ2Vδ2 T cells for adoptive transfer displayed central/effector memory and mounted effector functions, including the production of anti-M. tuberculosis cytokines and inhibition of intracellular mycobacteria. They also expressed CXCR3/CCR5/LFA-1 trafficking/tissue-resident phenotypes and consistently trafficked to the airway, where they remained detectable from 6 h through 7 d after adoptive transfer. Interestingly, the test group of macaques receiving transfer of Vγ2Vδ2 T cells at weeks 1 and 3 after high-dose (500 CFU) M. tuberculosis infection exhibited significantly lower levels of M. tuberculosis infection burdens in lung lobes and extrapulmonary organs than did the control groups receiving PBLs or saline. Consistently, adoptive transfer of Vγ2Vδ2 T cells attenuated TB pathology and contained lesions primarily in the infection site of the right caudal lung lobe, with no or reduced TB dissemination to other lobes, spleen, or liver/kidney; in contrast, the controls showed widespread TB dissemination. The proof-of-concept finding supports the view that the dominant Vγ2Vδ2 T cell subset may be included in the rational design of a TB vaccine or host-directed therapy.


Figures

Fig.1
Fig.1. Vγ2Vδ2 T cells generated for adoptive transfer exhibited multi-effector functions for producing anti-Mtb cytokines and inhibiting intracellular mycobacteria
A). Representative flow histograms showing the percentage of Vγ2Vδ2 T cells in total CD3+ T-cell population before and after 12 days of ex vivo expansion using zoledronate and IL-2. B). Representative flow histograms showing ex vivo expanded Vγ2Vδ2 T cells producing IFN-γ, TNF-α, Granzyme A and Granzyme B after 12-day culture with Zoledronate/IL-2. Panels were gated on CD3+ lymphocytes. Numbers in upper-right quadrant indicate the percentages of cytokine-producing Vγ2+ T cells in total Vγ2+ population. C). Graph data showing percentages of cytokines-producing Vγ2Vδ2 T-cell subsets in total Vγ2+ population with or without HMBPP stimulation. D). Representative flow histograms (left) show expression levels of the degranulation marker CD107a by expanded Vγ2Vδ2 T cells in the absence or presence of HMBPP. Graph data (right) demonstrate pool mean percentages of CD107a+Vγ2+ T cells in total Vγ2+ population with or without HMBPP stimulation. E). Ex vivo expanded Vγ2Vδ2 T cells could kill/inhibit intracellular BCG(left) and Mtb(right) bacilli. Expanded Vγ2Vδ2 T cells were co-cultured with BCG-infected ThP1 monocytes at an effector to target ratio of 10:1 in the presence of blocking antibodies against IFN-γ, TNF-α, or Granzyme A or mouse IgG isotype. Cultured cells were lysed and lysates were serially diluted and plated on Middlebrook 7H10 agar plates. For the intracellular Mtb inhibition assay, expanded Vγ2Vδ2 T cells were similarly incubated for 72 hrs with autologous monocytes/macrophages infected with Mtb at a MOI of 10:1. Cells were then lysed, and lysates were plated on Middlebrook 7H11 agar. Data in (A) to (E) are derived from 3–5 independent experiments. Values are expressed as means ± SEM. P values are results from non-parametric t test. *P < 0.05; **P < 0.01; ***P < 0.001. Similar trends of p values seen via ANOVA analysis.
Fig.2
Fig.2. Transferred Vγ2Vδ2 T-cell subset could traffic to the airway and retain there detectable from 6 hours through 7 days after the infusion in naïve uninfected macaques
A). Three naïve macaques were infused with variable numbers of ex vivo expanded Vγ2Vδ2 T cells per kilogram, half of which were fluorescently labelled with PKH26. B). Representative flow histograms showing the percentages of Vγ2+ cells in BALF samples collected from CN 8365 (3×10⁸ cells/Kg) overtime after infusion. Upper panels show percentages of Vγ2+ cells out of CD3+ T cells. Lower panels show the percentage of PKH26+ Vγ2+ T cells out of CD3+ T cells overtime after infusion. C). Graph data showing percentages of Vγ2+ cells of the CD3+ T-cell population in BALF samples collected from 3 monkeys overtime after infusion. D). Representative flow histograms showing that infused Vγ2+ cells were still able to produce TNF-α in response to HMBPP stimulation at 24 and 48 hours post infusion. Numbers in upper-right quadrants indicate the percentages of cytokine-producing Vγ2+ cells out of total Vγ2+ population.
Fig.3
Fig.3. Adoptive transfer of autologous γδ T cells after Mtb infection led to early increases in pulmonary Vγ2Vδ2 T-cell subset with proliferating phenotype
A). Representative flow histograms on left show the percentage of Vγ2+ T cells in BALF samples from the test group infused with Vγ2Vδ2 T cells and the control groups infused with PBL or saline overtime after Mtb infection. Numbers in histograms indicate the percentages of Vγ2+ T cells in CD3+ T-cell population. Vγ2 T cells were interpreted as Vγ2Vδ2 T cells as described in our previous publications. Graph data on right show fold changes in the percentages of Vγ2+ T cells in BALF samples from the test group and the control groups. (B). Representative flow cytometry histograms(left) and graph data(right) show that the test group, but not control groups, exhibited >10-fold increases in percentages of Vγ2Vδ2 T cells expressing Ki67, the marker for cell proliferation, in airway BALF collected at 1 week after infusion. Similar increases were seen for test and control groups at 3 weeks and latter time points in airway BALF. Similar trends of results were seen in the blood(data not shown)
Fig.4
Fig.4. Adoptive transfer of Vγ2Vδ2 T cells in Mtb-infected macaques led to decreases in Mtb infection burdens in lungs and extra-pulmonary organs, without apparent losses of body weights
A). Graph data showing percentage of body weight losses in the three groups of macaques at indicated time points after Mtb infection. Values are expressed as means ± SEM. B). and C). Graph data showing bacterial burdens (CFU counts) in homogenized tissues (1 cm3) of different lung lobes (B) and extra-pulmonary organs (C) collected at the necropsy time from the test and control groups. Values are expressed as means ± SEM. P values are results from non-parametric t test. *P < 0.05; **P < 0.01. Similar trends were seen via ANOVA analysis.
Fig.5
Fig.5. Adoptive transfer of Vγ2Vδ2 T cells in Mtb-infected macaques could result in attenuation of TB lesions and containment of TB in the right caudal lobe(infection site)
A). Shown are representative digital pictures of cut sections of all lung lobes from the test control groups. The right caudal lung lobe, the Mtb infection site, was displayed in the bottom right side of each photo. Lungs and other organs were obtained in necropsy at week 9 after Mtb infection. The test group of macaques showed apparent decreases in severity of TB lesions and extent of TB dissemination to the upper right lung lobes, left lung lobes and extra-pulmonary organs compared to the PBL and saline control groups. Extent and severity of the TB lesions could be adjudged based on the examples pointed by white arrows indicating caseation pneumonia or extensive coalescing granulomas and by small arrows demonstrating less-coalescing or non-coalescing granulomas. Vertical/horizontal bars at bottom-left represent the 1-cm scale derived from the fluorescence rulers of each original photo. Comparative gross pathology of extra-pulmonary organs was shown in Supplemental Fig.S4.(A),(B). B). Graph data of mean gross pathology scores between the test and control groups. Gross pathology scoring was performed blindly as previously reported in our serial publications. Values are expressed as means ± SEM. P values are results from non-parametric t test. *P < 0.05; ***P < 0.001. Similar p values were seen via ANOVA analysis. C). Histology evaluation of tissue sections of right caudal lung lobes from the test and control groups. Shown are H&E stained sections taken from three representative macaques for each group, with macaque ID and magnification indicated for each image. Note that the PBL and saline controls displayed extensive necrotic TB lesions (red arrows), with inflammatory cells and edema fluid presenting in the peripheries of TB granulomas in the right caudal and other lung lobes. TB granulomas identified in the right caudal lobes from the test group usually exhibited more lymphocytic and less necrotic histopathology than those from the control groups. Most macaques in the test group showed small and well-contained TB granulomas in right caudal lobes, with numerous infiltrating lymphocytes forming cuffs (blue arrows) in the peripheries of TB granulomas. More comparative histopathology data are shown in Supplemental Fig.S4.(A),(B).
Fig.6
Fig.6. Lung resident Vγ2Vδ2 T cells in the infection site
Representative in situ confocal microscopic images (63x NA) of Vγ2 T effector cells that express the proliferating marker Ki67 and tissue-resident marker CXCR3 in tissue sections of the right caudal lung lobes from the test group infused with Vγ2Vδ2 T cells(top panel,CN8738) and the control group infused with PBL(bottom panel,CN7837). The Vγ2 TCR (green) in the test group appear to co-express with Ki67 (red) and CXCR3 (yellow) in the merged images (co-localization marked by arrows) in lung tissue sections. The bottom panel shows very few Vγ2+ cells or Ki67+ cells detected in the right caudal lung section from the representative PBL control group. References of image sizes were marked in bottom right corner. Similar results for Vγ2 T effector cells were seen in other test and control macaques. IgG isotype controls did not give rise to any immune staining in the lung TB tissue sections [see Supplemental Fig.S4.(C)].

References

    1. Wells CD, Cegielski JP, Nelson LJ, Laserson KF, Holtz TH, Finlay A, Castro KG, Weyer K. HIV Infection and Multidrug-Resistant Tuberculosis—The Perfect Storm. Journal of Infectious Diseases. 2007;196:S86–S107. - PubMed
    1. Lawn SD, Zumla AI. Tuberculosis. The Lancet. 2011;378:57–72. - PubMed
    1. Colditz GA, Brewer TF, Berkey CS, Mosteller F. Efficacy of bcg vaccine in the prevention of tuberculosis: Meta-analysis of the published literature. JAMA. 1994;271:698–702. - PubMed
    1. Kaufmann HSE, Gengenbacher M. Recombinant live vaccine candidates against tuberculosis. Current Opinion in Biotechnology. 2012;23:900–907. - PubMed
    1. RODRIGUES LC, DIWAN VK, WHEELER JG. Protective Effect of BCG against Tuberculous Meningitis and Miliary Tuberculosis: A Meta-Analysis. International Journal of Epidemiology. 1993;22:1154–1158. - PubMed

Publication types

MeSH terms