

Soluble Axl is an accurate biomarker of cirrhosis and hepatocellular carcinoma development: results from a large scale multicenter analysis
- PMID: 28526812
- PMCID: PMC5542263
- DOI: 10.18632/oncotarget.17598
Soluble Axl is an accurate biomarker of cirrhosis and hepatocellular carcinoma development: results from a large scale multicenter analysis
Abstract
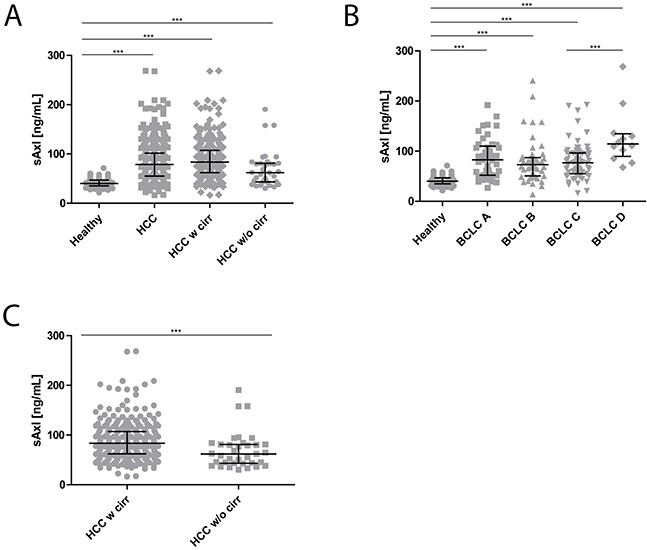
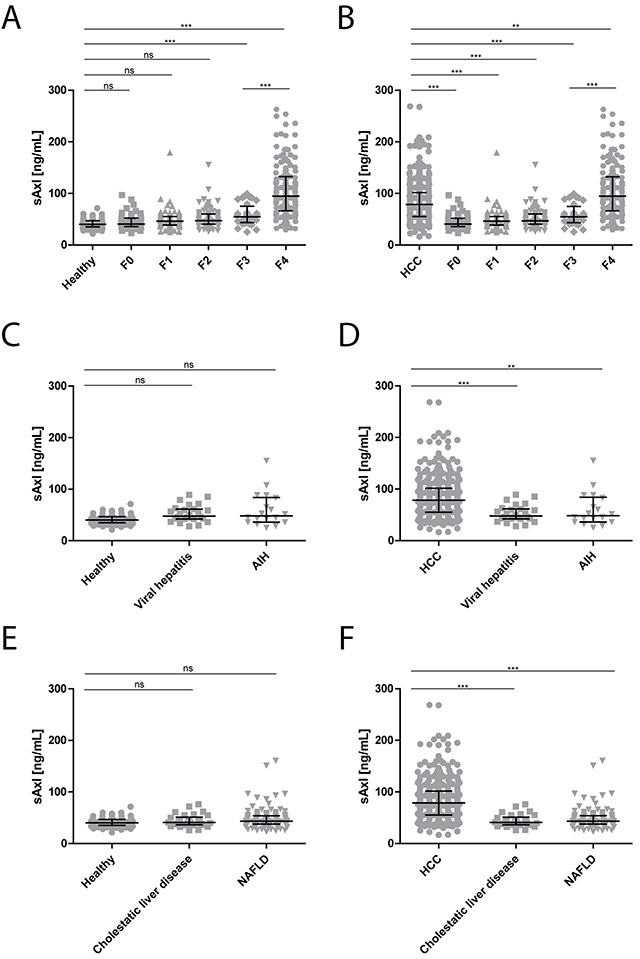
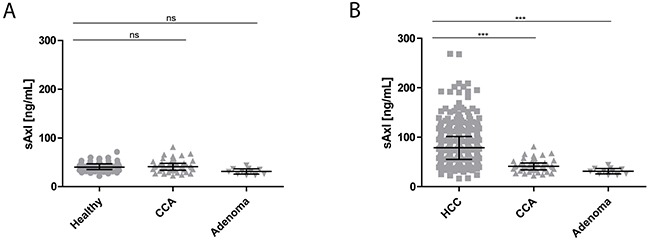
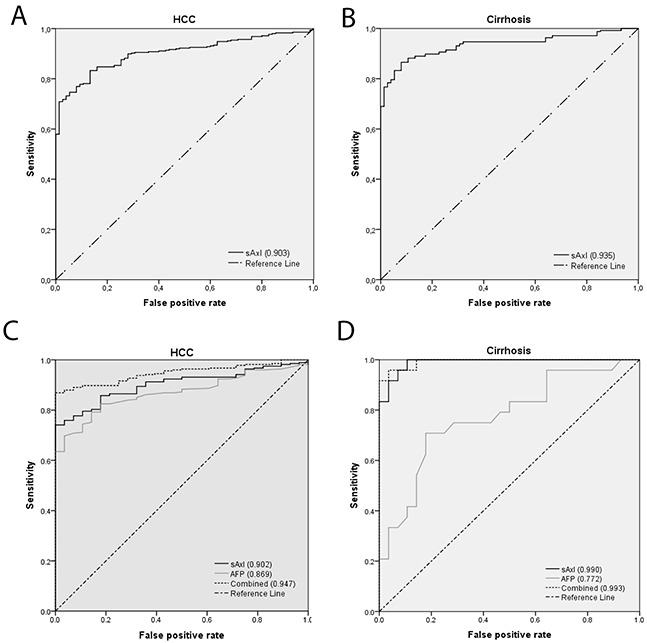
Patients with chronic liver disease (CLD) and cirrhosis are at high risk for hepatocellular carcinoma (HCC). Current diagnostic tools for HCC detection include imaging techniques and serum biomarkers such as α-fetoprotein (AFP). Yet, these methods are limited in sensitivity and specificity to accurately detect early HCC. Here we focused on the potential of soluble Axl (sAxl) as a biomarker in CLD patients by analyzing serum samples of 1067 patients and healthy controls from centers in Europe and Asia. We show that serum concentrations of sAxl were significantly increased at early (82.57 ng/mL) and later stages of HCC (114.50 ng/mL) as compared to healthy controls (40.15 ng/mL). Notably, no elevated sAxl levels were detected in patients with CLD including chronic viral hepatitis, autoimmune hepatitis, cholestatic liver disease, or non-alcoholic fatty liver disease versus healthy controls. Furthermore, sAxl did not rise in liver adenomas or cholangiocarcinoma (CCA). Yet, patients with advanced fibrosis (F3) or cirrhosis (F4) showed enhanced sAxl concentrations (F3: 54.67 ng/mL; F4: 94.74 ng/mL). Hepatic myofibroblasts exhibited an increased release of sAxl, suggesting that elevated sAxl levels arise from these cells during fibrosis. Receiver operating characteristic curve analysis of sAxl displayed a strongly increased sensitivity and specificity to detect both cirrhosis (80.8%/92.0%) and HCC (83.3%/86.7%) with an area under the curve of 0.935/0.903 as compared to AFP. In conclusion, sAxl shows high diagnostic accuracy at early stage HCC as well as cirrhosis, thereby outperforming AFP. Importantly, sAxl remains normal in most common CLDs, liver adenomas and CCA.
Keywords: biomarker; cirrhosis; fibrosis; hepatocellular carcinoma; soluble Axl.
Conflict of interest statement
The authors declare no conflicts of interest.
Figures
Similar articles
-
Multicenter analysis of soluble Axl reveals diagnostic value for very early stage hepatocellular carcinoma.Int J Cancer. 2015 Jul 15;137(2):385-394. doi: 10.1002/ijc.29394. Epub 2015 Jan 13. Int J Cancer. 2015. PMID: 25529751 Free PMC article.
-
Soluble Axl Is a Novel Diagnostic Biomarker of Hepatocellular Carcinoma in Chinese Patients with Chronic Hepatitis B Virus Infection.Cancer Res Treat. 2020 Jul;52(3):789-797. doi: 10.4143/crt.2019.749. Epub 2020 Mar 5. Cancer Res Treat. 2020. PMID: 32138467 Free PMC article.
-
The non-invasive serum biomarker soluble Axl accurately detects advanced liver fibrosis and cirrhosis.Cell Death Dis. 2017 Oct 26;8(10):e3135. doi: 10.1038/cddis.2017.554. Cell Death Dis. 2017. PMID: 29072690 Free PMC article.
-
Dynamics of Axl Receptor Shedding in Hepatocellular Carcinoma and Its Implication for Theranostics.Int J Mol Sci. 2018 Dec 18;19(12):4111. doi: 10.3390/ijms19124111. Int J Mol Sci. 2018. PMID: 30567378 Free PMC article. Review.
-
Gas6/TAM Signaling Components as Novel Biomarkers of Liver Fibrosis.Dis Markers. 2019 Sep 8;2019:2304931. doi: 10.1155/2019/2304931. eCollection 2019. Dis Markers. 2019. PMID: 31583026 Free PMC article. Review.
Cited by
-
GAS6/TAM Axis as Therapeutic Target in Liver Diseases.Semin Liver Dis. 2024 Feb;44(1):99-114. doi: 10.1055/a-2275-0408. Epub 2024 Feb 23. Semin Liver Dis. 2024. PMID: 38395061 Free PMC article.
-
Updating the Clinical Application of Blood Biomarkers and Their Algorithms in the Diagnosis and Surveillance of Hepatocellular Carcinoma: A Critical Review.Int J Mol Sci. 2023 Feb 21;24(5):4286. doi: 10.3390/ijms24054286. Int J Mol Sci. 2023. PMID: 36901717 Free PMC article. Review.
-
Diagnostic Efficacy and Possible Underlying Mechanisms of Noninvasive Clinical Markers in Hepatocellular Carcinoma.J Clin Transl Hepatol. 2023 Aug 28;11(4):889-898. doi: 10.14218/JCTH.2022.00285. Epub 2023 Jan 28. J Clin Transl Hepatol. 2023. PMID: 37408805 Free PMC article.
-
AXL Overexpression in Tumor-Derived Endothelial Cells Promotes Vessel Metastasis in Patients With Hepatocellular Carcinoma.Front Oncol. 2021 May 27;11:650963. doi: 10.3389/fonc.2021.650963. eCollection 2021. Front Oncol. 2021. PMID: 34123800 Free PMC article.
-
A meta-analysis and of clinical values of 11 blood biomarkers, such as AFP, DCP, and GP73 for diagnosis of hepatocellular carcinoma.Ann Med. 2023 Dec;55(1):42-61. doi: 10.1080/07853890.2022.2153163. Ann Med. 2023. Retraction in: Ann Med. 2024 Dec;56(1):2415160. doi: 10.1080/07853890.2024.2415160. PMID: 36476015 Free PMC article. Retracted.
References
-
- El-Serag HB, Rudolph KL. Hepatocellular carcinoma: epidemiology and molecular carcinogenesis. Gastroenterology. 2007;132:2557–2576. - PubMed
-
- Forner A, Llovet JM, Bruix J. Hepatocellular carcinoma. Lancet. 2012;379:1245–1255. - PubMed
-
- Ikai I, Kudo M, Arii S, Omata M, Kojiro M, Sakamoto M, Takayasu K, Hayashi N, Makuuchi M, Matsuyama Y, Monden M. Report of the 18th follow-up survey of primary liver cancer in Japan. Hepatol Res. 2010;40:1043–1059. - PubMed
-
- Llovet JM, Bustamante J, Castells A, Vilana R, Ayuso Mdel C, Sala M, Bru C, Rodes J, Bruix J. Natural history of untreated nonsurgical hepatocellular carcinoma: rationale for the design and evaluation of therapeutic trials. Hepatology. 1999;29:62–67. - PubMed
Publication types
MeSH terms
Substances
LinkOut - more resources
Full Text Sources
Other Literature Sources
Medical
Research Materials
Miscellaneous
