. 2017 May 19;7(1):2186.
doi: 10.1038/s41598-017-02257-3.

Super-Enhancers and Broad H3K4me3 Domains Form Complex Gene Regulatory Circuits Involving Chromatin Interactions

Affiliations

Super-Enhancers and Broad H3K4me3 Domains Form Complex Gene Regulatory Circuits Involving Chromatin Interactions

Fan Cao et al. Sci Rep. .

Abstract

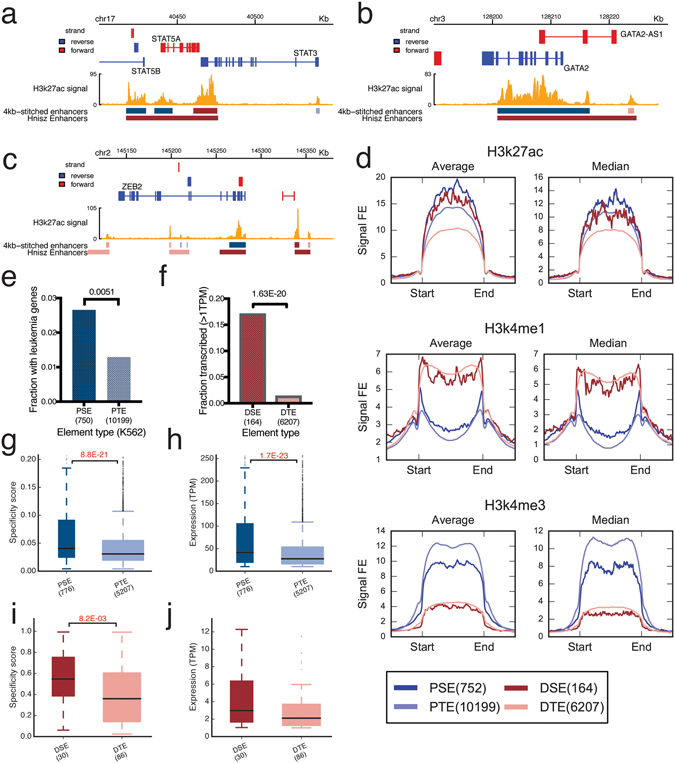
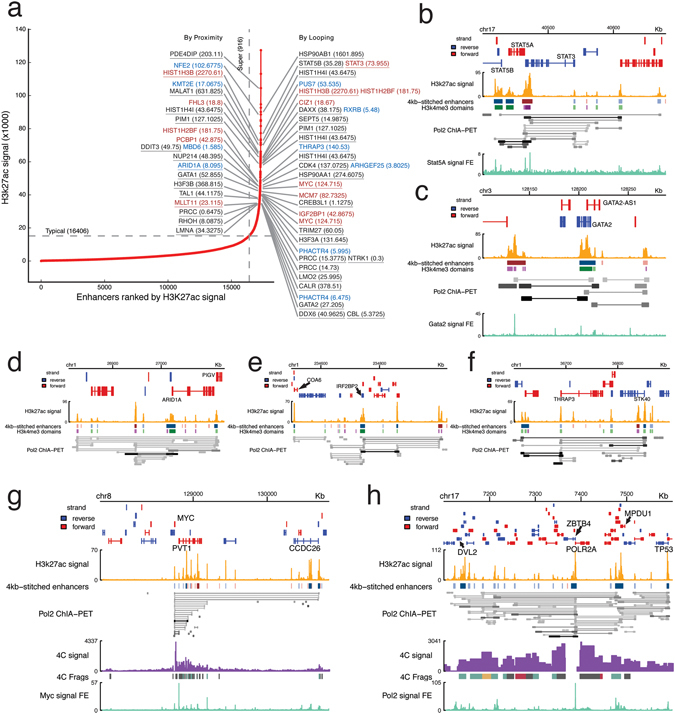
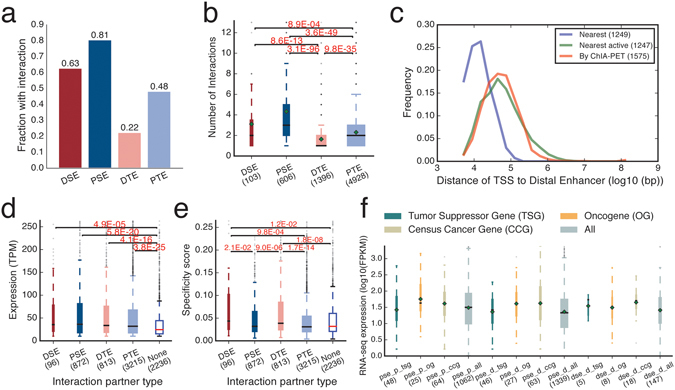
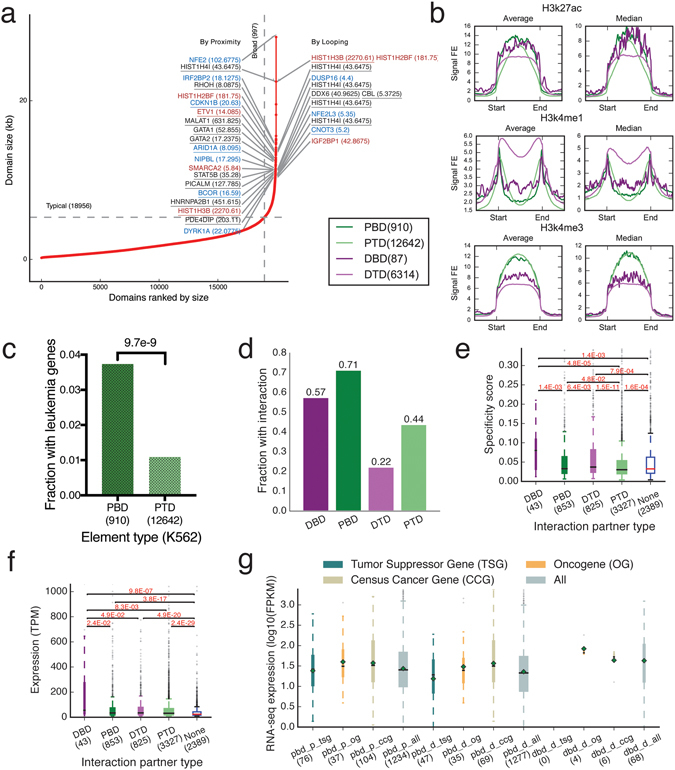
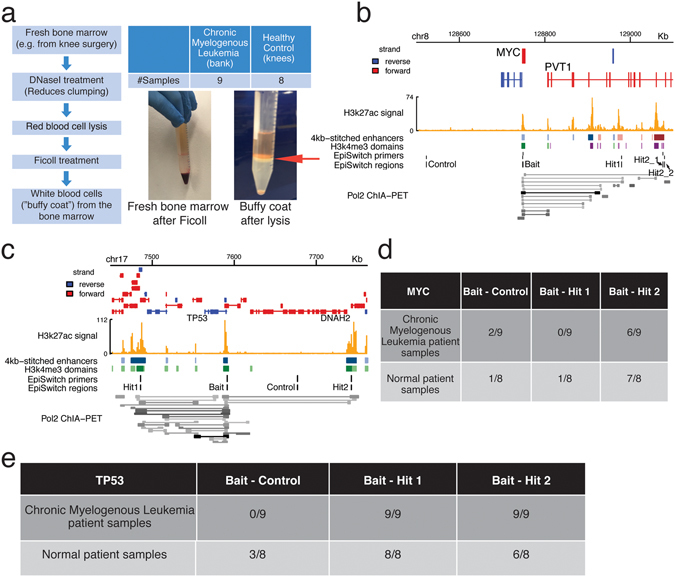
Stretched histone regions, such as super-enhancers and broad H3K4me3 domains, are associated with maintenance of cell identity and cancer. We connected super-enhancers and broad H3K4me3 domains in the K562 chronic myelogenous leukemia cell line as well as the MCF-7 breast cancer cell line with chromatin interactions. Super-enhancers and broad H3K4me3 domains showed higher association with chromatin interactions than their typical counterparts. Interestingly, we identified a subset of super-enhancers that overlap with broad H3K4me3 domains and show high association with cancer-associated genes including tumor suppressor genes. Besides cell lines, we could observe chromatin interactions by a Chromosome Conformation Capture (3C)-based method, in primary human samples. Several chromatin interactions involving super-enhancers and broad H3K4me3 domains are constitutive and can be found in both cancer and normal samples. Taken together, these results reveal a new layer of complexity in gene regulation by super-enhancers and broad H3K4me3 domains.


Conflict of interest statement

M.J.F. declares two patents on methodologies related to ChIA-PET. A.R., J.G., M.S., E.H. and A.A. are employees of Oxford Biodynamics Plc, a company based on chromatin interaction biomarkers and which owns patents on chromatin interaction analysis methods. No other conflicts of interest are declared.

Figures

Figure 1
Figure 1
Characterizing proximal and distal super-enhancers. (ac) Screenshots of proximal super-enhancers and distal super-enhancers at GATA2 and STAT5A/B, and ZEB2 regions. The tracks shown are: (from top to bottom) (1) Genes, (2) K562 H3K27ac ChIP-Seq signal, (3) called typical enhancers and super-enhancers (dark red indicates distal super-enhancers, dark blue indicates proximal super-enhancers, light pink indicates distal typical enhancers and light blue indicates proximal typical enhancers), and (4) Super-enhancers in K562 reported by Hnisz et al. (d) Histone modifications (H3K27ac, H3K4me1, H3K4me3) at the four types of regulatory elements, including proximal super-enhancers (PSE), proximal typical enhancers (PTE), distal super-enhancers (DSE) and distal typical enhancers (DTE). (e) The fraction of proximal elements found at leukemia associated genes. (f) Fractions of distal super-enhancers (DSE) and distal typical enhancers (DTE) associated with enhancer transcription. TPM indicates tags per million sequences. (g,h) The specificities (g) and expression levels (h) of CAGE clusters at proximal super-enhancers and proximal typical enhancers. All boxplots presented were prepared in the following manner: the black horizontal line indicates the median, the top and bottom of the box indicates the third and first quartile respectively, and the whiskers indicate 1.5* the interquartile range. Widths of boxes are in proportion to the square root of the number of data points in each category and the statistics testing was done using Dunn’s Test. (i,j) The cell-type specificities (i) and expressions (j) of enhancer RNAs at distal super-enhancers (DSE) and distal typical enhancers (DTE). See also Figure S2 for MCF-7.
Figure 2
Figure 2
Super-enhancers associated with chromatin interactions. (a) Signal rank plot with targeted genes by proximity and by looping. Blue: tumor suppressor genes. Red: oncogenes. Underlined: cancer census genes. (bf) Screenshots of super-enhancers and chromatin interactions at STAT5A/B, GATA2, ARID1A, IRF2BP2, THRAP3. (g,h) Screenshots with 4C-Seq data at POLR2A and MYC.
Figure 3
Figure 3
(a) Fractions of the four types of elements associated with at least one chromatin interaction. (b) Boxplot for the number of interactions each type of element has (only interacting elements were included). (c) Distribution of distances of the nearest TSS (blue), nearest active TSS (green), and TSSes through chromatin interactions (red) to the center of distal super-enhancers. (d,e) The expression levels (d) and cell-type specificity scores (e) of CAGE clusters at proximal elements that are connected to the four types of elements as indicated on the x-axis. “None” indicates the set of CAGE clusters located at non-interacting proximal elements. (f) The expression levels of tumor suppressor genes (tsg), oncogenes (og), and cencus cancer genes (ccg) targeted by broad domains through proximity (pse_p) and looping (pse_d and dse_d) measured by RNA-Seq. Data shown is for K562. See Figure S3 for MCF-7.
Figure 4
Figure 4
Analysis of broad H3K4me3 peaks and chromatin interactions. (a) Rank of H3K4me3 peaks by size and the cancer associated genes targeted by some broad domains. (b) Some histone modifications at the four types of H3K4me3 domains. (c) The fraction of proximal broad and typical domains located near leukemia associated genes. p-value is produced Fisher’s Exact Test. (d) The fraction of each type of elements by H3K4me3 involved in chromatin interactions. (e,f) The cell-type specificity scores (e) and expression levels (f) of CAGE clusters at proximal H3K4me3 elements that are connected to the four types of H3K4me3 elements as indicated on the x-axis. “None” indicates the set of CAGE clusters located at non-interacting proximal elements. (g) The expression levels of tumor suppressor genes (tsg), oncogenes (og), and cencus cancer genes (ccg) targeted by broad domains through proximity (pbd_p) and looping (pbd_d and dbd_d) measured by RNA-Seq. Data shown is for K562. See Figure S4 for MCF-7.
Figure 5
Figure 5
Overlap between super-enhancers and broad H3K4me3 domains in K562 cells. (a) Histone modifications at proximal regions with both super-enhancers and broad H3K4me3 domains (P_SE_BD), only super-enhancers (P_SE_O), only broad H3K4me3 domains (P_BD_O), and neither (P_O_O). (b) Histone modifications at distal regions with both super-enhancers and broad H3K4me3 domains (D_SE_BD), super-enhancers only (D_SE_O), broad H3K4me3 domains only (D_BD_O), and neither (D_O_O). (c) The fraction of different regions involved in chromatin interactions. (d) Boxplot of number of chromatin interactions each type of regions is involved in. (e) Pairwise comparison of enrichment at oncogenes (OG), tumor suppressor genes (TSG), COSMIC census cancer genes (CCG), and housekeeping genes (HKG) between different distal regions through looping (left), and different proximal regions through looping (middle) and proximity (right). Comparison was performed using Fisher’s Exact Test followed by Holm-Šídák correction for multiple testing. The color indicates the product of negative log-transformed p-values and sign of the log-transformed corresponding odds ratio.
Figure 6
Figure 6
Constitutive circuits in cancer involving super-enhancers and broad H3K4me3 domains. (a) Flowchart of bone marrow preparation for EpiSwitch™ analyses, with images showing fresh bone marrow after Ficoll and buffy coat after lysis (the buffy coat is marked by a blue arrow). (b) Genome Browser screenshot of the MYC locus, showing EpiSwitch™ bait and hit regions. (c) Genome Browser screenshot of the TP53 locus, showing EpiSwitch™ bait and hit regions. (d,e) Chromatin interactions at the MYC locus (d) and TP53 locus (e) were screened with EpiSwitch™, together with negative control loci (no chromatin interaction), using CML and non-CML bone marrow samples. “2/9” indicates that of the 9 samples examined, 2 had detected interactions.

References

    1. Loven J, et al. Selective inhibition of tumor oncogenes by disruption of super-enhancers. Cell. 2013;153:320–334. doi: 10.1016/j.cell.2013.03.036. - DOI - PMC - PubMed
    1. Hnisz D, et al. Super-enhancers in the control of cell identity and disease. Cell. 2013;155:934–947. doi: 10.1016/j.cell.2013.09.053. - DOI - PMC - PubMed
    1. Benayoun BA, et al. H3K4me3 breadth is linked to cell identity and transcriptional consistency. Cell. 2014;158:673–688. doi: 10.1016/j.cell.2014.06.027. - DOI - PMC - PubMed
    1. Chen K, et al. Broad H3K4me3 is associated with increased transcription elongation and enhancer activity at tumor-suppressor genes. Nat Genet. 2015;47:1149–1157. doi: 10.1038/ng.3385. - DOI - PMC - PubMed
    1. Babu D, Fullwood MJ. 3D genome organization in health and disease: emerging opportunities in cancer translational medicine. Nucleus. 2015;6:382–393. doi: 10.1080/19491034.2015.1106676. - DOI - PMC - PubMed

Publication types

MeSH terms