Comparative Study
. 2017 Aug:508:127-133.
doi: 10.1016/j.virol.2017.05.008.

Relative efficacy of T cell stimuli as inducers of productive HIV-1 replication in latently infected CD4 lymphocytes from patients on suppressive cART

Affiliations
Comparative Study

Relative efficacy of T cell stimuli as inducers of productive HIV-1 replication in latently infected CD4 lymphocytes from patients on suppressive cART

Nadejda Beliakova-Bethell et al. Virology. 2017 Aug.

Abstract

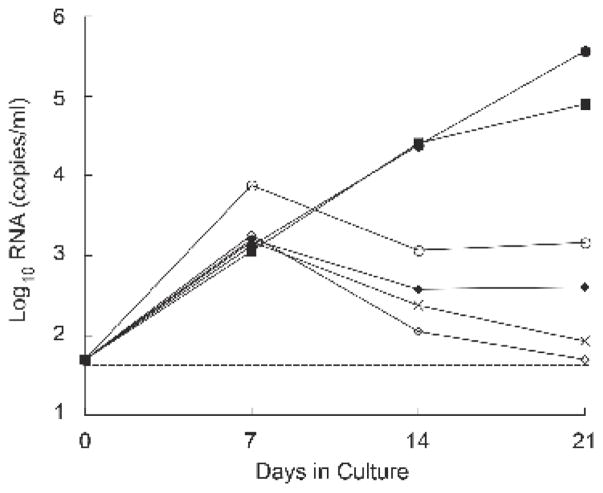
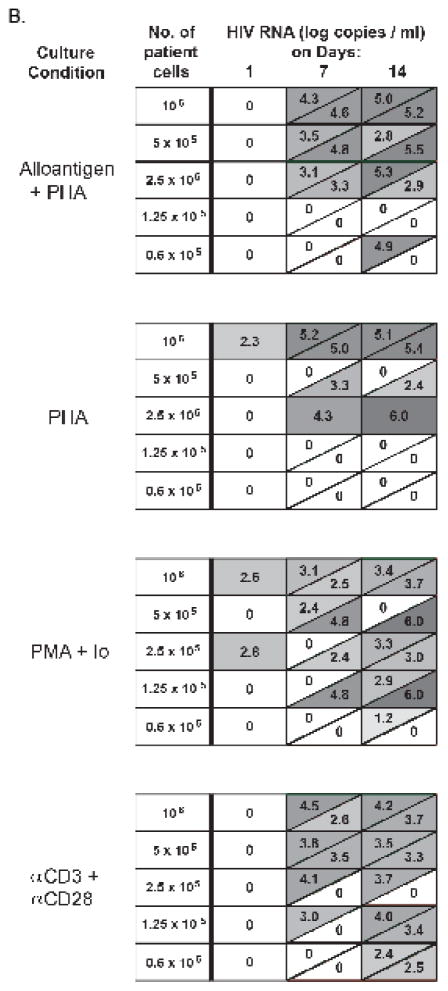
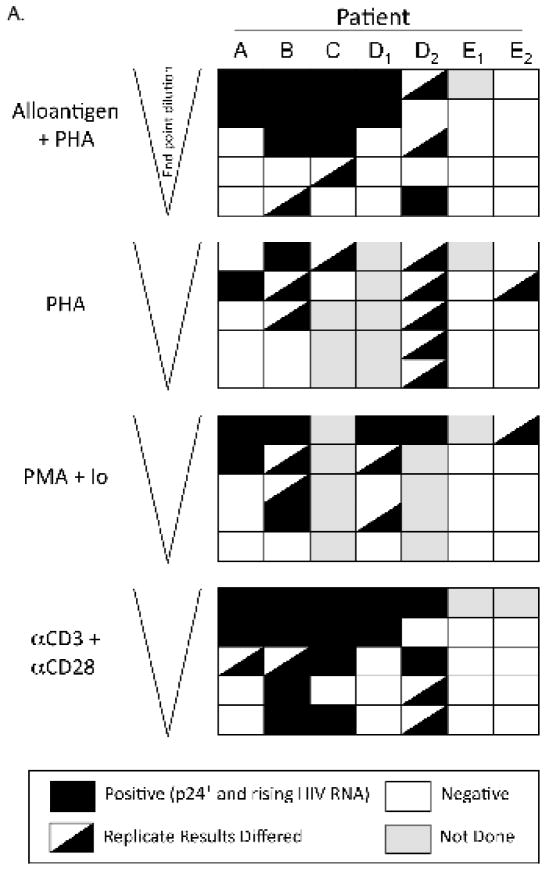
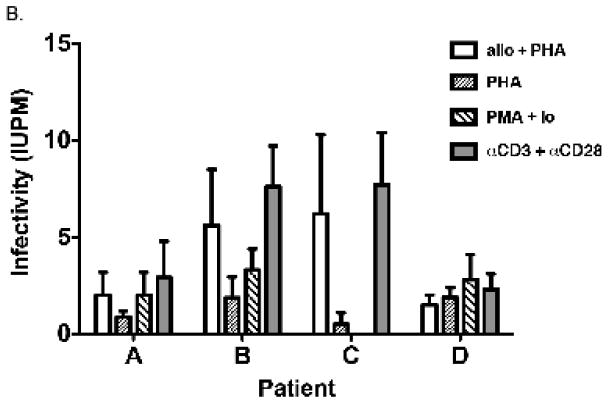
Quantification of cell-associated replication-competent HIV, in blood samples from patients with undetectable plasma viremia, requires specialized culture conditions that include exogenous pan T cell stimulation. Different research groups have used several stimuli for this purpose; however, the relative efficacies of these T cell stimuli to induce productive HIV replication from latently infected cells ex vivo have not been systematically evaluated. To this end, we compared four commonly used T cell stimuli: 1) irradiated allogeneic cells plus phytohaemagglutinin (PHA); 2) PHA alone; 3) phorbol myristate acetate plus Ionomycin; and 4) immobilized αCD3 plus αCD28 antibodies. End-point dilutions of patient CD4 T cells were performed, using virion RNA production to quantify HIV induction. Our results demonstrated that these activation approaches were not equivalent and that antibody cross-linking of CD3 and CD28 membrane receptors was the most effective means to activate HIV replication from a resting cell state, closely followed by stimulation with irradiated allogeneic cells plus PHA.

Keywords: Assay optimization; Cell-associated infectious units; HIV latency; T cell stimuli.


Figures

Figure 1
Figure 1. Quantification of HIV RNA levels in co-culture supernatants during the first 21 days of culture for patient F
(○) PHA-stimulated HC total PBL plus αCD3 + αCD28-stimulated patient PBL. (X) PHA-stimulated HC total PBL plus αCD3 + αCD28-stimulated patient CD8-depleted PBL. (◇) PHA-stimulated HC total PBL plus αCD3 + αCD28-stimulated patient CD8-depleted PBL plus monocytes. (◆) PHA-stimulated HC CD8-depleted PBL plus αCD3 + αCD28-stimulated patient total PBL. (■) PHA-stimulated HC CD8-depleted PBL plus αCD3 + αCD28-stimulated patient CD8-depleted PBL. (●) PHA-stimulated HC CD8-depleted PBL plus αCD3 + αCD28-stimulated patient CD8-depleted PBL plus monocytes. (-----) Threshold of detection, 50 copies of HIV RNA/ml. Results from patient F are representative of experiments done with cultured cells from 6 different cART-suppressed patients.
Figure 2
Figure 2. Diagram of co-culture method and detailed results of HIV RNA quantification for patient B
A) CD4-enriched cells from patients were exposed to four different stimulation conditions. Alloantigen consisted of irradiated allogeneic PBMC added to the patient CD4 cells at a ratio of 10:1. Healthy control (HC) donor cells, stimulated with PHA for 48 hours prior, were added to patient cells on days 0 and 7 of culture. Io, Ionomycin. B) HIV RNA concentrations (log10 copies/ml) were assayed in supernate taken from duplicate wells for each co-culture condition for patient B, on days 1, 7 and 14. Each row depicts a cell concentration, with decreasing cell numbers from top to bottom. Each box represents duplicate cultures; a diagonal within a box indicates a result for 1 of 2 replicates. Zero indicates undetectable viral RNA.
Figure 3
Figure 3. Summary of results obtained from HIV RNA quantification of culture supernatants taken at day 14 (patients A–E)
Positive cultures were defined as those with: 1) a positive p24 result (>10 pg/ml) within 21 days of co-culture, and 2) rising RNA concentrations between days 1 and 14. HIV RNA at day 21 was used to confirm a spreading infection. D1, D2 and E1, E2 are the first and second cultures from patient D and E, respectively, which were performed using fresh blood samples taken approximately 2 months apart. A) Each row depicts a cell concentration, with decreasing cell numbers from top to bottom. Each box represents duplicate cultures; a diagonal within a box indicates a result for 1 of 2 replicates. B) Infectivity was estimated from the data shown in (A). Second culture of patient D was used for these analyses, for which data for all the treatments were available. Error bars indicate the estimated infectivity +1 SEM.

References

    1. Abreu CM, Price SL, Shirk EN, Cunha RD, Pianowski LF, Clements JE, Tanuri A, Gama L. Dual role of novel ingenol derivatives from euphorbia tirucalli in HIV replication: inhibition of de novo infection and activation of viral LTR. PLoS ONE. 2014;9:e97257. - PMC - PubMed
    1. Archin NM, Bateson R, Tripathy MK, Crooks AM, Yang K-H, Dahl NP, Kearney MF, Anderson EM, Coffin JM, Strain MC, Richman DD, Robertson KR, Kashuba AD, Bosch RJ, Hazuda DJ, Kuruc JD, Eron JJ, Margolis DM. HIV-1 expression within resting CD4+ T cells after multiple doses of vorinostat. J Infect Dis. 2014;210:728–735. - PMC - PubMed
    1. Archin NM, Espeseth A, Parker D, Cheema M, Hazuda D, Margolis DM. Expression of latent HIV induced by the potent HDAC inhibitor suberoylanilide hydroxamic acid. AIDS Res Hum Retroviruses. 2009a;25:207–212. - PMC - PubMed
    1. Archin NM, Keedy KS, Espeseth A, Dang H, Hazuda DJ, Margolis DM. Expression of latent human immunodeficiency type 1 is induced by novel and selective histone deacetylase inhibitors. AIDS. 2009b;23:1799–1806. - PMC - PubMed
    1. Archin NM, Liberty AL, Kashuba AD, Choudhary SK, Kuruc JD, Crooks AM, Parker DC, Anderson EM, Kearney MF, Strain MC, Richman DD, Hudgens MG, Bosch RJ, Coffin JM, Eron JJ, Hazuda DJ, Margolis DM. Administration of vorinostat disrupts HIV-1 latency in patients on antiretroviral therapy. Nature. 2012;487:482–485. - PMC - PubMed

Publication types

Substances