. 2017 Jun 6;8(6):1497-1505.
doi: 10.1016/j.stemcr.2017.04.024. Epub 2017 May 18.

MicroRNA Signatures and Molecular Subtypes of Glioblastoma: The Role of Extracellular Transfer

Affiliations

MicroRNA Signatures and Molecular Subtypes of Glioblastoma: The Role of Extracellular Transfer

Jakub Godlewski et al. Stem Cell Reports. .

Abstract

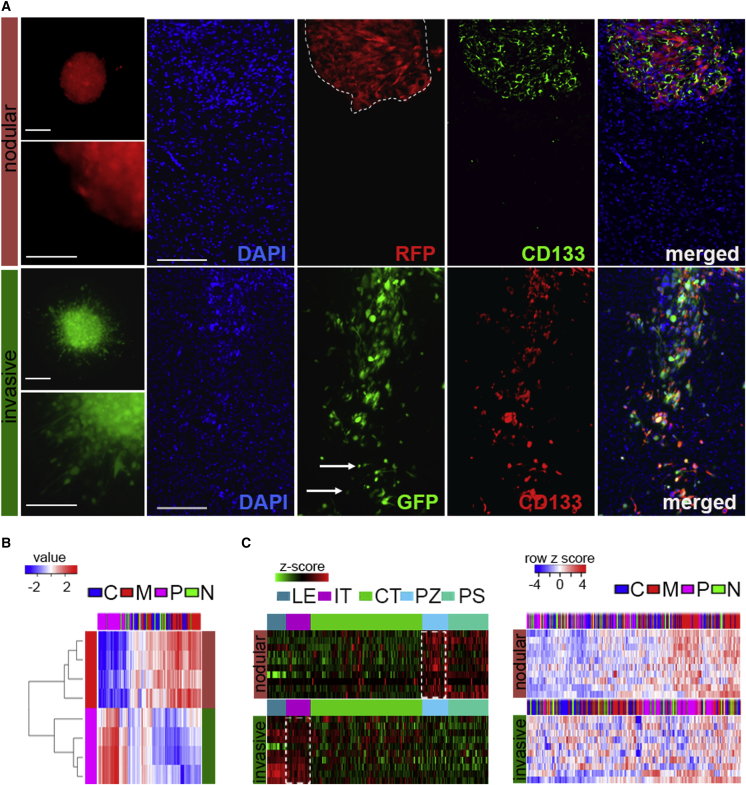
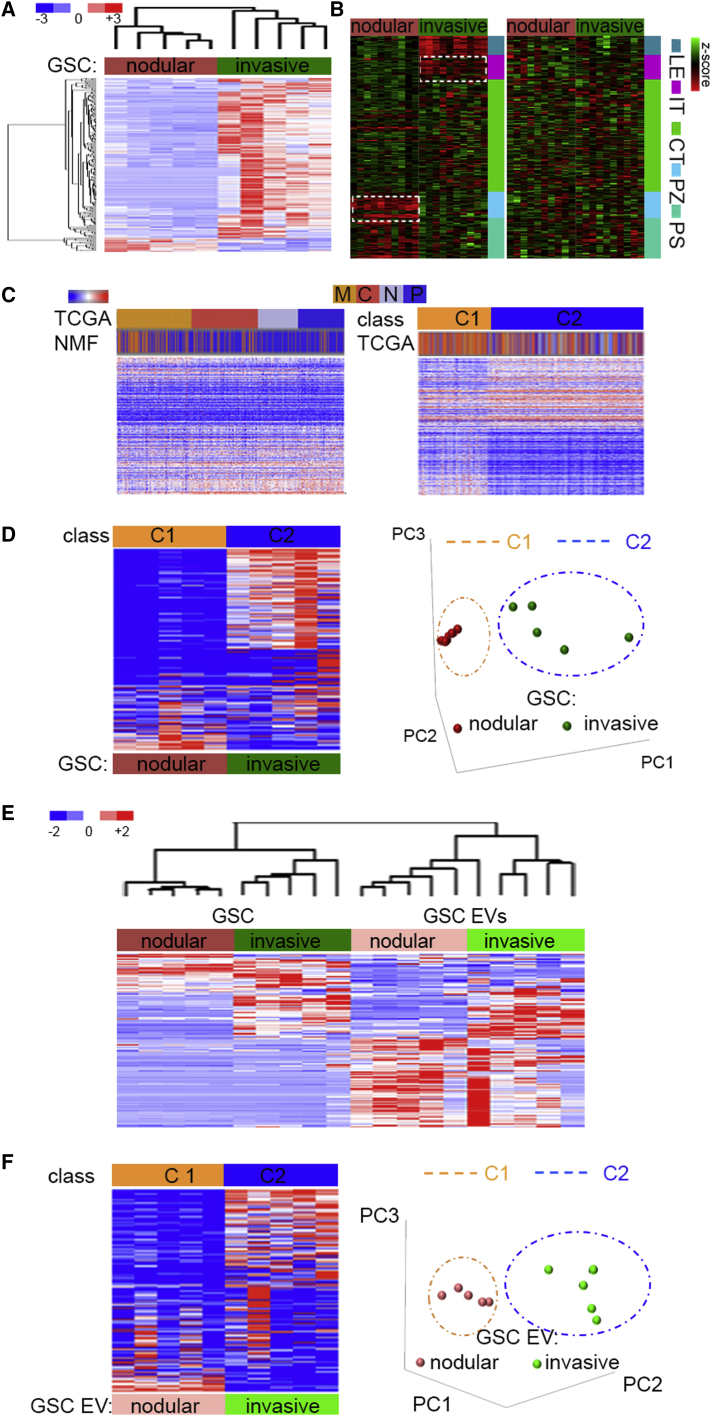
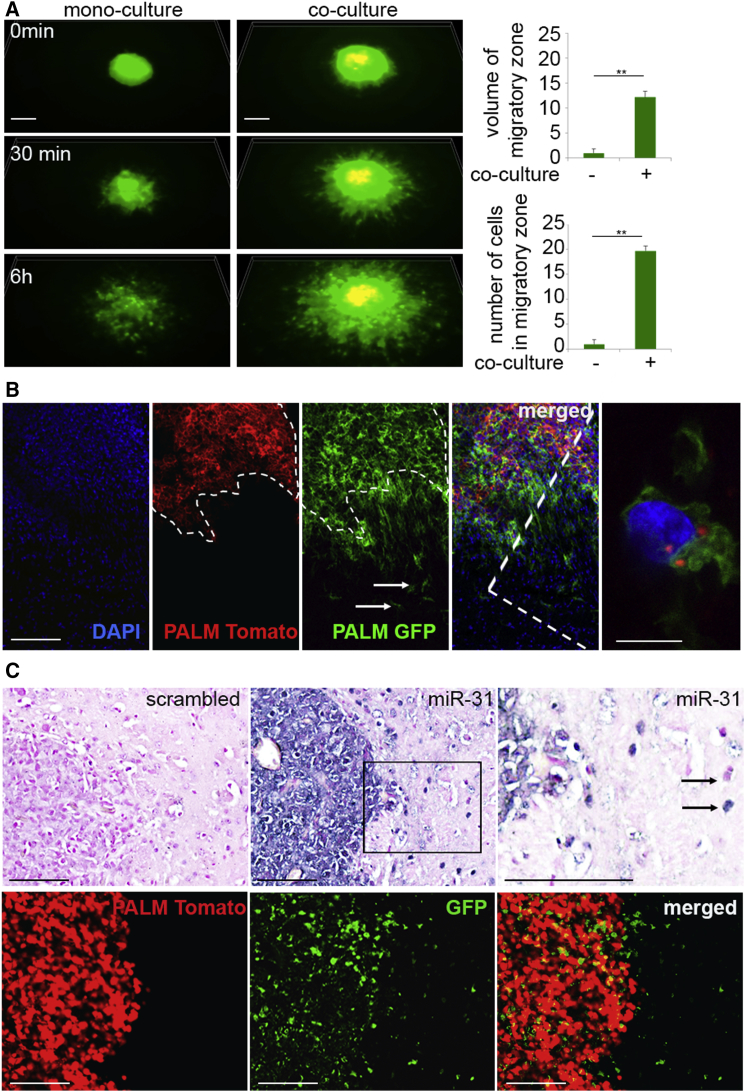
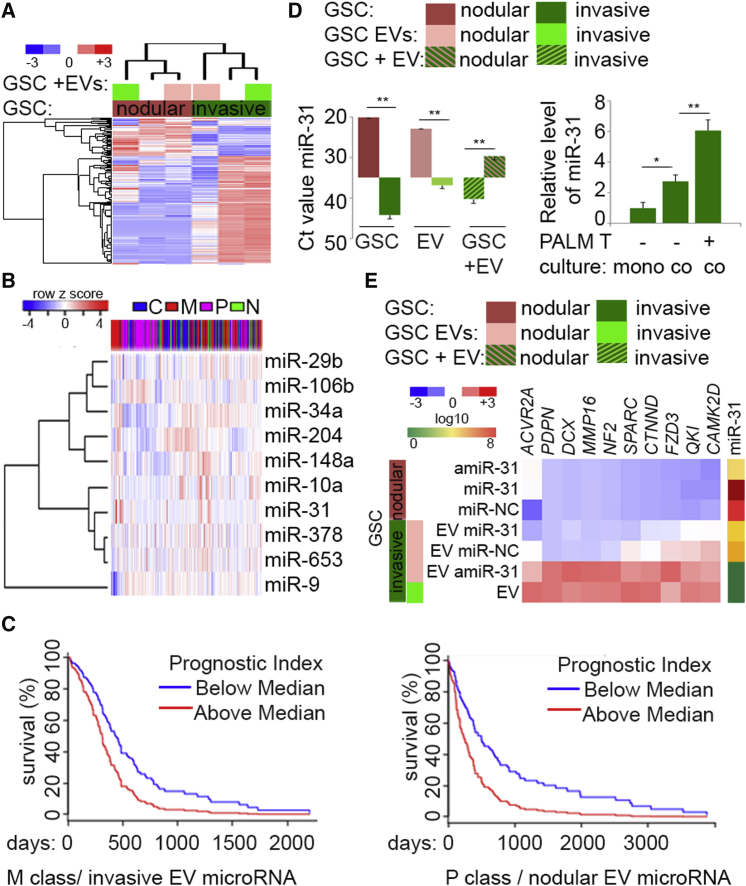
Despite the importance of molecular subtype classification of glioblastoma (GBM), the extent of extracellular vesicle (EV)-driven molecular and phenotypic reprogramming remains poorly understood. To reveal complex subpopulation dynamics within the heterogeneous intratumoral ecosystem, we characterized microRNA expression and secretion in phenotypically diverse subpopulations of patient-derived GBM stem-like cells (GSCs). As EVs and microRNAs convey information that rearranges the molecular landscape in a cell type-specific manner, we argue that intratumoral exchange of microRNA augments the heterogeneity of GSC that is reflected in highly heterogeneous profile of microRNA expression in GBM subtypes.

Keywords: GBM; cancer heterogeneity; cancer stem cells; exosomes; extracellular vesicles; glioblastoma; microRNA; subtypes.


Figures

Figure 1
Figure 1
Intratumoral Architecture Is Imposed by Phenotype/Transcriptome-Diverse GSCs (A) Patient-derived GSCs have distinct phenotypes in vitro and in vivo. Representative micrographs of GSC spheroids (left, n = 10 independent GSCs; scale bars, 100 μm and 50 μm) and GSC-derived intracranial tumors with CD133 immunostaining (right, n = 6 independent GSCs; scale bar, 150 μm). Nodular tumor and infiltrating tumor cells are indicated by the dashed line and arrows, respectively. (B) Signature of genes with proproliferative or proinvasive function classifies GSC subpopulations. Gene expression (n = 8 independent GSCs, n = 4 per subclass) in selected categories of GSCs was queried with a gene signature retrieved from the TCGA GBM dataset, and identified by clustering as expression correlation analysis. C, classical; M, mesenchymal; P, proneural; N, neural. (C) The phenotype-determining transcriptome overlap with tumor anatomic site-specific expression. The top ten genes in each category (n = 8 independent GSCs, n = 4 per subclass) (proproliferative or proinvasive) were queried with Ivy GAP database-based expression signature in different anatomic areas of GBM (left; LE, leading edge; IT, infiltrating tumor; CT, cellular tumor; PZ, perinecrotic zone; PS, pseudopalisading cells), or a gene signature retrieved from the TCGA GBM dataset and identified by clustering with subtype prediction (right; C, classical; M, mesenchymal; P, proneural; N, neural). See also Figure S1.
Figure 2
Figure 2
GBM Subtypes Are Characterized by Highly Heterogeneous MicroRNA Profiles (A) MicroRNA profile distinguishes nodular and invasive GSCs. MicroRNA sets that vary coherently between GSCs (n = 10 independent GSCs, n = 5 per subclass) were identified by supervised clustering (fold >2, p < 0.05). (B) MicroRNAs downregulated in GSC subpopulations (n = 10 independent GSCs, n = 5 per subclass) lack correlation with tumor anatomic site expression of their targets. IPA-based analysis of selected microRNA/mRNA target expression showed negative correlation (low microRNA/high target expression, left panels), and lack of correlation (high microRNA/low target expression, right panels). The top ten genes in each category were queried with Ivy GAP database-based expression signature in different areas of GBM (LE, leading edge; IT, infiltrating tumor; CT, cellular tumor; PZ, perinecrotic zone; PS, pseudopalisading cells). White dashed box indicates genes upregulated in PZ and LE zones. (C) TCGA-classified GBM subtypes are characterized by highly heterogeneous profiles of microRNA expression. Hierarchical clustering of expression of 534 microRNAs in a core set of TCGA GBM samples (n = 173 patient samples) in supervised analysis (TCGA subtypes, top cluster) compared with unsupervised analysis (using NMF, bottom cluster) (left); and in supervised analysis (NMF-based classification into two classes C1 and C2, top cluster) versus unsupervised analysis (TCGA subtypes, bottom cluster) (right; C, classical; M, mesenchymal; P, proneural; N, neural; 200 microRNAs, false discovery rate [FDR] < 0.05). (D) GSC microRNA expression data reveals two profiles in TCGA-classified GBM subtypes. Hierarchical clustering (left) and principal component analysis (right) of microRNAs using 396 predictive microRNAs expressed in GSC subpopulations (n = 10 independent GSCs, n = 5 per subclass) and ordered based on gene subtype predictions using the core set of TCGA GBM samples (n = 173 patient samples) (NMF1 versus NMF2; 200 microRNAs, FDR < 0.05). (E) GSCs and GSC EV microRNA profiles separate cells and EVs. Hierarchical clustering of expression of 692 microRNAs in GSCs (n = 10 independent GSCs, n = 5 per subclass) and GSC EVs (n = 10 EVs from independent GSCs, n = 5 per subclass) in unsupervised analysis. (F) GSC EV microRNA expression data reveal two profiles in TCGA-classified GBM subtypes. Hierarchical clustering (left) and principal component analysis (right) of EV microRNAs using the curated list of 298 predictive microRNAs secreted in EVs released by distinct GSC subpopulations (n = 10 independent GSCs, n = 5 per subclass) and ordered based on gene subtype predictions using the core set of 173 TCGA GBM samples (n = 173 patient samples). FDR < 0.05. See also Figure S2.
Figure 3
Figure 3
GSC EVs Support Subpopulation-Specific Invasive Phenotype (A) Heterogeneity of GSC spheroids promotes migration of invasive GSCs. Representative micrographs of GSC spheroids in monoculture (n = 3 independent experiments per three independent GSCs) (left) and heterogeneous co-culture (n = 3 independent experiments per three independent GSCs) (middle) in 3D time-lapse frames are shown. GFP-labeled invasive GSCs and PALM-Tomato-labeled nodular GSCs. Scale bar, 100 μm. Relative quantification of migratory zone volume (top right) and number of cells migrated out of spheroid core (bottom right) in mono- versus co-culture. ∗∗p < 0.01. (B) Nodular and invasive phenotype of GSCs is recapitulated in vivo. Representative micrographs of co-implanted heterogeneous tumors (n = 6 independent experiments) are shown. GFP-labeled invasive GSCs and PALM-Tomato-labeled nodular GSCs. Nodular tumor burden and infiltrating tumor cells are indicated by dashed line and arrows, respectively. Intratumoral EV transfer between cells is shown on high-power magnification inset. Scale bars, 150 μm and 10 μm. (C) GSC EV is transferred intratumorally. Representative micrographs of co-implanted heterogeneous tumors (n = 3 independent experiments) are shown. Scrambled or microRNA ISH (nodular specific miR-31) (top) and GFP-labeled invasive GSCs and PALM-Tomato-labeled nodular GSCs (bottom) from consecutive sections. Positive and negative microRNA detection is indicated by arrows. Scale bars, 100 μm. See also Figure S3.
Figure 4
Figure 4
Transfer of EV-Encapsulated MicroRNAs Propagates GBM Heterogeneity (A) Exchange of EV between distinct GSCs shifts subpopulation-specific microRNA signatures. Unsupervised hierarchical clustering of expression of 307 microRNAs in non-treated GSCs (n = 4 independent GSCs, n = 2 per subclass) and EV-treated GSCs (n = 4 independent EVs, n = 2 per subclass) is shown. (B) MicroRNAs upregulated upon EV uptake are diversely expressed in GBM. MicroRNA sets that are coherently upregulated in nodular and invasive GSCs (n = 4 independent GSCs, n = 2 per subclass) upon treatment with EVs (p < 0.05, fold >2) were queried with TCGA-classified GBM dataset and identified by clustering with subtype prediction. C, classical; M, mesenchymal; P, proneural; N, neural. (C) Survival analysis in mesenchymal (left) and proneural (right) GBM subtypes based on the impact of the prognostic index of multiple microRNAs (miR-148a, miR-204, miR-34a, miR-106b, and miR-9 [left], and miR-31, miR-653, miR-378a, miR-29b, and miR-10a [right]) based on retrospective data extrapolated from the TCGA. For mesenchymal GBM (n = 125 patient samples), log-rank p = 0.004, Prognostic Index hazard ratio = 1.83, p = 0.004. For proneural GBM (n = 112 patient samples) log-rank p = 0.001, Prognostic Index hazard ratio = 2.09, p = 0.001. (D) MiR-31 is EV-transferred between GSC subpopulations. Left: qPCR analysis of miR-31 in donor nodular GSCs (n = 3 independent GSCs), their EVs (n = 3 independent GSC EVs), and recipient invasive GSCs (n = 3 independent GSCs). Right: monoculture spheroid of GFP-tagged invasive GSC (mono-) and co-culture spheroids of GFP-tagged invasive GSCs and PALM-Tomato (PALM T) nodular GSCs were sorted for GFP-positive (co-culture negative) or double-positive (GFP and Tomato [co-culture positive]). Data (n = 3 independent experiments) are shown as the mean raw Ct value ± SD, ∗∗p < 0.01 (left); and as mean ± SD, p < 0.05, ∗∗p < 0.01 (right). (E) EV-miR-31 targets subclass GSC-specific genes. Nodular GSCs (n = 3 independent GSCs) were transfected with control (NC), microRNA mimic (miR-31), and microRNA inhibitor (amiR-31) (top three rows), and invasive GSC were treated with EVs derived from such nodular GSCs or their own EVs (n = 3 independent GSCs). qPCR analysis of selected targets and miR-31 is shown as hierarchical clustering and log10 assessed based on the value of expression, respectively. See also Figure S4.

Similar articles

Cited by

References

    1. Brennan C.W., Verhaak R.G., McKenna A., Campos B., Noushmehr H., Salama S.R., Zheng S., Chakravarty D., Sanborn J.Z., Berman S.H. The somatic genomic landscape of glioblastoma. Cell. 2013;155:462–477. - PMC - PubMed
    1. Bronisz A., Wang Y., Nowicki M.O., Peruzzi P., Ansari K.I., Ogawa D., Balaj L., De Rienzo G., Mineo M., Nakano I. Extracellular vesicles modulate the glioblastoma microenvironment via a tumor suppression signaling network directed by miR-1. Cancer Res. 2014;74:738–750. - PMC - PubMed
    1. Brunet J.P., Tamayo P., Golub T.R., Mesirov J.P. Metagenes and molecular pattern discovery using matrix factorization. Proc. Natl. Acad. Sci. USA. 2004;101:4164–4169. - PMC - PubMed
    1. Celiku O., Johnson S., Zhao S., Camphausen K., Shankavaram U. Visualizing molecular profiles of glioblastoma with GBM-BioDP. PLoS One. 2014;9:e101239. - PMC - PubMed
    1. Du Z., Fei T., Verhaak R.G., Su Z., Zhang Y., Brown M., Chen Y., Liu X.S. Integrative genomic analyses reveal clinically relevant long noncoding RNAs in human cancer. Nat. Struct. Mol. Biol. 2013;20:908–913. - PMC - PubMed

Publication types

MeSH terms