. 2017 Jul 11;9(1):12-22.
doi: 10.1016/j.stemcr.2017.04.022. Epub 2017 May 18.

Expansion and Purification Are Critical for the Therapeutic Application of Pluripotent Stem Cell-Derived Myogenic Progenitors

Affiliations

Expansion and Purification Are Critical for the Therapeutic Application of Pluripotent Stem Cell-Derived Myogenic Progenitors

Jaemin Kim et al. Stem Cell Reports. .

Abstract

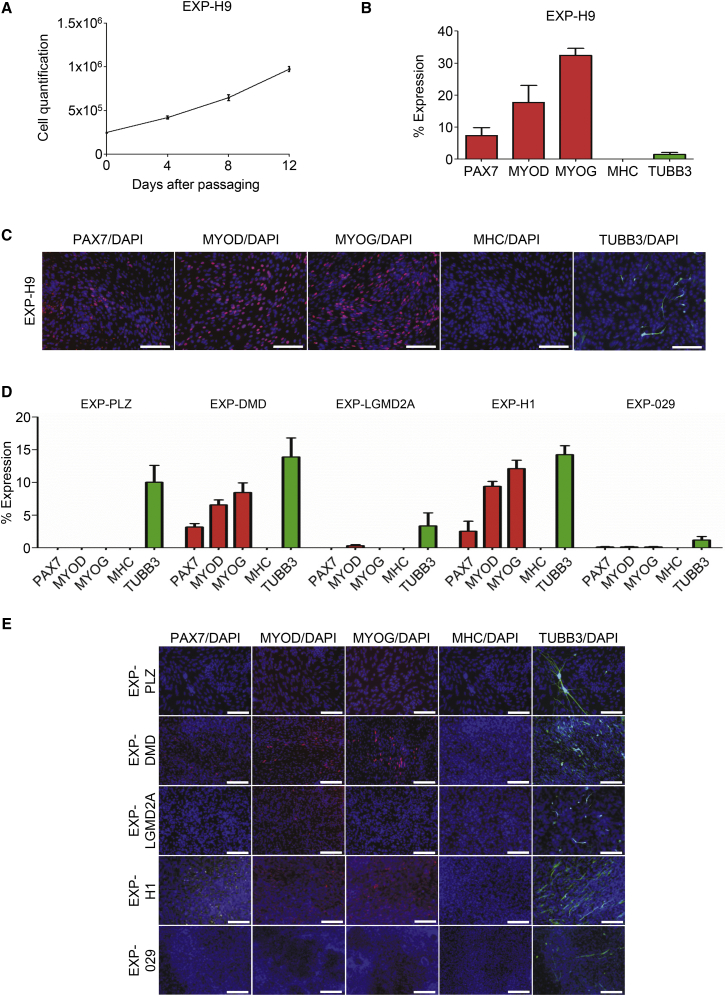
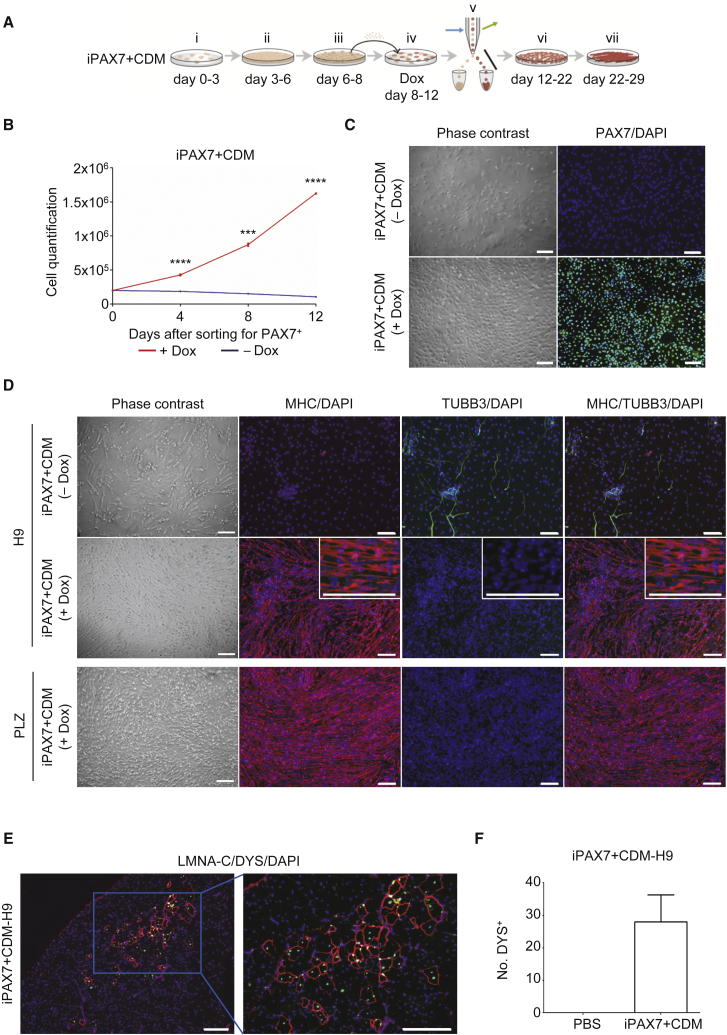
Recent reports have documented the differentiation of human pluripotent stem cells toward the skeletal myogenic lineage using transgene- and cell purification-free approaches. Although these protocols generate myocytes, they have not demonstrated scalability, safety, and in vivo engraftment, which are key aspects for their future clinical application. Here we recapitulate one prominent protocol, and show that it gives rise to a heterogeneous cell population containing myocytes and other cell types. Upon transplantation, the majority of human donor cells could not contribute to myofiber formation. As a proof-of-principle, we incorporated the inducible PAX7 lentiviral system into this protocol, which then enabled scalable expansion of a homogeneous population of skeletal myogenic progenitors capable of forming myofibers in vivo. Our findings demonstrate the methods for scalable expansion of PAX7+ myogenic progenitors and their purification are critical for practical application to cell replacement treatment of muscle degenerative diseases.

Keywords: MHC(+) myocytes; PAX7(+) myogenic progenitors; engraftment; morphogens; pluripotent stem cells; purification; skeletal muscle; stem cell therapy; transgene.


Figures

Figure 1
Figure 1
In Vitro and In Vivo Skeletal Myogenic Differentiation Potential of Transgene-free hPS Cell-Derived Myogenic Cells Generated Using the Monolayer Method (A) Schematic diagram of differentiating hPS cells in monolayer using only small molecules without passaging (i = CHIR99021 and LDN; ii = CHIR99021, LDN, and FGF2; iii = LDN, FGF2, HGF, and IGF1; iv = IGF1; v = HGF and IGF1). (B) Representative bright field image and immunofluorescence analysis for MHC and TUBB3 of CDM-H9 cells (after 50 days) and other CDM-hPS cells (after 30 days). MHC in red; TUBB3 in green; DAPI (nuclei) in blue. Scale bars, 200 μm (n = 4 biological replicates). (C) Representative immunofluorescence analysis for PAX7 and MHC of CDM-H9 cells after 30 days (top panel: 20 neighbor images under 10× magnification were joined together using “tiles imaging” mode). PAX7 in yellow; MHC in red; DAPI (nuclei) in blue. Scale bars, 200 μm (n = 4 biological replicates). (D) Western blot analysis of CDM-H9 cells at different time points. Mouse satellite (mSat) cells and iPAX7+CDM-H9 myogenic progenitors (sorted for PAX7+ and expanded for 4 days in the presence of Dox) were used as positive controls for PAX7 expression. Non-induced iPAX7+CDM-H9 cells (−Dox) served as negative control. Actin (ACT) was used as a housekeeping protein. Approximately 100,000 cells were used for each protein sample. Lane 1, day 20 of CDM-H9; lane 2, day 30 of CDM-H9; lane 3, day 40 of CDM-H9; lane 4, iPAX7+CDM-H9 without Dox; lane 5, mSat; lane 6, iPAX7+CDM-H9 with Dox (n = 2 biological replicates). (E) Representative immunohistochemistry analysis for LMNA-C and DYS of transplanted CDM-H9 cells at day 30 which showed PAX7+ sub-population within the culture (left panel). Number of cells positive for LMNA-C and DYS was quantified for each biological replicate of each muscle section (right panel). LMNA-C in green; DYS in red; DAPI (nuclei) in blue. Scale bars, 200 μm (n = 4 biological replicates).
Figure 2
Figure 2
Characterization of Transgene-free hPS Cell-Derived Myogenic Cells in Expansion Stage (A) Growth curve analysis of EXP-H9 cells that were CDM-derived for 30 days, followed by expansion in serum-containing conditions for 12 days (values represent mean ± SEMs; n = 3 biological replicates). (B and C) Quantification (B) and representative immunofluorescence analyses for PAX7, MYOD, MYOG, MHC, and TUBB3 of EXP-H9 cells (C). PAX7, MYOD, MYOG, and MHC in red; TUBB3 in green; DAPI (nuclei) in blue. Scale bars, 200 μm (values represent mean ± SEMs; n = 4 biological replicates). (D and E) Quantification (D) and representative immunofluorescence analyses for PAX7, MYOD, MYOG, MHC, and TUBB3 expression of EXP-PLZ, -DMD, -LGMD2A, -H1, and -029 cells that were CDM-derived for 30 days, followed by expansion in serum-containing medium for 12 days (E). Cells were stained as described above in (C). Experiments involving EXP-H1 and -029 cells were performed by an independent laboratory. Scale bars, 200 μm (values represent mean ± SEMs; n = 3 biological replicates).
Figure 3
Figure 3
Characterization of Transgene-free hPS Cell-Derived Myogenic Cells in Terminal Differentiation Stage (A and B) Quantification (A) and representative immunofluorescence analyses for MHC and TUBB3 of DIFF-H9 cells that were CDM-derived for 30 days, expanded in serum-containing medium for 12 days, and terminally differentiated for one week in HS-containing culture medium (B). MHC in red; TUBB3 in green; DAPI in blue. Scale bars, 200 μm (values represent mean ± SEM; n = 4 biological replicates). (C and D) Quantification (C) and representative immunofluorescence analyses for MHC and TUBB3 of DIFF-PLZ, -DMD, -LGMD2A, -H1, and -029 cells (DIFF-H1 and -029 cells by an independent lab group) that were cultured (D). The cells were stained as described in (B). Scale bars, 200 μm (values represent mean ± SEM; n = 3 biological replicates). (E and F) Immunohistochemistry analysis for LMNA-C and DYS in mice that had been transplanted with EXP-H9 cells that were CDM differentiated for 30 days and then expanded in serum-containing medium for 12 days (E). LMNA-C in green; DYS in red; DAPI (nuclei) in blue. Scale bars, 200 μm. The respective quantifications were recorded from muscle sections (F) (values represent mean ± SEM; n = 4 biological replicates).
Figure 4
Figure 4
Skeletal Myogenic Differentiation and Engraftment Ability of Myogenic Progenitors Derived from hPS Cells Using the iPAX7 System under Serum-free Conditions (A) Schematic diagram of differentiating iPAX7-hPS cells using the PAX7 conditional expression system in CDM protocol (i–iii = same culture conditions as shown in Figure 1A; iv = passaging with Dox and FGF2; v = sorting for PAX7+ cells; vi = propagation of PAX7+ cells with Dox and FGF2; vii = HGF and IGF1). (B) Growth curve analysis of iPAX7+CDM-H9 cells that had been cultured with or without Dox. Cells were counted after day 12 of differentiation. Number of cells was recorded every 4 days. (values represent mean ± SEM; n = 3 biological replicates; ∗∗∗p ≤ 0.001, ∗∗∗∗p ≤ 0.0001). (C) Representative bright field image and immunofluorescence staining for PAX7 in iPAX7+CDM-H9 cells that had been cultured with or without Dox. iPAX7+CDM-H9 cells cultured with Dox were sorted for PAX7+ after 4 days of Dox induction (A), and expanded for 4 days, whereas non-induced cells (−Dox) were maintained in the same culture dish. PAX7 in green; DAPI (nuclei) in blue. Scale bars, 200 μm (n = 3 biological replicates). (D) Representative bright field image and immunofluorescence analysis for MHC and TUBB3 of iPAX7+CDM-hPS cells differentiated until day 29 with or without Dox induction, and then subjected to terminal differentiation. MHC in red; TUBB3 in green; DAPI (nuclei) in blue. Scale bars, 200 μm (n = 3 biological replicates). (E and F) Immunofluorescence analysis for LMNA-C and DYS in mice that had been transplanted with day 22 PAX7-induced H9 myogenic progenitors (E). LMNA-C in green; DYS in red; DAPI (nuclei) in blue. Scale bars, 200 μm. The respective quantifications were recorded from muscle sections (F) (values represent mean ± SEM; n = 4 biological replicates).

References

    1. Abujarour R., Bennett M., Valamehr B., Lee T.T., Robinson M., Robbins D., Le T., Lai K., Flynn P. Myogenic differentiation of muscular dystrophy-specific induced pluripotent stem cells for use in drug discovery. Stem Cells Transl. Med. 2014;3:149–160. - PMC - PubMed
    1. Albini S., Coutinho P., Malecova B., Giordani L., Savchenko A., Forcales S., Puri P.L. Epigenetic reprogramming of human ES cells into skeletal muscle cells and generation of contractile myospheres. Cell Rep. 2013;3:661–670. - PMC - PubMed
    1. Barberi T., Bradbury M., Dincer Z., Panagiotakos G., Socci N.D., Studer L. Derivation of engraftable skeletal myoblasts from human embryonic stem cells. Nat. Med. 2007;13:642–648. - PubMed
    1. Borchin B., Chen J., Barberi T. Derivation and FACS-mediated purification of PAX3+/PAX7+ skeletal muscle precursors from human pluripotent stem cells. Stem Cell Reports. 2013;1:620–631. - PMC - PubMed
    1. Chal J., Oginuma M., Al Tanoury Z., Gobert B., Sumara O., Hick A., Bousson F., Zidouni Y., Mursch C., Moncuquet P. Differentiation of pluripotent stem cells to muscle fiber to model Duchenne muscular dystrophy. Nat. Biotech. 2015;33:962–969. - PubMed

Publication types

MeSH terms

Substances