. 2017 Aug:58:278-290.
doi: 10.1016/j.actbio.2017.05.042. Epub 2017 May 18.

Effects of collagen microstructure and material properties on the deformation of the neural tissues of the lamina cribrosa

Affiliations

Effects of collagen microstructure and material properties on the deformation of the neural tissues of the lamina cribrosa

A P Voorhees et al. Acta Biomater. 2017 Aug.

Abstract

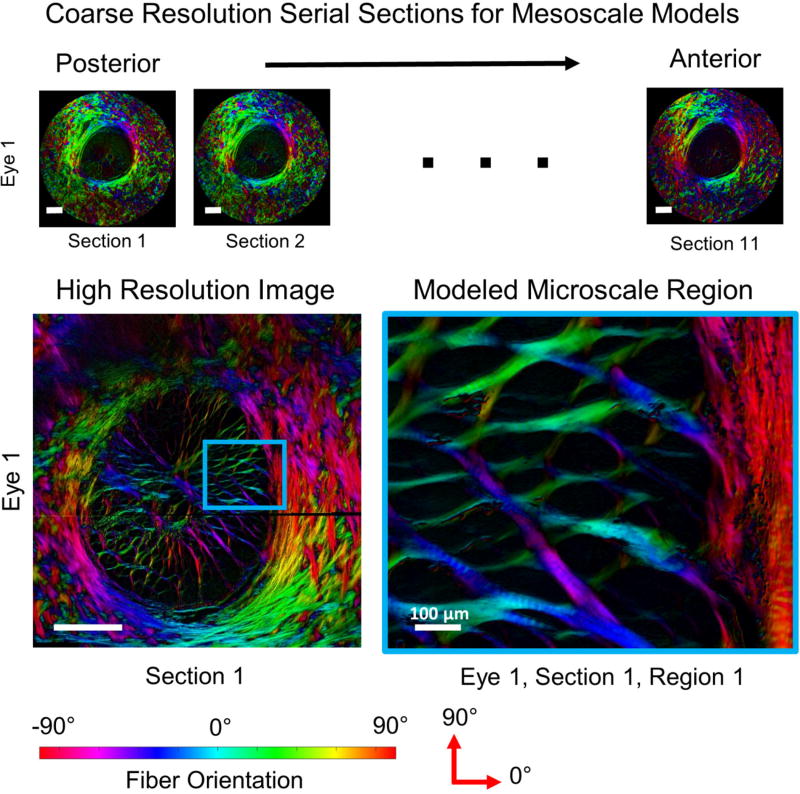
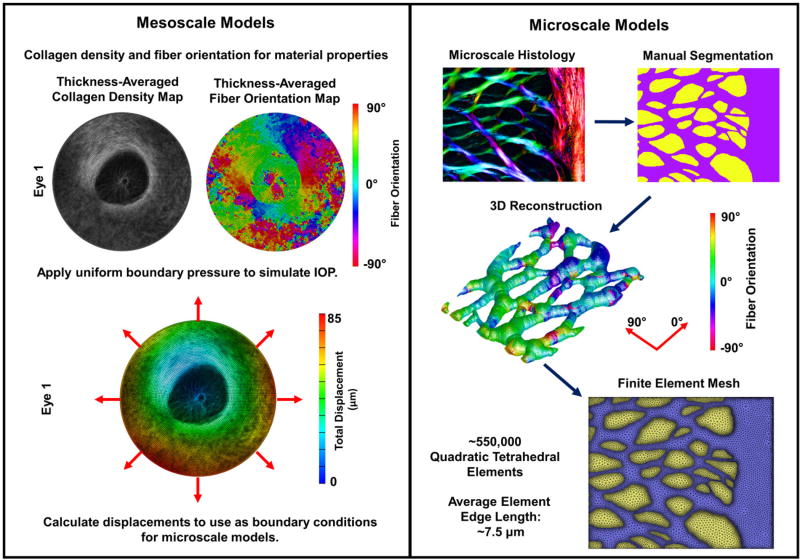
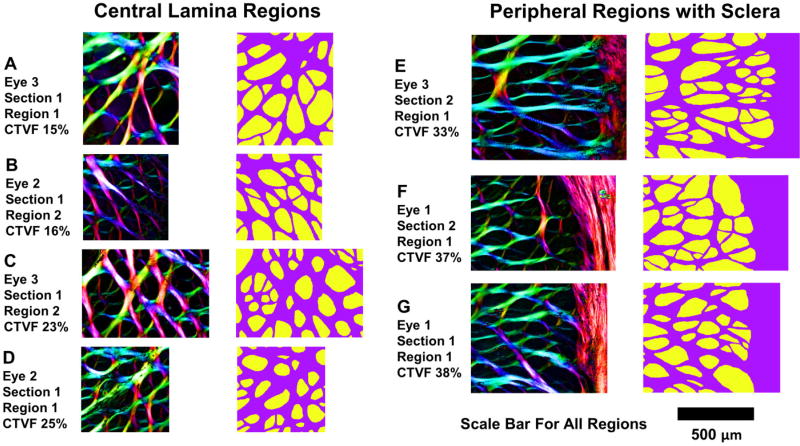
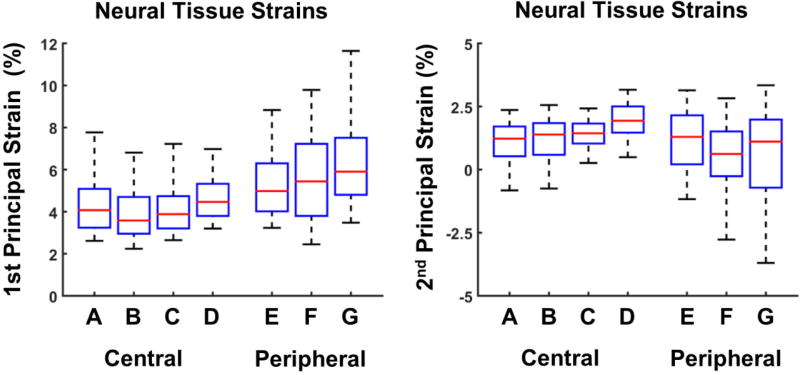
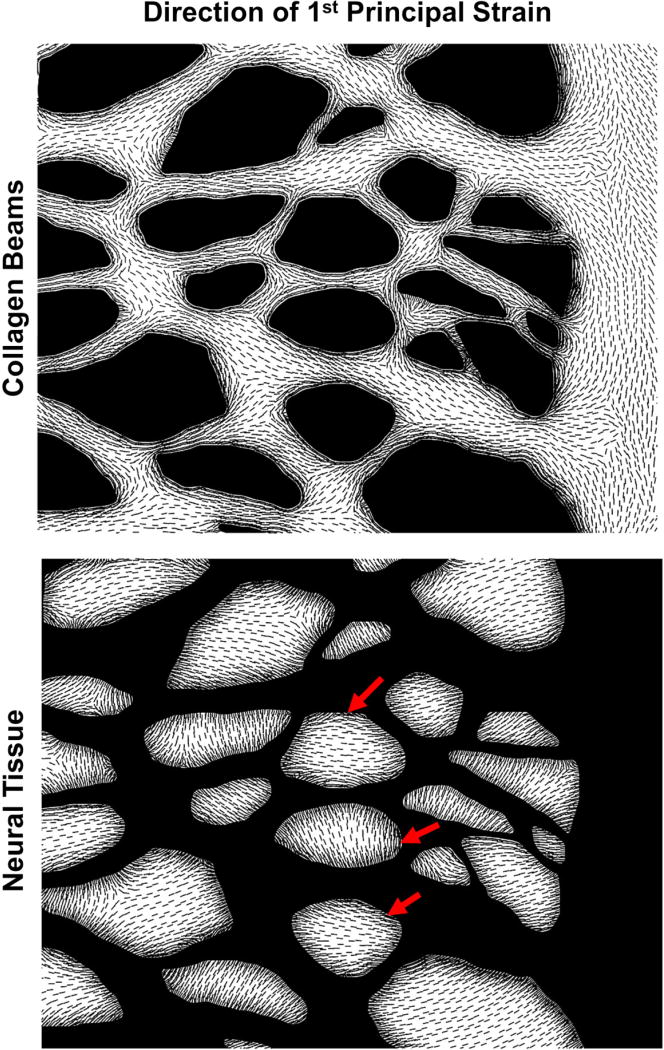
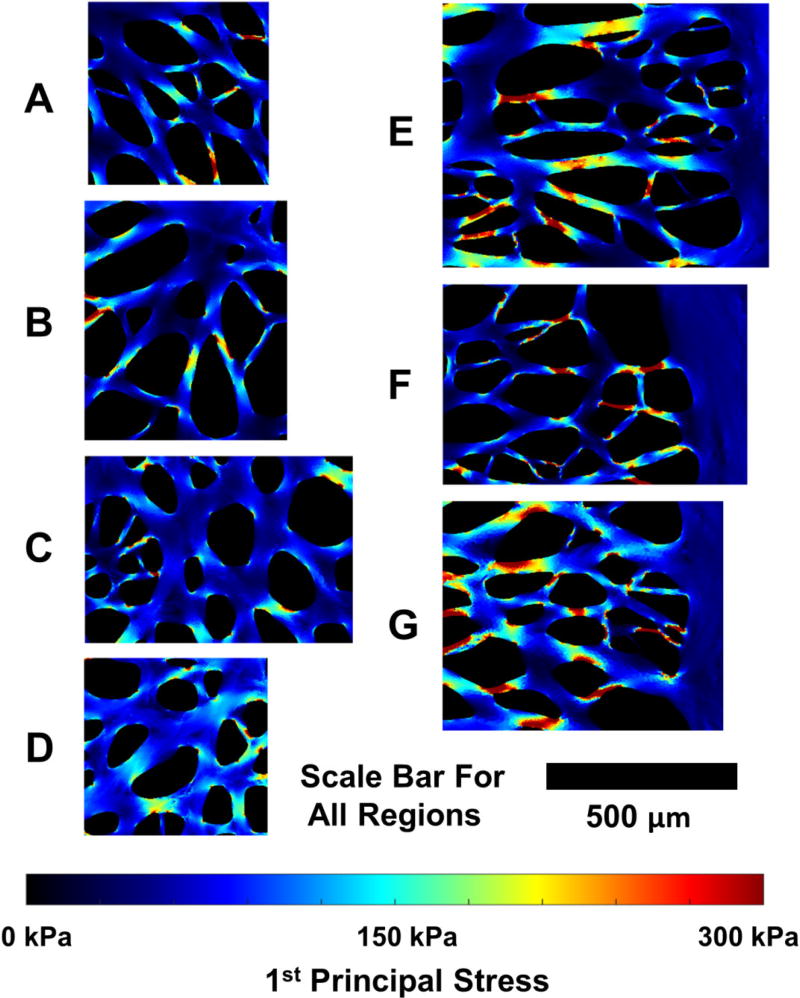
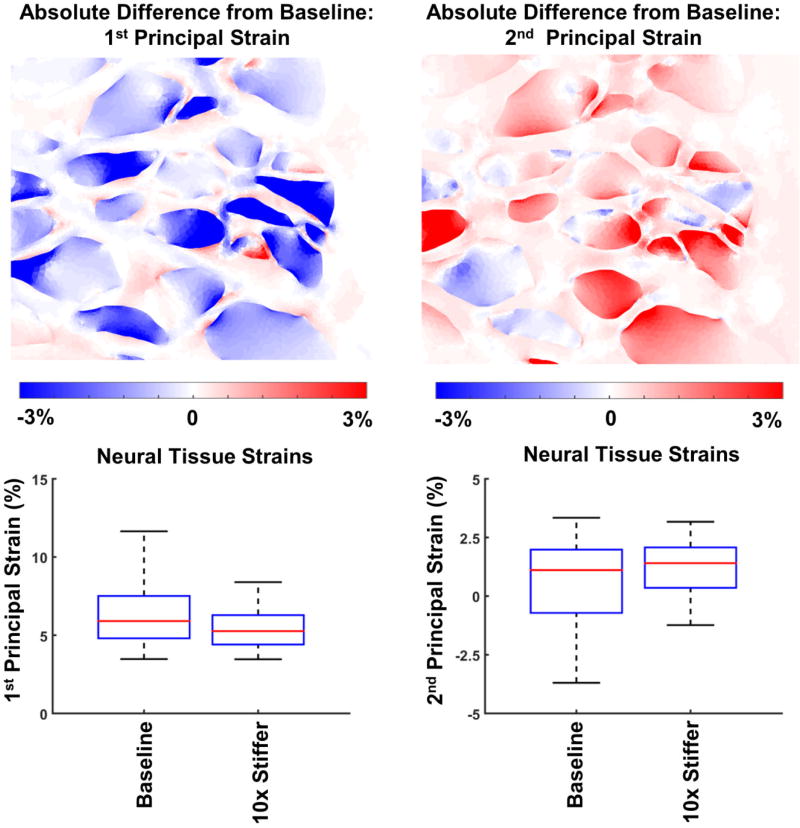
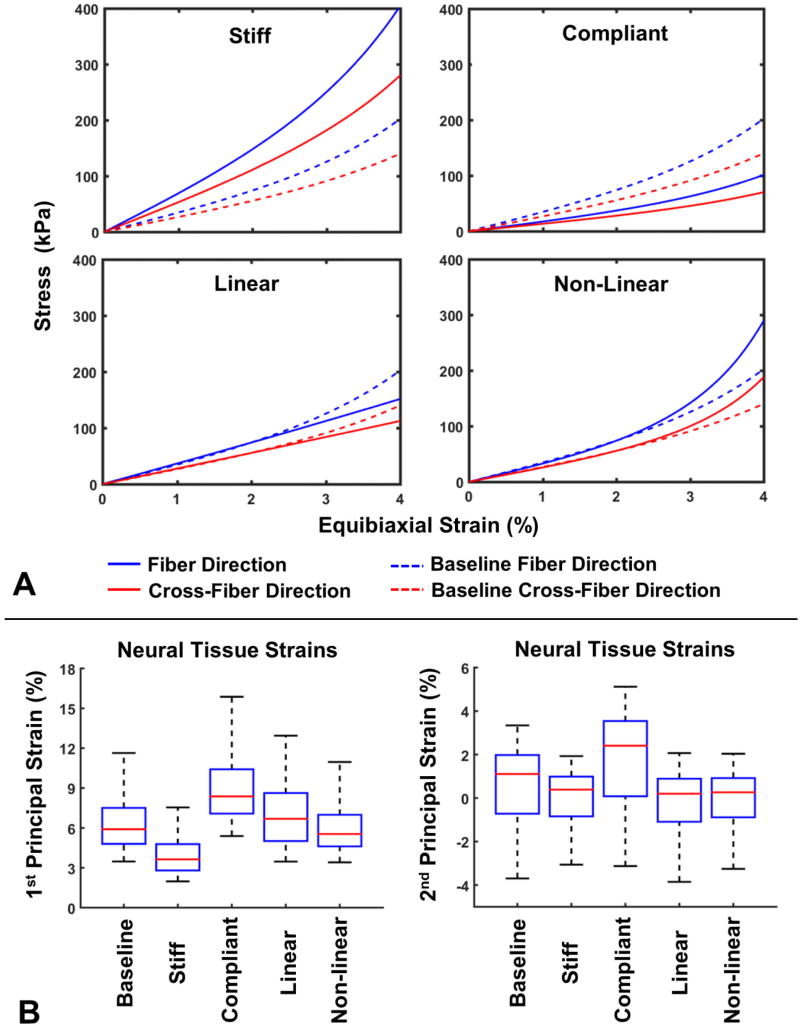
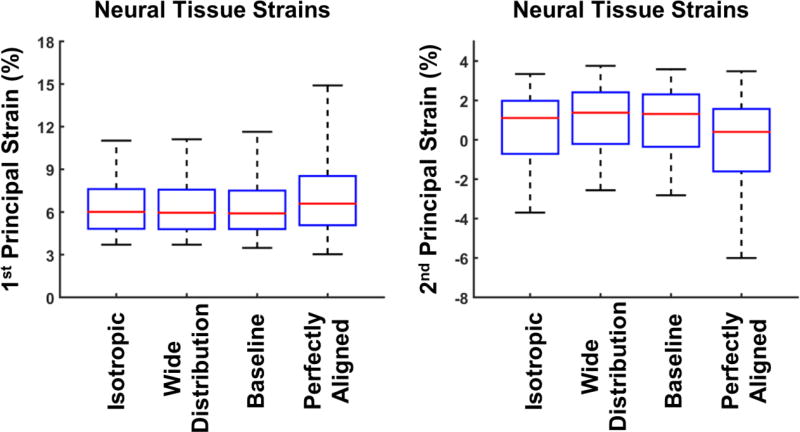
It is widely considered that intraocular pressure (IOP)-induced deformation within the neural tissue pores of the lamina cribrosa (LC) contributes to neurodegeneration and glaucoma. Our goal was to study how the LC microstructure and mechanical properties determine the mechanical insult to the neural tissues within the pores of the LC. Polarized light microscopy was used to measure the collagen density and orientation in histology sections of three sheep optic nerve heads (ONH) at both mesoscale (4.4μm) and microscale (0.73μm) resolutions. Mesoscale fiber-aware FE models were first used to calculate ONH deformations at an IOP of 30mmHg. The results were then used as boundary conditions for microscale models of LC regions. Models predicted large insult to the LC neural tissues, with 95th percentile 1st principal strains ranging from 7 to 12%. Pores near the scleral boundary suffered significantly higher stretch compared to pores in more central regions (10.0±1.4% vs. 7.2±0.4%; p=0.014; mean±SD). Variations in material properties altered the minimum, median, and maximum levels of neural tissue insult but largely did not alter the patterns of pore-to-pore variation, suggesting these patterns are determined by the underlying structure and geometry of the LC beams and pores. To the best of our knowledge, this is the first computational model that reproduces the highly heterogeneous neural tissue strain fields observed experimentally.

Statement of significance: The loss of visual function associated with glaucoma has been attributed to sustained mechanical insult to the neural tissues of the lamina cribrosa due to elevated intraocular pressure. Our study is the first computational model built from specimen-specific tissue microstructure to consider the mechanics of the neural tissues of the lamina separately from the connective tissue. We found that the deformation of the neural tissue was much larger than that predicted by any recent microstructure-aware models of the lamina. These results are consistent with recent experimental data and the highest deformations were found in the region of the lamina where glaucomatous damage first occurs. This study provides new insight into the complex biomechanical environment within the lamina.

Keywords: Biomechanics; Finite element modeling; Glaucoma; Intraocular pressure; Lamina cribrosa; Microstructure; Optic nerve head.


Figures

Figure 1
Figure 1. The anatomy of the eye and optic nerve head
(Top) A longitudinal section of the eye is shown. Retinal ganglion cell axons (shown in red) exit the eye through a collagenous structure called the lamina cribrosa (highlighted in green) as they form the optic nerve. (Bottom) A coronal section of the optic nerve head showing the collagenous microstructure.
Figure 2
Figure 2. Multiscale polarized light histology
Sheep optic nerve heads (ONH) were serially sectioned and imaged at low magnification. Polarized light microscopy was used to determine the collagen fiber energy, a measure of collagen density, and fiber orientation [21]. Colors in the images represent the fiber orientation. Sections were registered to one another to form a stack. These stacked images were used as the basis for the mesoscale models used for boundary conditions. Individual sections were then reimaged at higher magnification, and registered to the low magnification stacks. Regions from the individual sections were then used to create the microscale models. Scale bars are 1 mm unless otherwise indicated.
Figure 3
Figure 3. Multiscale modeling approach
For mesoscale models (Left), material properties were based on fiber orientation and fiber density information from serial histology. Uniform boundary pressure was applied to simulate the hoop stress caused by IOP. Displacement predictions were obtained to use as boundary conditions for the microscale models. For microscale models (Right), regions of from histology sections were imaged at high resolution and segmented into LC beams and neural tissue. A 3D reconstruction of the beams was used as the basis for the finite element mesh. Fiber orientation was taken directly from polarized light microscopy images.
Figure 4
Figure 4. Microscale regions of interest
Four regions of central lamina and three regions of peripheral lamina with sclera were modeled. The multicolored images in the left columns, are the energy data from polarized light microscopy colored by the mean fiber angle. The right hand columns show the segmented masks used to create the models. Regions are sorted by increasing connective tissue volume fraction (CTVF) in the modeled region. Eyes are lettered A–G and will be referred to by these letters throughout this report.
Figure 5
Figure 5. 1st and 2nd principal strains for all models
1st principal strains were generally smaller in the central lamina models (A–D) as compared to the peripheral models (E–G). The magnitude of both strains varied from one pore to another. Strains peak in regions of the pores near branch points in the collagen beams. 2nd principal strains were positive and fairly uniform in the central region models, however, the 2nd principal strain was more varied and sometimes negative near the sclera indicating high shear strains at these locations. Elements located within 10% of the total region length or width from an edge are not shown so as to prevent the interpretation of edge effects.
Figure 6
Figure 6. The distribution of strains in the neural tissues
(Left) Distribution of 1st principal strains. (Right) Distribution of 2nd Principal strains. Whiskers show the 5th and 95th percentile stretches. Boxes span the 25th–75th percentiles. Red lines represent the median. Peak and median 1st principal strains were highest in the peripheral regions. In the peripheral models, the median 2nd principal strain was lower than that in the central regions and the 5th percentile smallest stretch was negative.
Figure 7
Figure 7. The direction of 1st principal strain for region G
(Top) The collagen beams stretched primarily along the length of the beam, in the direction of fiber orientation. Since the 2nd principal strain in the beams was negative, this indicates that the beams thinned as the LC is stretched by IOP. (Bottom) The neural tissues stretched in various directions. An alternating pattern of 1st principal strain direction was seen in the three pores marked by red arrows. There was a tendency for the neural tissues to stretch perpendicular to the beam-pore interface, especially in narrow pores.
Figure 8
Figure 8. 1st Principal stress in the LC beams
Stress was highly concentrated in some areas of the beams. Stresses were largest near the midpoints of the beams and away from beam intersections. Stresses were higher in the peripheral regions near the sclera.
Figure 9
Figure 9. Effect of neural tissue stiffness on neural tissue strain
Increasing neural tissue stiffness 10-fold, generally reduced the 1st principal strain, however some pores had regions with increased neural tissue strains. The 2nd principal strain was primarily increased when the stiffness of the neural tissue was increased. The main effect of increasing neural tissue stiffness appeared to be a narrowing of the distribution of 1st and 2nd principal strains.
Figure 10
Figure 10. The effects of connective tissue material properties on neural tissue strain
(A) Material properties used in parametric variation study. Stiff and compliant cases represent a doubling or halving of the stiffness. In the linear case, the stiffness does not increase with increasing strain, and the stress at 2% equibiaxial strain is the same as with baseline material properties. In the non-linear case, the stiffness increases with strain at twice the rate as the baseline case, but again has the same stress as baseline at 2% equibiaxial strain. (B) Distribution of 1st principal (left) and 2nd principal strain (right) for region G. Whiskers show the 5th and 95th percentile strains. Boxes span the 25th–75th percentiles. Red lines represent the median. Increased stiffness reduced the 1st principal strain and narrowed the distribution of both 1st and 2nd principal strains, indicating less deformation. Compliant collagen material properties had the opposite effect. Linear material properties resulted in a slightly wider distribution of 1st and 2nd principal strains, however the median strain was similar to baseline. Increased non-linearity did not result in major differences as compared to baseline.
Figure 11
Figure 11. The effect of collagen fiber dispersion on neural tissue strain
Distribution of 1st principal (Left) and 2nd principal strains (Right) for region G. Whiskers show the 5th and 95th percentile strains. Boxes span the 25th–75th percentiles. Red lines represent the median. An isotropic alignment of fibers and a wide distribution of fibers did not result in major changes in the distribution of neural tissue strains. A perfectly aligned distribution of fibers resulted in increased 1st principal strains and more negative 2nd principal strains indicating increased shear strains in the neural tissues.

References

    1. Burgoyne CF. A biomechanical paradigm for axonal insult within the optic nerve head in aging and glaucoma. Experimental eye research. 2011;93:120–32. - PMC - PubMed
    1. Hernandez MR. The optic nerve head in glaucoma: Role of astrocytes in tissue remodeling. Progress in Retinal and Eye Research. 2000;19:297–321. - PubMed
    1. Sigal IA, Ethier CR. Biomechanics of the optic nerve head. Experimental eye research. 2009:799–807. - PubMed
    1. Quigley HA. Reappraisal of the mechanisms of glaucomatous optic nerve damage. Eye (London, England) 1987;1(Pt 2):318–22. - PubMed
    1. Bengtsson B, Heijl A. A long-term prospective study of risk factors for glaucomatous visual field loss in patients with ocular hypertension. J Glaucoma. 2005;14:135–8. - PubMed

Publication types

LinkOut - more resources