. 2017 Jun 12;31(6):820-832.e3.
doi: 10.1016/j.ccell.2017.04.013. Epub 2017 May 18.

A Pan-Cancer Proteogenomic Atlas of PI3K/AKT/mTOR Pathway Alterations

Affiliations

A Pan-Cancer Proteogenomic Atlas of PI3K/AKT/mTOR Pathway Alterations

Yiqun Zhang et al. Cancer Cell. .

Abstract

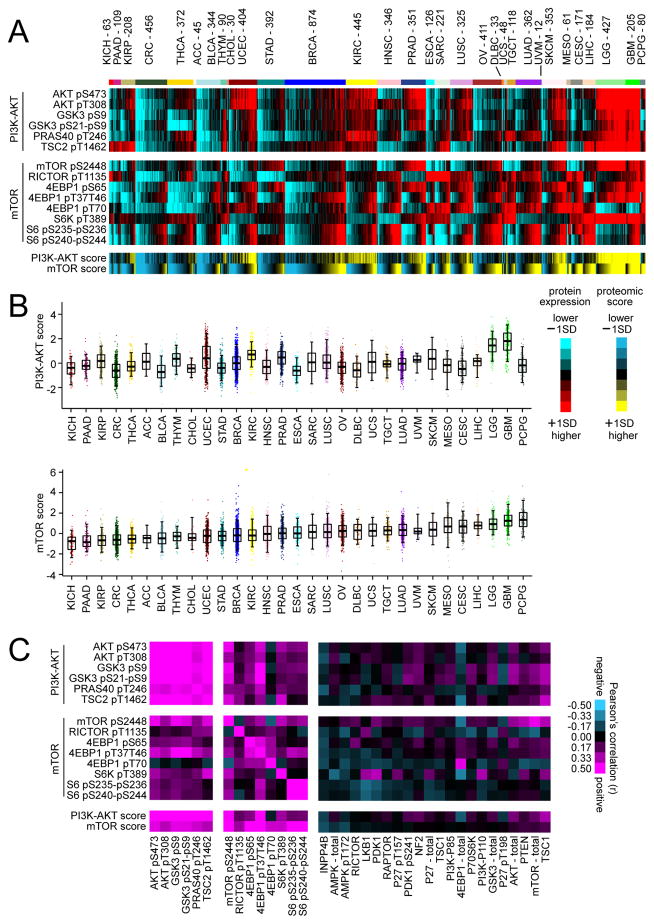
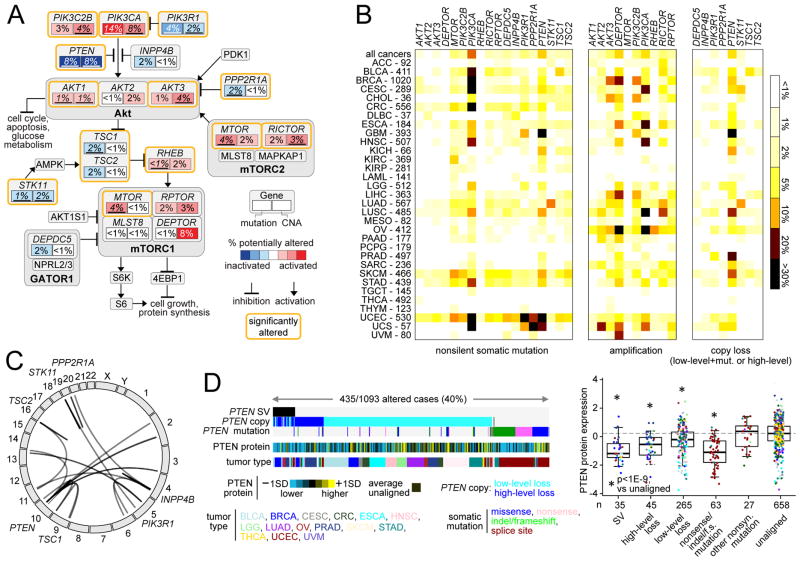
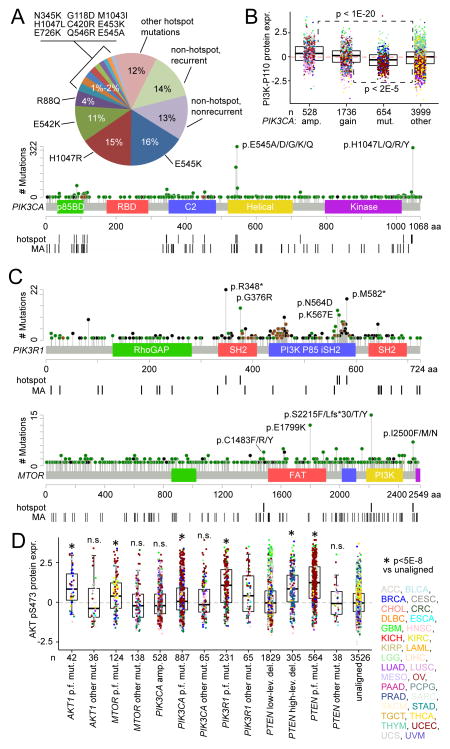
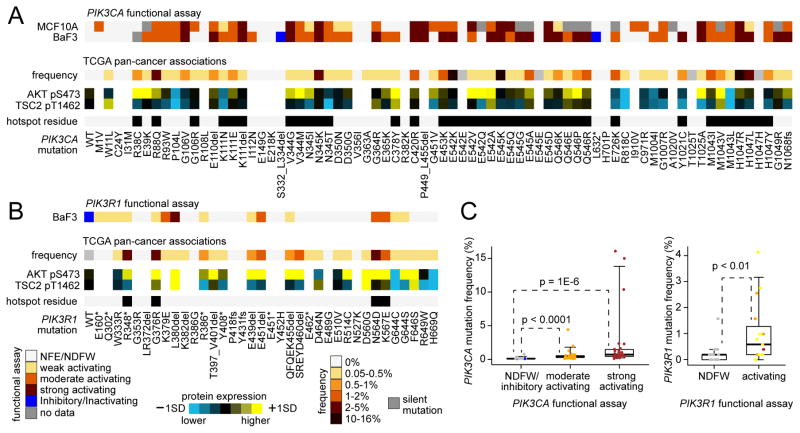
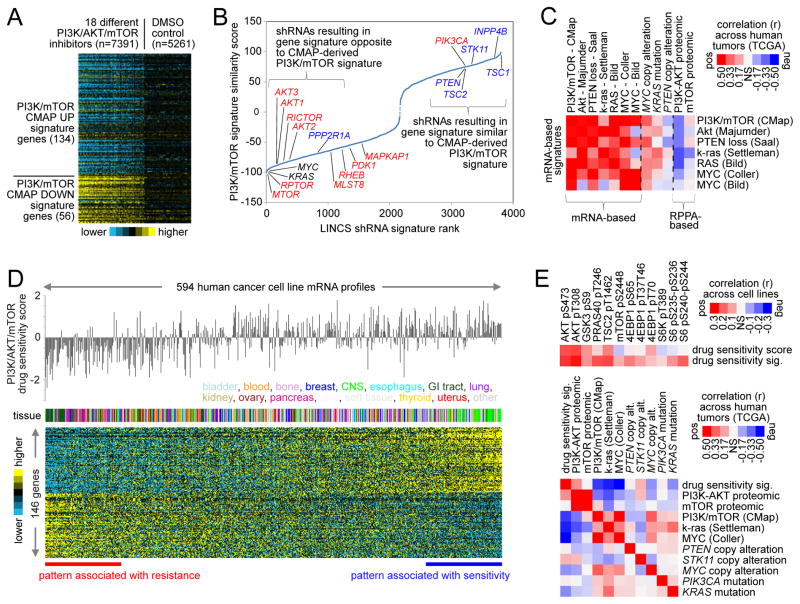
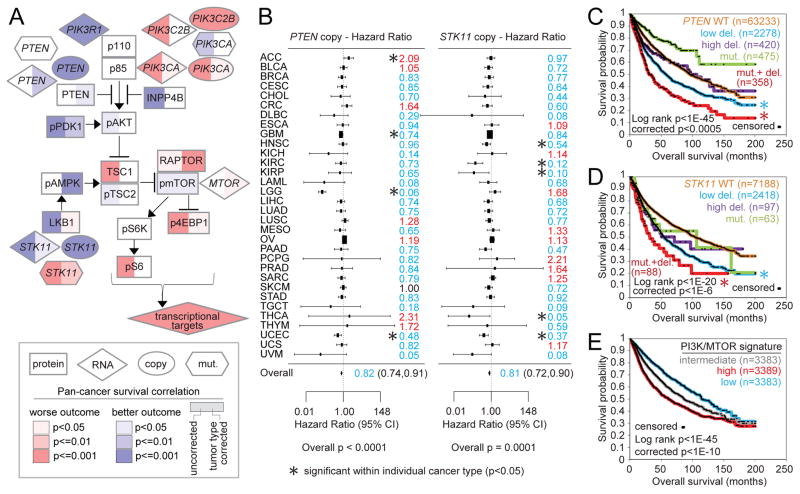
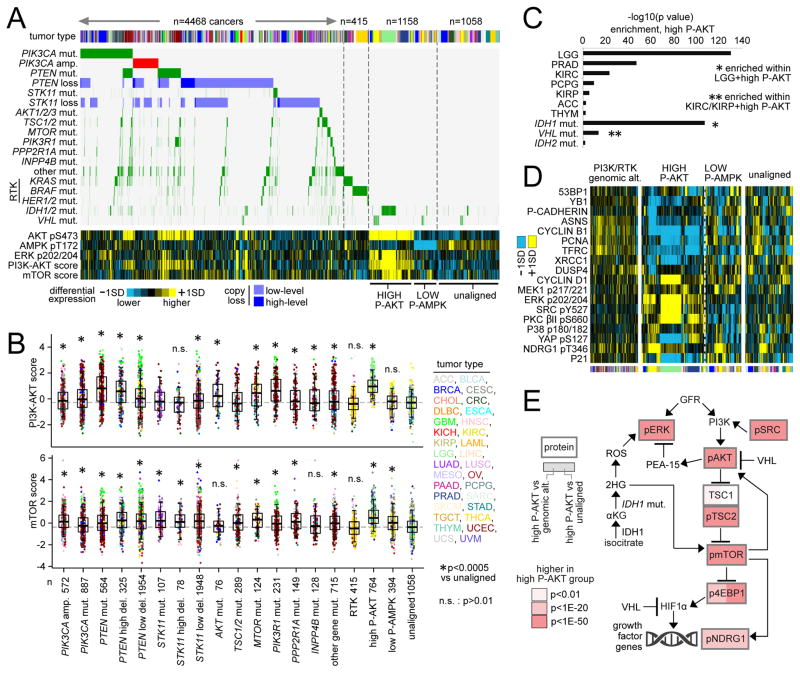
Molecular alterations involving the PI3K/AKT/mTOR pathway (including mutation, copy number, protein, or RNA) were examined across 11,219 human cancers representing 32 major types. Within specific mutated genes, frequency, mutation hotspot residues, in silico predictions, and functional assays were all informative in distinguishing the subset of genetic variants more likely to have functional relevance. Multiple oncogenic pathways including PI3K/AKT/mTOR converged on similar sets of downstream transcriptional targets. In addition to mutation, structural variations and partial copy losses involving PTEN and STK11 showed evidence for having functional relevance. A substantial fraction of cancers showed high mTOR pathway activity without an associated canonical genetic or genomic alteration, including cancers harboring IDH1 or VHL mutations, suggesting multiple mechanisms for pathway activation.

Keywords: PI3K/AKT/mTOR pathway; The Cancer Genome Atlas; integrative genomics analysis; pan-cancer analysis; proteomics; reverse-phase protein arrays.


Figures

Figure 1
Figure 1. Proteomic signatures of PI3K/AKT and mTOR across human cancers
(A) Heat map of RPPA features considered core to either PI3K/AKT or mTOR pathways across 7663 cancers. Red, higher expression (values normalized to standard deviations from the median across all cancers); blue, lower expression. PI3K/AKT and mTOR features were each summarized into pathway activity scores for each tumor profile (yellow, higher inferred activity; blue, lower activity; bright yellow/blue denotes change of 1 standard deviation, or SD, from the median). Cancer types (denoted by TCGA project name) are ordered by low to high average mTOR pathway score. (B) Box plots of PI3K/AKT (top) and mTOR (bottom) pathway activities scores, as inferred using RPPA data. Box plots represent 5%, 25%, 50%, 75%, and 95%. (C) Pearson’s correlations between RPPA features across all cancers, involving features core to PI3K/AKT or mTOR pathways, as well as involving features representing proteins that may act peripherally upon either pathway. See also Figure S1 and Tables S1 and S2.
Figure 2
Figure 2. Somatic mutations and DNA copy and structural alterations involving components of the PI3K/AKT/mTOR pathway across human cancers
(A) Diagram of somatic mutation and copy number alteration (CNAs) frequencies involving components of the PI3K/AKT/mTOR pathway. Key genes (with significant or sizable frequencies of alteration) are indicated by rectangles, with the percentages of somatic mutations and CNAs shown in the left and right portions of each rectangle, respectively. Significantly altered genes (from (Chang et al., 2016; Kandoth et al., 2013; Lawrence et al., 2014; Zack et al., 2013); percentages representing significant alterations are underlined) are bounded by orange lines. Red, potentially activating genetic alterations; blue, potentially inactivating genetic alterations. Copy loss represents either “high-level” deletion (approximating homozygous deletion) or mutation in combination with “low-level” deletion (partial loss). (B) By cancer type, percentages of somatic mutation or copy alteration for each indicated gene. Amplification denotes “high-level” copy gain. Numbers of cases denote representation on WES data platform. (C) Genomic rearrangements (represented in circos plot) involving PTEN, INPP4B, STK11, TSC1, TSC2, PIK3R1, or PPP2R1A, based on analysis of 1363 cases with WGS data. (D) Left: Alterations involving PTEN (somatic mutation, copy alteration, structural variation or SV) found in the set of 1093 cancers cases having both WGS and RPPA data available (protein values normalized to standard deviations, or SDs, from the median). Right: Box plot of PTEN protein expression by alteration class. Box plots represent 5%, 25%, 50%, 75%, and 95%. P values by t-test on log-transformed values. See also Figure S2 and Tables S3 and S4.
Figure 3
Figure 3. Distributions of mutations in key PI3K/AKT/mTOR pathway genes and association with protein activation
(A) PIK3CA nonsilent, somatic variant frequencies and distribution across domain-annotated p110α protein structure. “Recurrent” denotes mutation event observed in 2 or more tumor cases. “Hotspot” denotes recurrently mutated residues as identified by pan-cancer sequence analyses (Chang et al., 2016). “MA” denotes “medium” or “strong” functional prediction by Mutation Assessor algorithm (Reva et al., 2011). (B) Box plot of p110α expression by PIK3CA alteration class (gene amplification, gain of 1–2 copies, mutation, or none of the above, i.e. “unaligned”). P values by t-test on log-transformed values. (C) Distributions of nonsilent and somatic variants within PIK3R1 (top) and MTOR (bottom) across their respective domain-annotated protein structures. (D) Box plot of AKT pS473 phospho-protein expression by mutation (“mut.”) or copy alteration class, with the “unaligned” cases having none of the listed alteration types. “p.f.” denotes “predicted functional” mutations (by hotspot or by Mutation Assessor analysis or by literature review or by nonsense/frameshift/indel involving PTEN or PIK3R1); “amp.” denotes high-level gene amplification; “low-lev.” and “high-lev.”, low-level and high-level copy deletions, respectively. P values by t-test on log-transformed values. n.s., not significant (p>0.05). Box plots represent 5%, 25%, 50%, 75%, and 95%. Points in box plots are colored according to tumor type as defined by TCGA project as indicated in (D). See also Figure S3.
Figure 4
Figure 4. Functional assessment of specific PIK3CA and PIK3R1 variants by cell line viability assays
(A, B) Ba/F3 or MCF-10A cells were transfected with wild-type (WT) or indicated mutant cDNA of PIK3CA (A) or PIK3R1 (B) then cultured for 4 weeks and harvested for viability assay. The extent of functionality conferred by the variant is indicated by colorgram. NFE/NDFW, no functional effect/no difference from wild-type. For the mutant variants assessed, corresponding human cancer data from TCGA are shown, including frequency of the variant (relative to other variants found for the same gene) and average protein expression for AKT pS473 and TSC2 pT1462. Hotspot residue, from ref (Chang et al., 2016). (C) For PIK3CA (left) and PIK3R1 (right), box plots of variant frequency in TCGA human tumors (relative to other variants found for the same gene) by functional assays results. P values by Mann-Whitney U-test. Box plots represent 5%, 25%, 50%, 75%, and 95%. See also Figure S4 and Table S5.
Figure 5
Figure 5. Survey of two distinct PI3K/AKT/mTOR-associated gene transcription signatures across human cancers
(A) A previously defined gene transcription signature of PI3K/AKT/mTOR (Creighton et al., 2010)(originally derived using the Connectivity Map, or CMAP, dataset) was re-examined in the LINCS database of perturbational expression profiles, with PI3K/AKT/mTOR inhibitor treatment group compared with control group. (B) The PI3K/AKT/mTOR “CMAP” signature was evaluated against the LINCS expression profiles of cells treated with shRNAs for ~6K different genes. In the plot shown, shRNAs are ranked according to the overall similarities in their induced expression patterns with those of the PI3K/AKT/mTOR signature; for example, for shRNAs represented on the left of x-axis, knockdown of the gene results in a pattern inverse of that of the PI3K/AKT/mTOR signature. Red, canonical promoter of PI3K/AKT/mTOR pathway; blue, canonical suppressor. (C) TCGA pan-cancer mRNA profiles (n=10224 cases) were each scored for various transcriptional signatures associated with PI3K/AKT/mTOR, MYC, or k-ras pathways (defined previously using experimental models). Pearson’s correlations between indicated transcriptional and proteomic signature scores across the pan-cancer profiles are indicated, along with correlations of the signatures with specific genomic alterations. (D) A gene expression signature of sensitivity to PI3K/AKT/mTOR inhibition in cancer cell lines, consisting of 146 genes (p<0.01 by t-test and p<0.01 in regression model incorporating tumor type as a confounder), was derived using the Garnett et al. dataset (Garnett et al., 2012). (E) Top: For cell lines with both RPPA and mRNA data (n=231), Pearson’s correlations between key PI3K/AKT/mTOR proteins and PI3K/AKT/mTOR inhibition sensitivity (as defined by either drug treatment or gene signature from(D). Bottom: TCGA pan-cancer mRNA profiles were each scored for the drug sensitivity signature from (D); Pearson’s correlations across the pan-cancer profiles, involving transcriptional and proteomic signature scores and selected genomic features, are indicated. See also Figure S5 and Table S6.
Figure 6
Figure 6. Pan-cancer molecular correlates of patient survival involving PI3K/AKT/mTOR pathway components
(A) Pathway diagram representing molecular features at the levels of mRNA (using n=10152 cancer cases in total with both mRNA and survival data), protein (n=7532), copy number (n=10685), and somatic mutation (n=10054). Red, significant correlation with worse patient outcome; blue, significant correlation with better outcome. “Tumor type corrected” survival p values denote significant correlation in model incorporating both the molecular feature and cancer type. P values < 0.05 correspond to an estimated False Discovery Rate (Storey and Tibshirani, 2003) of < 10%. (B) Forest plots of hazard ratios by tumor type (with 95% confidence intervals) for patient death for PTEN copy alteration (left) and for STK11 copy alteration (right). Hazard ratios based on log (tumor/normal) copy values; hazard ratio less than 1 (blue) denotes trend of copy loss with worse outcome. P value for overall survival correlation by meta-analysis fixed effects model. Asterisks denote cancer types that were individually significant (p<0.05). (C, D) Kaplan-Meier plot of overall survival of patients stratified by PTEN (C) or STK11 (D) alteration. Low del., low-level deletion (partial loss, no detected mutation); high del., high-level deletion (approximating total loss); mut., somatic nonsilent mutation (no copy loss); mut.+ del., copy loss combined with mutation. “Corrected” p values by stratified log-rank test incorporate cancer type as a confounder. Asterisks denote groups significantly different from wild-type (WT) group by stratified log-rank test. (E) Kaplan-Meier plot of overall survival of patients stratified by PI3K/AKT/mTOR transcriptional signature (“CMAP” signature). “Corrected” p values by stratified log-rank test incorporate cancer type as a confounder.
Figure 7
Figure 7. Tumor classes as defined by PI3K/AKT/mTOR-related alterations
(A) Tumor cases were separated into distinct groups on the basis of genetic or genomic alteration and of protein expression: 1) cases with nonsilent somatic mutation or copy alteration involving selected PI3K/AKT/mTOR pathway members as shown (left side, n=4468 cases), 2) additional cases with nonsilent mutation involving selected Receptor Tyrosine Kinase (RTK)-associated genes (n=415 cases), 3) cases with high phospho-AKT (“HIGH P-AKT”) but with none of the above somatic alterations (n=764 cases), 4) cases with LOW phospho-AMPK (“LOW P-AMPK”) but with none of the above somatic alterations (n=394 cases), 5) cases not aligned with any of the above (“unaligned,” n=1058 cases). AKT/MTOR/PIK3CA/PIK3R1/PTEN mutations represent “predicted functional” mutations from Figure 3D. “Other mut.” track involves nonsilent mutations for other genes represented in Figure 2A (Methods and Figure S6). Protein values and proteomic scores normalized to standard deviations, or SDs, from the median. (B) Box plots of PI3K/AKT (top) and mTOR (bottom) pathway activity scores by alteration class. P values by t-test on log-transformed values. n.s., not significant (p>0.01). Box plots represent 5%, 25%, 50%, 75%, and 95%. (C) Enriched tumor types and mutations within the HIGH P-AKT group. P values by one-sided Fisher’s exact test. IDH1 and VHL mutation events were significant (p<1E-10 and p<0.01, respectively) when limiting the analysis to LGG and to KIRC/KIRP (renal) cases, respectively. (D) Top differentially expressed proteins in HIGH P-AKT group compared to unaligned and PI3K-altered groups (see Methods), not including core PI3K/AKT/mTOR members. (E) Diagram of interactions involving PI3K/AKT/MTOR pathway represented by selected features from (C) and (D) (Carbonneau et al., 2016; Dodd et al., 2015; Guo et al., 2016; Weiler et al., 2014), with differential protein expression patterns represented, comparing tumors in HIGH P-AKT group with tumors harboring PI3K/RTK genomic alteration or with unaligned tumors. P values by t-test on log-transformed data. See also Figure S6.

References

    1. Akbani R, Ng P, Werner H, Shahmoradgoli M, Zhang F, Ju Z, Liu W, Yang J, Yoshihara K, Li J, et al. A pan-cancer proteomic perspective on The Cancer Genome Atlas. Nat Commun. 2014 E-pub May 29. - PMC - PubMed
    1. Carbonneau M, Gagne L, Lalonde M, Germain M, Motorina A, Guiot M, Secco B, Vincent E, Tumber A, Hulea L, et al. The oncometabolite 2-hydroxyglutarate activates the mTOR signalling pathway. Nat Commun. 2016;7:12700. - PMC - PubMed
    1. Carpten JD, Faber AL, Horn C, Donoho GP, Briggs SL, Robbins CM, Hostetter G, Boguslawski S, Moses TY, Savage S, et al. A transforming mutation in the pleckstrin homology domain of AKT1 in cancer. Nature. 2007;448:439–444. - PubMed
    1. Cerami E, Gao J, Dogrusoz U, Gross B, Sumer S, Aksoy B, Jacobsen A, Byrne C, Heuer M, Larsson E, et al. The cBio cancer genomics portal: an open platform for exploring multidimensional cancer genomics data. Cancer Discov. 2012;2:401–404. - PMC - PubMed
    1. Chang M, Asthana S, Gao S, Lee B, Chapman J, Kandoth C, Gao J, Socci N, Solit D, Olshen A, et al. Identifying recurrent mutations in cancer reveals widespread lineage diversity and mutational specificity. Nat Biotechnol. 2016;34:155–163. - PMC - PubMed

Substances