. 2017 Jun 5;27(11):1633-1640.e3.
doi: 10.1016/j.cub.2017.04.039. Epub 2017 May 18.

Responses to Spatial Contrast in the Mouse Suprachiasmatic Nuclei

Affiliations

Responses to Spatial Contrast in the Mouse Suprachiasmatic Nuclei

Joshua W Mouland et al. Curr Biol. .

Abstract

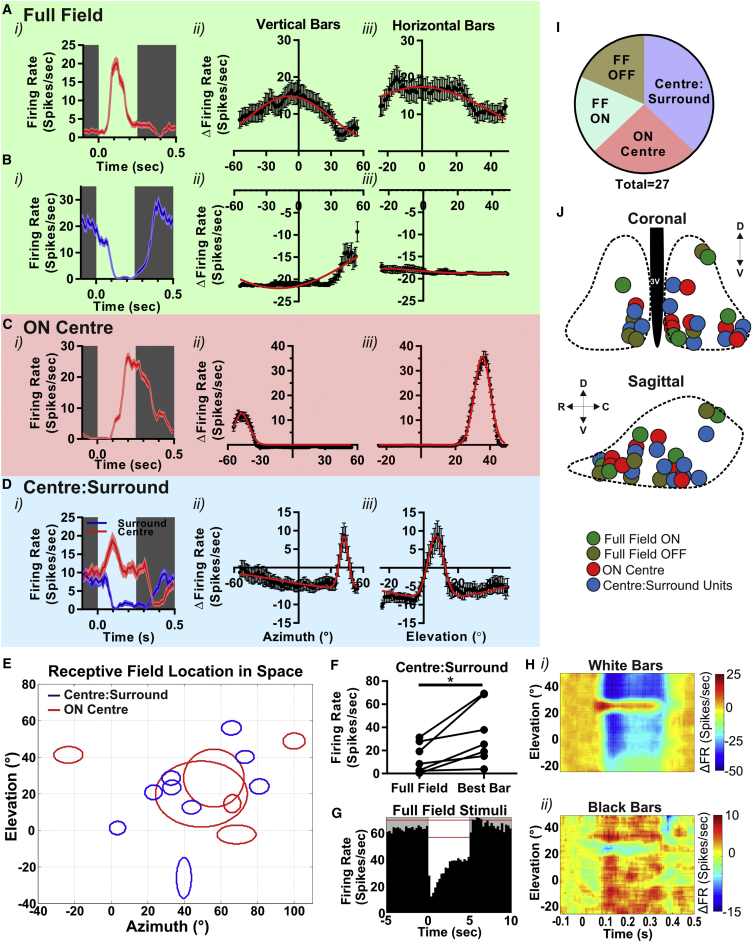
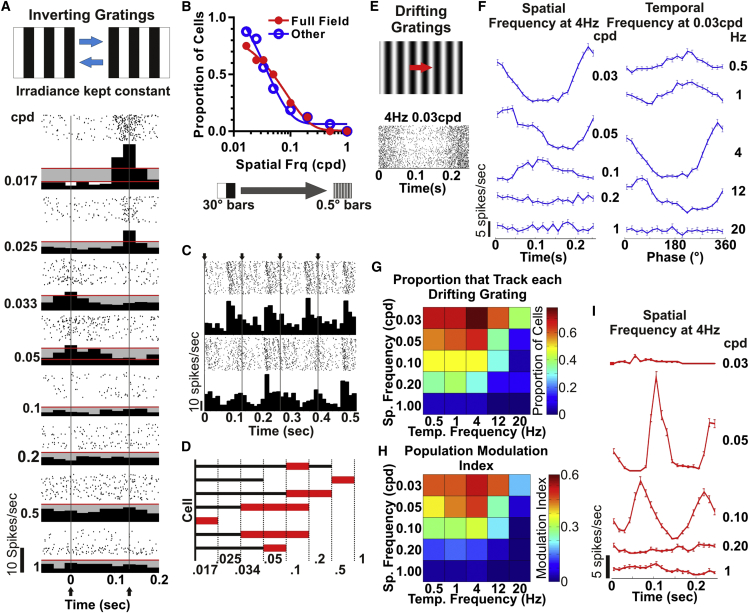
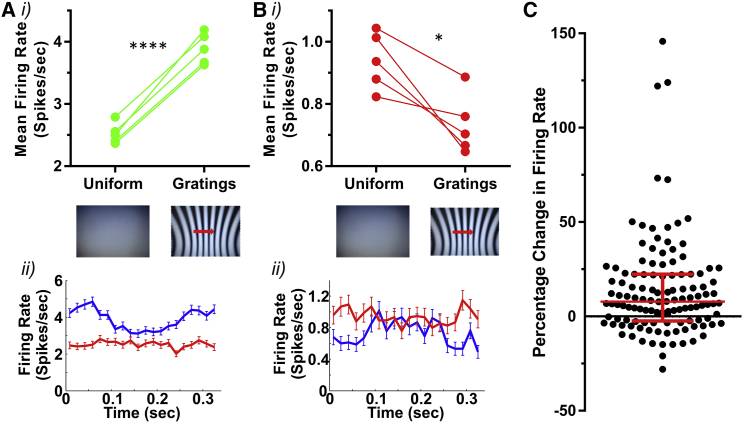
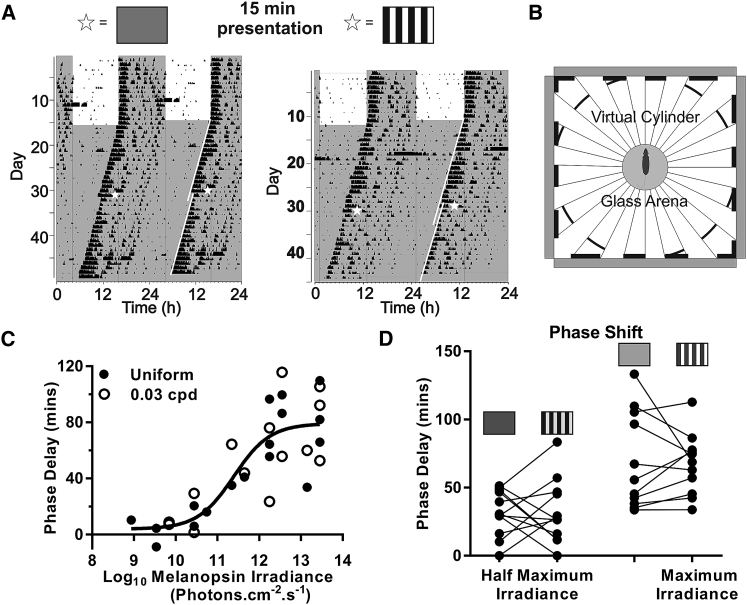
A direct retinal projection targets the suprachiasmatic nucleus (SCN) (an important hypothalamic control center). The accepted function of this projection is to convey information about ambient light (irradiance) to synchronize the SCN's endogenous circadian clock with local time and drive the diurnal variations in physiology and behavior [1-4]. Here, we report that it also renders the SCN responsive to visual images. We map spatial receptive fields (RFs) for SCN neurons and find that only a minority are excited (or inhibited) by light from across the scene as expected for irradiance detectors. The most commonly encountered units have RFs with small excitatory centers, combined with very extensive inhibitory surrounds that reduce their sensitivity to global changes in light in favor of responses to spatial patterns. Other units have larger excitatory RF centers, but these always cover a coherent region of visual space, implying visuotopic order at the single-unit level. Approximately 75% of light-responsive SCN units modulate their firing according to simple spatial patterns (drifting or inverting gratings) without changes in irradiance. The time-averaged firing rate of the SCN is modestly increased under these conditions, but including spatial contrast did not significantly alter the circadian phase resetting efficiency of light. Our data indicate that the SCN contains information about irradiance and spatial patterns. This newly appreciated sensory capacity provides a mechanism by which behavioral and physiological systems downstream of the SCN could respond to visual images [5].

Keywords: circadian; electrophysiology; hyphothalamus; melanopsin; photoentrainment; receptive field; spatial patterns; spatiotemporal tuning; suprachiasmatic nucleus; vision.


Figures

Figure 1
Figure 1
Spatial Receptive Fields in the Mouse SCN (A–D) Responses to the receptive field mapping protocol of single units representative of full-field ON (A), full-field OFF (B), ON center (C), and center:surround (D) response types. In each case, the panel to left (i) shows modulation in firing rate (10-ms bins with a five-bin boxcar average; mean ± SEM) associated with the appearance of a white bar between time 0 and 0.25 s at the location eliciting maximum response (or for center:surround maximum excitation [red] and inhibition [blue]); the center and right panels are the mean ± SEM change firing from baseline (relative to preceding 100 ms) following appearance of vertical (ii) or horizontal (iii) bars as a function of location on azimuth or elevation of bar center (0° corresponds to point directly in front of center of eye). Red lines depict difference of Gaussian fit. (E) Projection of RFs for ON center (red) and center:surround (blue) responses in visual space (0° corresponds to point directly in front of center of eye). (F) Comparison of firing rates for ten center:surround units under full white screen (full field) or a white bar at preferred spatial location (“best bar”; paired t test; p < 0.05). (G) Change in mean firing rate (250-ms bins; red lines denote 99% confidence interval for baseline firing) to a full screen irradiance increment (time 0–5 s) for a representative center:surround unit inhibited by full-field stimulus. (H) Heatmaps showing firing rate (scale to right) of a representative center:surround unit when presented (time 0–0.25 s) with either white bars against a black background (i) or black bars against a white background (ii) at various elevations. (I) Pie chart depicting the proportion of single units that display each of the RF types (“FF” denotes full field; n = 27 cells from 11 mice). (J) Approximate anatomical location of recording sites at which units with each RF type were recorded superimposed upon schematic of the SCN in coronal (above) and sagittal (below) projection. Dotted lines represent boundaries of SCN; 3V, 3rd; C, caudal; D, dorsal; R, rostral; V, ventral. See also Figure S1.
Figure 2
Figure 2
Modulation of SCN Firing by Drifting and Inverting Gratings (A–D) Single-unit data, n = 24 from six mice. (A) Raster and perievent histogram responses of a representative unit to inverting gratings (∼4 Hz; depicted in cartoon form above) as a function of spatial frequency (figures to left in cycles per degree [cpd]) are shown. Red lines indicate ± 3 SDs of mean firing rate across cycle; inversions are at 0 and 0.125 s. (B) Proportion of cells with full-field (n = 8) or “other” (n = 16 either ON center or center:surround) RFs with significant modulations in firing at the grating inversion frequency (spectral power analysis) as a function of spatial frequency is shown. (C) Perievent histograms and rasters over two stimulus cycles (arrows depict inversion times) for two example units exhibiting frequency doubling are shown. (D) The range of spatial frequencies (cpd) over which the seven cells that show frequency doubling responded (black lines) and exhibited frequency doubling (red bar) is shown. (E) Raster plot for a representative unit under 4-Hz 0.03-cpd stimulus (depicted in cartoon form above). (F) Firing rate profiles (mean ± SEM 5-min presentation) for a representative unit over a range of spatial (left) and temporal (right) frequencies. (G) Heatmap (scale to right) of the proportion of cells (n = 23 single units from eight mice) tracking (power at F1 or F2 peak > 4 SDs above the mean) drifting grating at each spatiotemporal frequency. (H) Heatmap (scale to right) of mean modulation index across the population at different spatiotemporal frequencies (modulation index set to 0 for units without significant response to stimulus). (I) Firing rate profiles (mean ± SEM 1,200 repeats) over a range of spatial frequencies for a unit with spatial band pass behavior. See also Figures S1 and S2.
Figure 3
Figure 3
The Effect of Spatial Patterns on Time-Averaged Firing Rate (A) Response of a representative unit showing higher firing under drifting grating (0.10 cpd; 3 Hz) than a full-field gray stimulus of equivalent irradiance (9 × 1014 photons.cm−2.s−1). (i) Mean firing rate over five sequential presentations of gray and grating stimuli (5 min each; paired t test; p < 0.0001) is shown. (ii) Firing rate profile (mean ± SEM) across a cycle of the grating (blue) or an equivalent time window under gray screen (red) is shown. (B) As in (A) but for a unit showing lower firing under drifting grating (paired t test; p < 0.05). (C) Percentage change in multiunit firing rate (n = 122 recording sites for five mice) under grating compared to uniform gray conditions (100% × (FRGrating − FRUniform)/FRUniform; median and interquartile range shown in red). See also Figures S1 and S3.
Figure 4
Figure 4
The Effect of Spatially Patterned Stimuli on Phase Shifting (A) Double-plotted actograms and phase shift of the same mouse to different light pulse stimuli. Mice were pulsed at CT 16 with either a grating- or an irradiance-matched spatially uniform gray screen. (B) Stimulus set up for the light pulse. Mice were placed in a glass area surrounded by four monitors. (C) Irradiance response curve for both spatially uniform stimuli (filled circles) and drifting sinusoidal gratings (0.03 cpd; 4 Hz; open circles). Maximum irradiance was 8.7 × 1013 total photons.cm−2.s−1. No significance was observed between curves (linear p = 0.89; sigmoidal p = 0.99; graph plotted with sigmoidal function of pooled data). (D) Paired t test for intra-individual responses between a static square wave grating (0.03 cpd) and a uniform stimuli at both the irradiance that produced the half-maximal (8.6 × 1011 total photons.cm−2.s−1) and maximal (6.4 × 1013 total photons.cm−2.s−1) response. No difference between the spatial patterned stimuli and the uniform stimuli was detected at either irradiance (half maximum: p = 1.00; maximal: p = 0.78).

Comment in

  • Vision: Melanopsin as a Raumgeber.
    Spitschan M, Aguirre GK. Spitschan M, et al. Curr Biol. 2017 Jul 10;27(13):R644-R646. doi: 10.1016/j.cub.2017.05.052. Curr Biol. 2017. PMID: 28697361

References

    1. Groos G., Mason R. Maintained discharge of rat suprachiasmatic neurons at different adaptation levels. Neurosci. Lett. 1978;8:59–64. - PubMed
    1. Meijer J.H., Watanabe K., Schaap J., Albus H., Détári L. Light responsiveness of the suprachiasmatic nucleus: long-term multiunit and single-unit recordings in freely moving rats. J. Neurosci. 1998;18:9078–9087. - PMC - PubMed
    1. Aggelopoulos N.C., Meissl H. Responses of neurones of the rat suprachiasmatic nucleus to retinal illumination under photopic and scotopic conditions. J. Physiol. 2000;523:211–222. - PMC - PubMed
    1. Brown T.M., Wynne J., Piggins H.D., Lucas R.J. Multiple hypothalamic cell populations encoding distinct visual information. J. Physiol. 2011;589:1173–1194. - PMC - PubMed
    1. Yu Y.-Q., Barry D.M., Hao Y., Liu X.-T., Chen Z.-F. Molecular and neural basis of contagious itch behavior in mice. Science. 2017;355:1072–1076. - PMC - PubMed

LinkOut - more resources