Review
. 2017 Aug 1:125:45-54.
doi: 10.1016/j.ymeth.2017.05.011. Epub 2017 May 18.

Methodologies for studying the spliceosome's RNA dynamics with single-molecule FRET

Affiliations
Review

Methodologies for studying the spliceosome's RNA dynamics with single-molecule FRET

Clarisse van der Feltz et al. Methods. .

Abstract

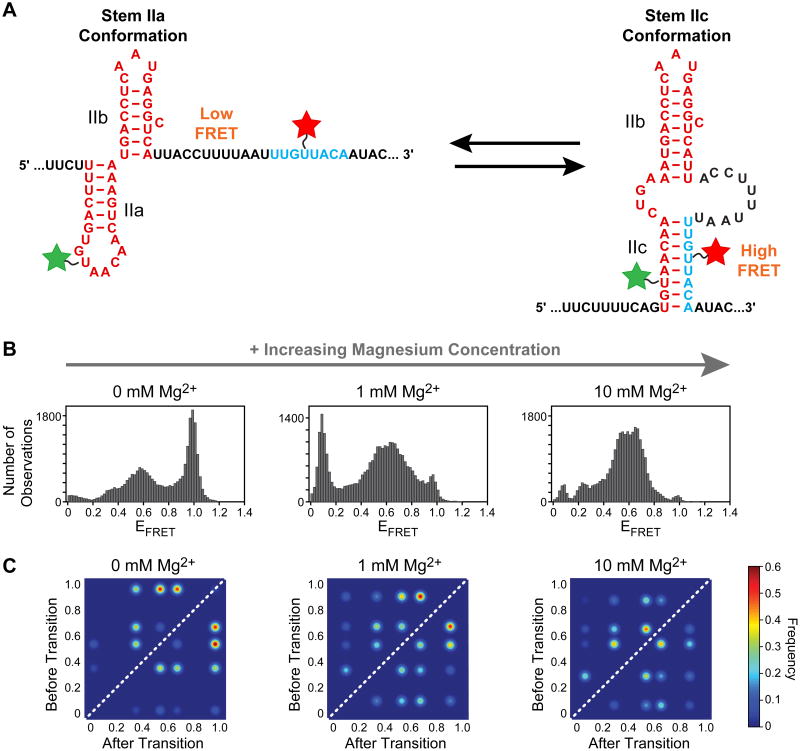
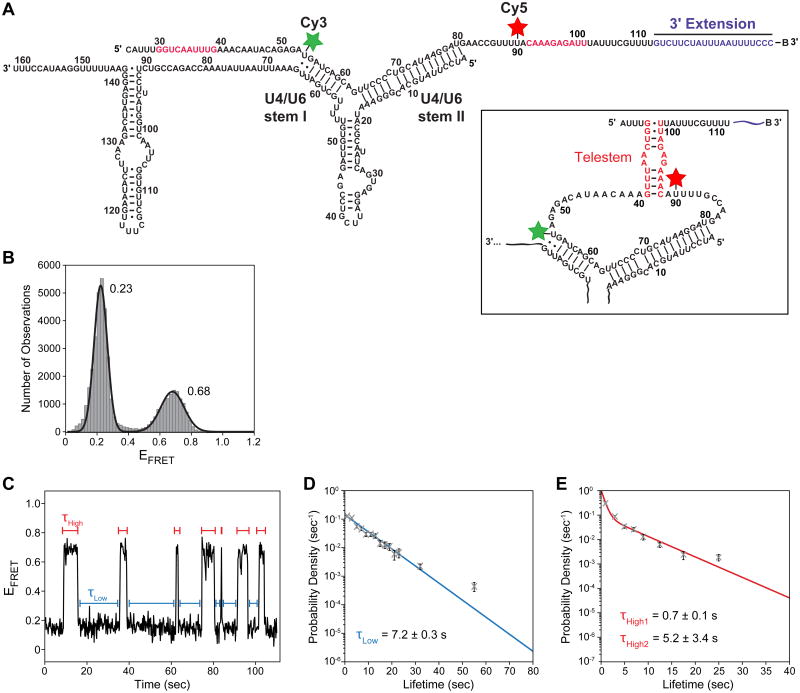
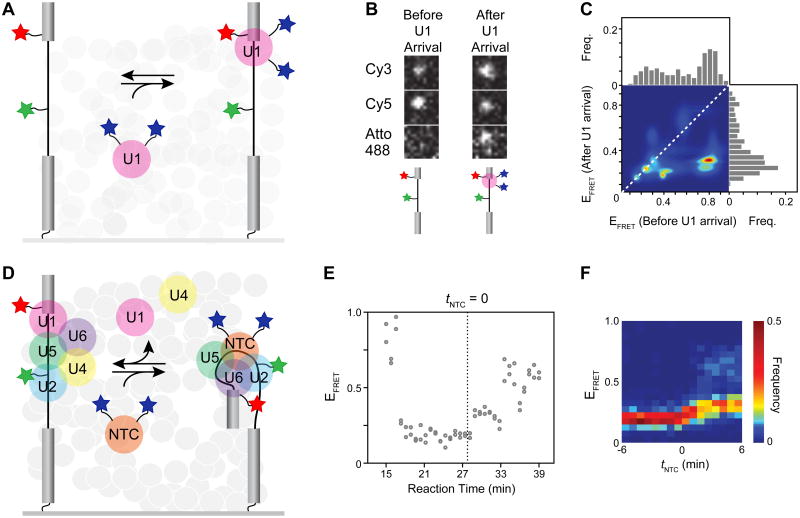
The spliceosome is an extraordinarily dynamic molecular machine in which significant changes in composition as well as protein and RNA conformation are required for carrying out pre-mRNA splicing. Single-molecule fluorescence resonance energy transfer (smFRET) can be used to elucidate these dynamics both in well-characterized model systems and in entire spliceosomes. These types of single-molecule data provide novel information about spliceosome components and can be used to identify sub-populations of molecules with unique behaviors. When smFRET is combined with single-molecule fluorescence colocalization, conformational dynamics can be further linked to the presence or absence of a given spliceosome component. Here, we provide a description of experimental considerations, approaches, and workflows for smFRET with an emphasis on applications for the splicing machinery.

Keywords: Dynamics; FRET; Fluorescence; RNA; Single-molecule; Spliceosome.


Figures

Figure 1
Figure 1
Cy3 and Cy5 fluorophore characteristics and attachment to RNA for FRET studies. (A) Chemical structures of Cy dyes frequently used for FRET with NHS leaving groups (grey) for fluorophore attachment. R represents sulfonate groups typically added to Cy dyes to increase solubility. (B) Excitation (Ex) and emission (Em) spectra for Cy3 and Cy5 fluorophores. The spectral overlap between Cy3 emission and Cy5 excitation is shown (yellow). Spectra obtained from GE Healthcare Life Sciences. (C) Example plot of the FRET between a Cy3:Cy5 pair. At 0.5 FRET efficiency, the fluorophore pair distance is equal to the Förster distance, R0, which is ∼6 nm for Cy3:Cy5 [32]. (D) Examples of commercially available options for fluorophore labeling RNAs either at the 5′ or 3′ ends or internally. Chemical structures shown are those commercially available from Integrative DNA Technologies.
Figure 2
Figure 2
Generating RNA constructs for FRET through splinted ligation. (A) Schematic overview of steps necessary for splinted ligation. The DNA splint (blue) basepairs to both the 5′ and 3′ oligos, bringing them in close proximity for ligation. The 5′ phosphoryl group and 3′ biotin are shown as circled “P” and “B”, respectively. (B) An example of the results from a splinted RNA ligation to prepare a smFRET reporter RNA, as analyzed by denaturing PAGE. The ligated product contains both the Cy3 and Cy5 RNAs and is resolved from excess, unligated Cy5 RNA. The ligated product can be excised and extracted from the gel for smFRET experiments.
Figure 3
Figure 3
Single-molecule FRET data collection. (A) Illustration of an assembled flow-cell for smFRET assembled from a quartz slide, glass coverslip, double-sided tape, and vacuum grease. Holes drilled into the quartz slide provide inlets and outlets for sample application and buffer exchange. (B) 2D representation of an RNA molecule immobilized to a quartz slide for smFRET. Biotin-PEG molecules (B) are shown attached to a streptavidin tetramer (x). Energy transfer (yellow arrow) occurs with distance dependent efficiency between the two fluorophores. (C) A prism-based TIRF microscope setup for smFRET data collection. The slide is placed between the prism and the objective. A thin layer of oil creates even contact between the slide and the prism while the objective immersion fluid is located between the coverslip and the objective. The incoming laser excites the donor fluorophore by entering the prism from above (green arrow).
Figure 4
Figure 4
Workflow of smFRET data processing. In the first step, the camera images from the donor (green) and acceptor (red) channels are used to select molecules present in both (yellow boxes). Next, integrated fluorescence trajectories of the fluorescent signal from both the donor (green) and acceptor (red) are plotted for each molecule to confirm anti-correlation and correct for background. Finally, the EFRET is calculated and plotted for the molecule for each time point (blue line).
Figure 5
Figure 5
U2 snRNA dynamics analyzed by smFRET by Rodgers et al. [20]. (A) Two mutually exclusive RNA structures can be adopted U2 stem II and are described by different FRET states. The smFRET reporter RNA was labeled with Cy3 (green) and Cy5 (red). (B) Histograms plotting EFRET for the smFRET reporter RNA in response to Mg2+ (C) TODPs of EFRET for stem II molecular transitions. The structural transitions of the RNA increased and changed in EFRETin the presence of Mg2+ The figure shown was adapted from reference [20] and used with permission.
Figure 6
Figure 6
U4/U6 snRNA dynamics analyzed by smFRET by Rodgers et al. [21]. (A) 2D representation of the proposed structural states of U6 while basepaired to U4 snRNA. U6 was labeled with Cy3 (green) and Cy5 (red) fluorophores. (B) Histogram of EFRET values observed for the U4/U6 smFRET reporter shown in (A). Two states were observed, one centered at EFRET = 0.23 and one at EFRET = 0.68. (C) EFRET from a single U4/U6 molecule shows multiple and frequent transitions between the two states indicated by blue and red bars. (D and E) Measured dwell times τLow (blue) and τHigh (red) were combined and plotted as probability density histograms. Calculated lifetimes of the FRET states were obtained by fitting these distributions to maximum likelihood functions with either one (D) or two (E) kinetic parameters. The figure shown was adapted from reference [21] and used with permission.
Figure 7
Figure 7
Pre-mRNA dynamics analyzed by smFRET and colocalization fluorescence microscopy by Crawford et al. [24]. (A) Experimental design used by Crawford et al. The pre-mRNA was labeled just upstream of the 5′ splice site with Cy5 (red star) and the branchsite with Cy3 (green star). The U1 snRNP was doubly labeled with Atto488 (blue stars). (B) Colocalization of U1 with the pre-mRNA (Atto488 spot) coincides with a decrease in Cy5 acceptor FRET and an increase in Cy3 donor FRET. (C) Heat map representation of EFRET transitions observed before and after U1 binding. (D) Experimental design as in panel (A) except that the NTC was doubly labeled with Atto488 (blue stars) for monitoring later stages in spliceosome assembly. (E) EFRET plotted as a function of reaction time for a single pre-mRNA molecule shows a shift from low to mid EFRET occurring after NTC arrival (dotted line). (F) Heat map representation for a population of 80 pre-mRNA molecules shows that the EFRET transition shown in panel (E) is a common feature of spliceosome assembly. Shaded circles in (A) and (D) represent the yeast whole cell extract in which the experiments were performed. The figure shown was adapted from reference [24] and used with permission.

Similar articles

Cited by

References

    1. Moore MJ, Proudfoot NJ. Pre-mRNA processing reaches back to transcription and ahead to translation. Cell. 2009;136(4):688–700. - PubMed
    1. Cech TR, Steitz JA. The noncoding RNA revolution-trashing old rules to forge new ones. Cell. 2014;157(1):77–94. - PubMed
    1. Pomeranz Krummel DA, Oubridge C, Leung AKW, Li J, Nagai K. Crystal structure of human spliceosomal U1 snRNP at 5.5 Å resolution. Nature. 2009;458(7237):475–80. - PMC - PubMed
    1. Yan C, Hang J, Wan R, Huang M, Wong CC, Shi Y. Structure of a yeast spliceosome at 3.6-angstrom resolution. Science. 2015;349(6253):1182–91. - PubMed
    1. Kondo Y, Oubridge C, van Roon AM, Nagai K. Crystal structure of human U1 snRNP, a small nuclear ribonucleoprotein particle, reveals the mechanism of 5′ splice site recognition. Elife. 2015;4 - PMC - PubMed

MeSH terms

LinkOut - more resources