. 2017 Mar 11;13(4):458-470.
doi: 10.7150/ijbs.18644. eCollection 2017.

Characterization of Cytosine Methylation and the DNA Methyltransferases of Toxoplasma gondii

Affiliations

Characterization of Cytosine Methylation and the DNA Methyltransferases of Toxoplasma gondii

Haixia Wei et al. Int J Biol Sci. .

Abstract

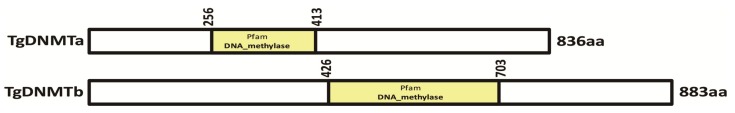
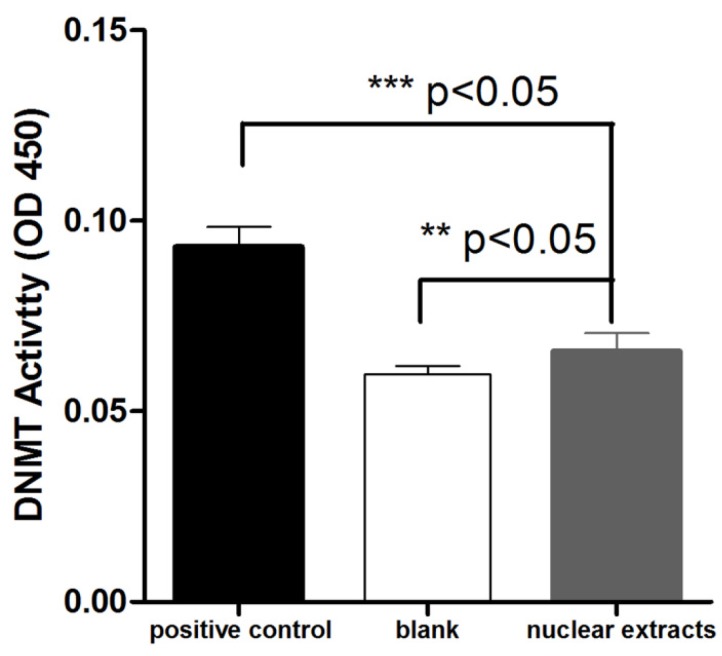
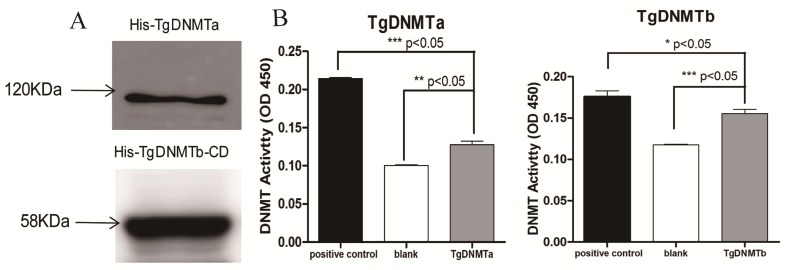
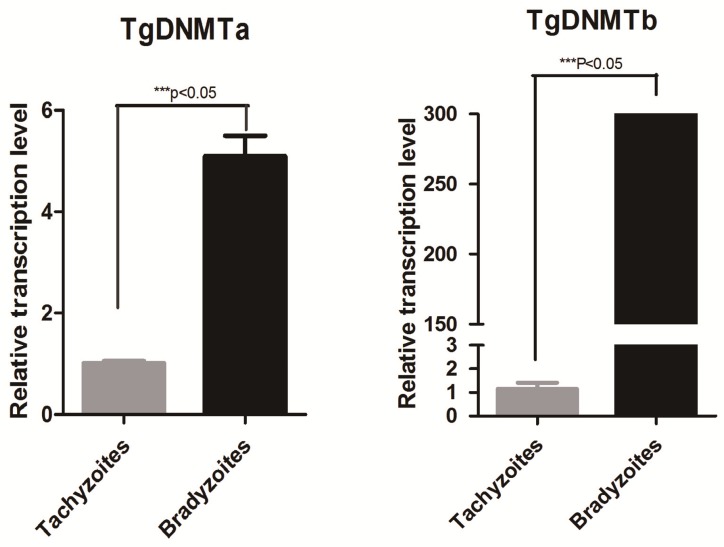
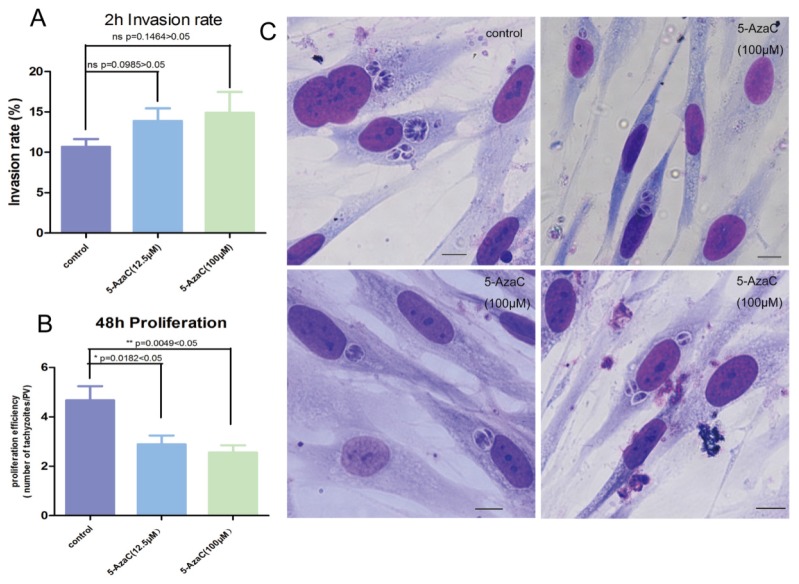
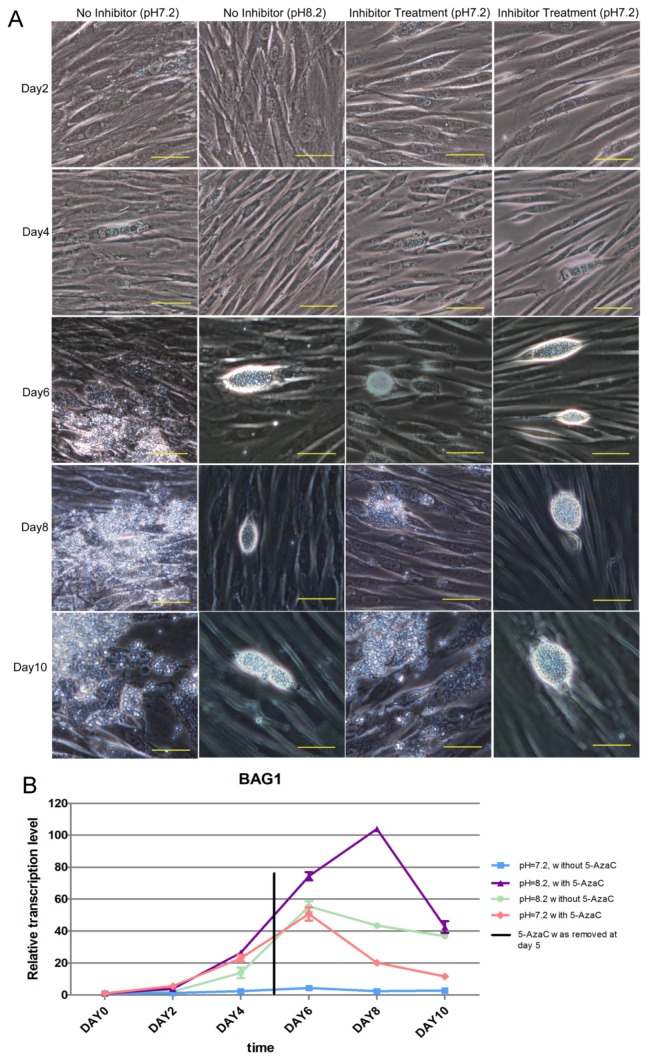
DNA methylation is a key epigenetic modification which confers phenotypic plasticity and adaptation. Cyst-forming strains of Toxoplasma gondii undergo tachyzoite to bradyzoite conversion after initial acute infection of a host, and the reverse conversion may occur in immune-suppressed hosts. The formation of m5C is catalyzed by DNA methyltransferase (DNMT). We identified two functional DNA methyltransferases, TgDNMTa and TgDNMTb, in T. gondii that may mediate DNA methylation. The recombinant proteins showed intrinsic methyltransferase activity; both have higher transcription levels in bradyzoites than that in tachyzoites. We performed genome-wide analysis of DNA methylation in tachyzoites and bradyzoites. The results showed more methylation sites in bradyzoites than that in tachyzoites. The most significantly enriched GO-terms of genes with DNA methylation were associated with basal cellular processes such as energy metabolism and parasite resistance to host immunity. Tachyzoite proliferation in parasitophorous vacuoles (PV) can be inhibited by the DNA methyltransferase inhibitor 5-azacytidine, a chemical analogue of the nucleotide cytosine that can inactivate DNA methyltransferases. These findings provide the first confirmation of DNA methylation in T. gondii.

Keywords: 5-azacytidine.; 5-cytosine methyltransferase; DNA methylation; Toxoplasma gondii; bradyzoite; tachyzoite.


Conflict of interest statement

Competing Interests: The authors have declared that no competing interest exists.

Figures

Figure 1
Figure 1
Identification of the TgDNMT candidates. Two genes (TGME49_227660 and TGME49_243610) encoding the proteins with a DNMT domain (accession number PF00145) were found in the T. gondii genome and were designated as Tgdnmta and Tgdnmtb. The putative TgDNMTa and TgDNMTb contained DNMT domains at 256-413 aa and 426-703 aa, respectively.
Figure 2
Figure 2
Detection of DNMT activity in T. gondii nuclear protein extracts. The OD450 values were measured for the reactions performed with 0.5 μg of purified bacterial DNMT (positive control), 10 μg of total T. gondii nuclear protein extract, and buffer only (blank). Three repetitive experiments with triplicate for each sample were conducted. The DNMT activity difference between the nuclear protein extract and negative control (or positive control) was analyzed with one-way ANOVA in SPSS13.0 software (Chicago, IL, USA), and a significant difference was found in both comparisons. T. gondii nuclear protein extract had apparent DNMT activity though it was lower than that of the bacterial DNMT provided by the manufacturer for the positive control. Error bars: standard deviation (SD).
Figure 3
Figure 3
Validation of TgDNMTs as functional DNMTs by prokaryotic expression and activity assay. A: Western blot analysis of purified TgDNMTa and TgDNMTb-conserved domain expressed in E. coli with the His-tag antibody. B: The recombinant DNMT activity was assayed by the method illustrated in Figure 2. A significant difference was found between the recombinant TgDNMTa or TgDNMTb- conserved domain with the blank (negative control). TgDNMTa and TgDNMTb- conserved domain had apparent DNMT activity though it was lower than that of the bacterial DNMT provided by the manufacturer as a positive control. Error bars: Standard Error of Mean (SEM).
Figure 4
Figure 4
Detection of Tgdnmta and Tgdnmtb transcription in tachyzoites and bradyzoites. Each qPCR reaction were performed in triplicate, and the detection were repeated for three times. Relative transcription levels of Tgdnmta and Tgdnmtb genes were normalized to the transcription level of housekeeping gene GAPDH and were calculated using the 2-ΔΔCt method. The differences of Tgdnmt transcriptional levels between tachyzoites and bradyzoites were analyzed with an independent t-test in SPSS13.0 software (Chicago, IL, USA). The transcription levels of both Tgdnmta and Tgdnmtb in bradyzoites were significantly higher than those in tachyzoites, and especially for Tgdnmtb, the relative transcriptional level in bradyzoites was approximately 300 fold higher than that of the transcription level found in tachyzoites. Error bars: SEM.
Figure 5
Figure 5
Verification of the cytosine methylation sites in the T. gondii genome using enzymes (HpaII/MspI) coupled with PCR. HpaII and MspI were used to digest gDNA followed by PCR or qPCR. A: At the T-IV-1336110+ site, where partial methylation was presented in tachyzoites, the methylation-sensitive enzyme HpaII did not fully cut the gDNA at this site, and PCR product appeared; however, methylation-insensitive enzyme MspI cut the gDNA at this site thoroughly, and no PCR products were obtained. B: qPCR validation was conducted after the gDNA was digested by HpaII and MspI, respectively. All results were obtained from three repetitive experiments with three replicates. T -tachyzoites, B -bradyzoites. Error bars: SEM.
Figure 6
Figure 6
Comparison of global DNA methylation in tachyzoite and bradyzoite genomes. A-B: Methylation context distribution of m5C in tachyzoites and bradyzoites; H represents any nucleotide A, T, and C. C: comparison of the proportion of methylated cytosines within the compartment of the genes.
Figure 7
Figure 7
Top five GO terms enriched for differentially abundant cytosine methylation regions (DMRs). A: the GO terms enriched in “molecular function” and “biological process” for the genes with different mCpG level in the upstream region; B: the GO terms enriched in “molecular function” and “biological process” for the genes with different mC levels in the CDS.
Figure 8
Figure 8
The relationship between DNA methylation and gene expression. 190 genes with different mCpG levels in the upstream region, and 576 genes with different mC levels in the CDS region, and all with a transcription level of "|log2 expression ration|>1" were included in the analysis. Among these 190 genes, the proportion of significantly higher methylation (bradyzoite/tachyzoites≥10) is slightly higher (approximately 1.15 times higher) in the down-regulated genes than in the up-regulated genes of bradyzoites, when compared to tachyzoite gene transcription; but among the 576 genes, the proportion of significantly higher methylation (bradyzoite/tachyzoites≥10) is apparently higher in the up-regulated genes than in the down-regulated genes of bradyzoites, when compared to tachyzoite gene transcription.
Figure 9
Figure 9
Effect of the transient inhibition of T. gondii endogenous DNMT activity with 5-AzaC A: 5-AzaC treatment of T. gondii had no apparent influence on infection rate at 2 h post infection, and the infection rates in the inhibitor treatment groups were a little bit higher than that in the control group, but no significant difference was shown (p>0.05). Error bars: SEM. B: at 48 h post infection, the average number of parasites in each PV was approximately 5 in host cells infected with normal tachyzoites; while, in the cells infected with 5-AzaC treated tachyzoites, the number of tachyzoites per PV was approximately 3; a significant difference was found between the control group and the 5-AzaC treatment group (p<0.05), but no significant difference was observed between the groups infected with the tachyzoites treated with different concentrations (12.5 µM, 100 µM) of 5-AzaC. Error bars: SEM. C: the light microscopy of the HFF cells infected by tachyzoites treated or untreated with 5-AzaC, stained with Giemsa, and observed under a 100x objective lens (1000x magnification) at 48 h post infection. In the control group, the mean number of tachyzoites per PV was significantly more than that in the 5-AzaC treatment group. Bar: 10µm
Figure 10
Figure 10
Result of the long-term treatment of intracellular tachyzoites with 5-AzaC A: 5-AzaC is toxic to HFF cells, and the cells began to shrink on day 2 in the Inhibitor Treatment (pH 7.2), Inhibitor Treatment (pH 8.2) groups. On day 4, clear PVs were found in the four groups. Because the cells began to detach in the 5-AzaC treatment groups, the inhibitor was removed on day 5. On day 6, cyst-like structures were observed in three groups: No Inhibitor (pH 8.2); Inhibitor Treatment (pH 7.2); and Inhibitor Treatment (pH 8.2). In the No Inhibitor (pH 7.2) group, the cells were ruptured, and the tachyzoites were released. On days 8 and 10, because the inhibitor had been removed and the cells recovered, cyst-like structures were almost absent in Inhibitor Treatment (pH 7.2) group, and tachyzoites were released, which is similar to the No Inhibitor (pH 7.2) group. In the other two groups, Inhibitor Treatment (pH 8.2) and No Inhibitor (pH 8.2), the cyst-like structures could still be observed. All of the images were taken with a 20x objective lens (200 x magnification). Bar: 50µm. B: BAG 1 transcription levels were used to evaluate the conversion process, and on day 0 and day 2, the transcription level of BAG1 was low in the four groups; from day 4 to day 6, the transcription levels of BAG1 in the other three groups were significantly higher than those in the No Inhibitor (pH 7.2) group, and the Inhibitor Treatment (pH 8.2) group showed the highest level. On day 8, because the inhibitor had been removed and the cells recovered, the transcription level of BAG1 decreased greatly in the Inhibitor Treatment (pH 7.2) group; but although the inhibitor had been removed, the transcription level of BAG1 in the Inhibitor Treatment (pH 8.2) group remained at a high level. On day 10, the transcriptional level of BAG1 in the Inhibitor Treatment (pH 8.2) group greatly decreased, but remained at a high level, followed by the No Inhibitor (pH 8.2) group and the Inhibitor Treatment (pH 7.2) group. Error bars: SD.

Similar articles

Cited by

References

    1. Hotez PJ. Neglected parasitic infections and poverty in the United States. PLoS Negl Trop Dis. 2014;8(9):e3012. - PMC - PubMed
    1. Adl SM, Simpson AG, Lane CE. et al. The revised classification of eukaryotes. J Eukaryot Microbiol. 2012;59(5):429–93. - PMC - PubMed
    1. Montoya JG, Liesenfeld O. Toxoplasmosis. Lancet. 2004;363(9425):1965–76. - PubMed
    1. Lyons RE, McLeod R, Roberts CW. Toxoplasma gondii tachyzoite-bradyzoite interconversion. Trends Parasitol. 2002;18(5):198–201. - PubMed
    1. Kim K, Weiss LM. Toxoplasma: the next 100 years. Microbes Infect. 2008;10(9):978–84. - PMC - PubMed

Publication types

MeSH terms

LinkOut - more resources