

Co-existence of Methanogenesis and Sulfate Reduction with Common Substrates in Sulfate-Rich Estuarine Sediments
- PMID: 28529500
- PMCID: PMC5418336
- DOI: 10.3389/fmicb.2017.00766
Co-existence of Methanogenesis and Sulfate Reduction with Common Substrates in Sulfate-Rich Estuarine Sediments
Abstract
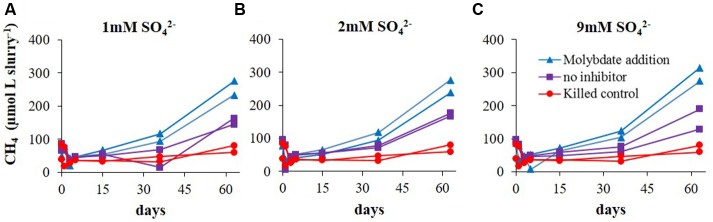
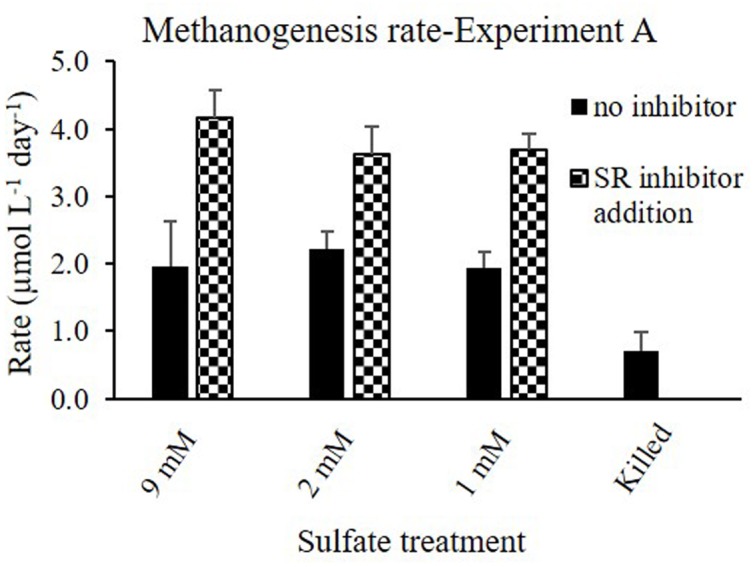
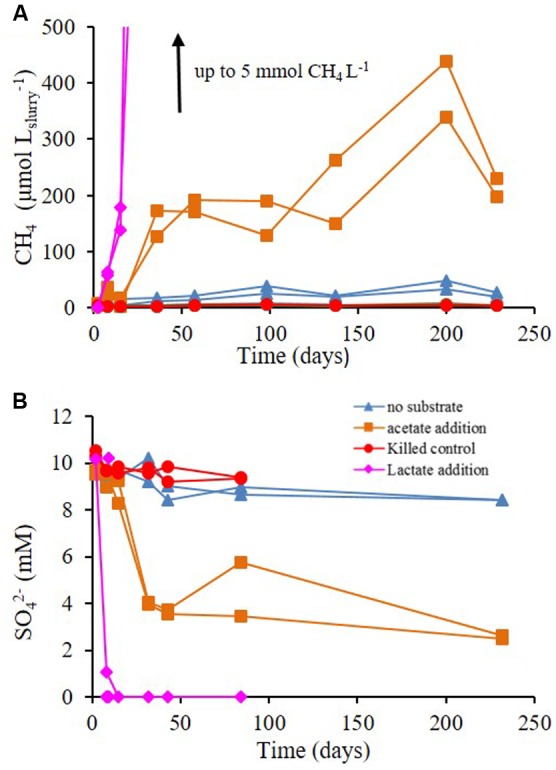
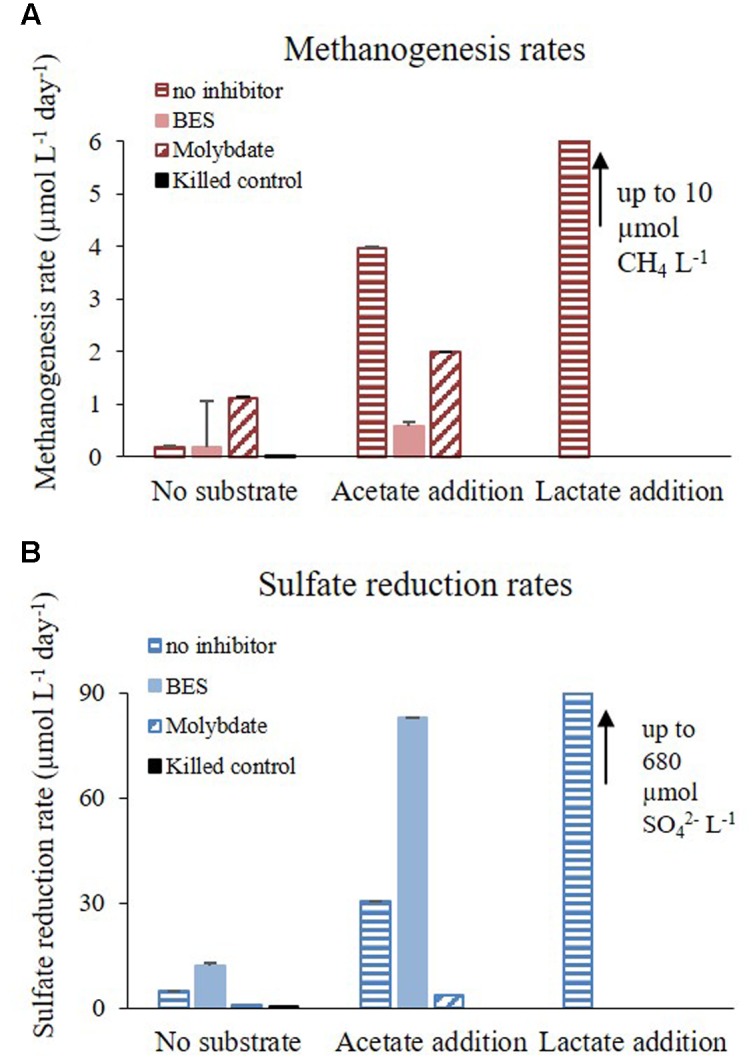
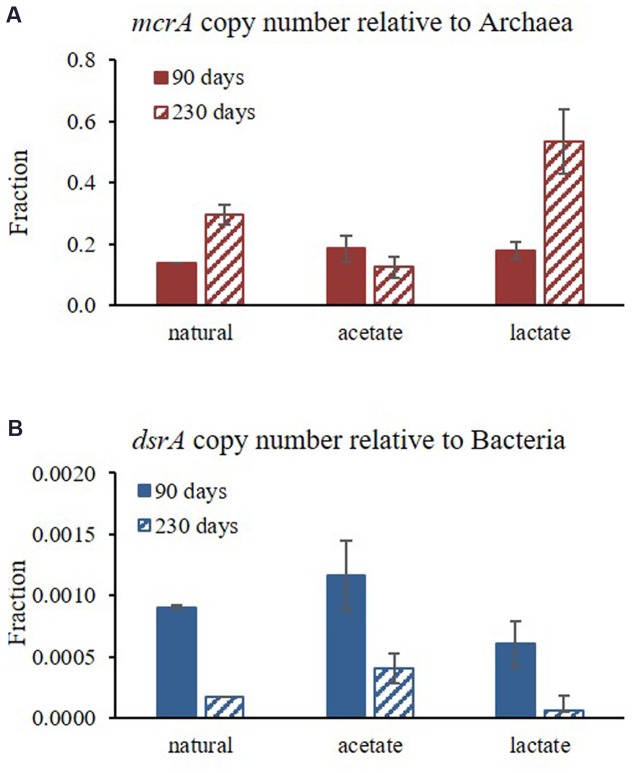
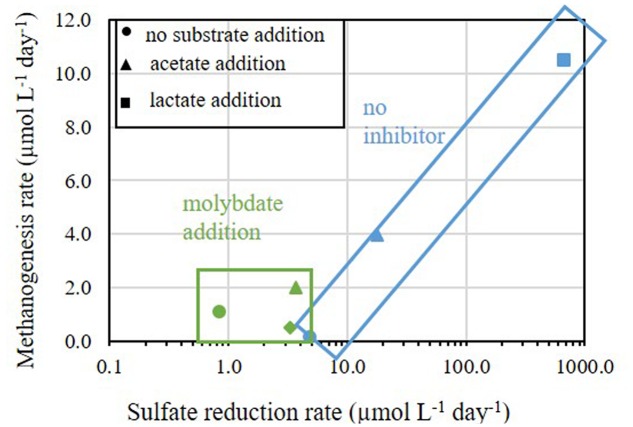
The competition between sulfate reducing bacteria and methanogens over common substrates has been proposed as a critical control for methane production. In this study, we examined the co-existence of methanogenesis and sulfate reduction with shared substrates over a large range of sulfate concentrations and rates of sulfate reduction in estuarine systems, where these processes are the key terminal sink for organic carbon. Incubation experiments were carried out with sediment samples from the sulfate-methane transition zone of the Yarqon (Israel) estuary with different substrates and inhibitors along a sulfate concentrations gradient from 1 to 10 mM. The results show that methanogenesis and sulfate reduction can co-exist while the microbes share substrates over the tested range of sulfate concentrations and at sulfate reduction rates up to 680 μmol L-1 day-1. Rates of methanogenesis were two orders of magnitude lower than rates of sulfate reduction in incubations with acetate and lactate, suggesting a higher affinity of sulfate reducing bacteria for the available substrates. The co-existence of both processes was also confirmed by the isotopic signatures of δ34S in the residual sulfate and that of δ13C of methane and dissolved inorganic carbon. Copy numbers of dsrA and mcrA genes supported the dominance of sulfate reduction over methanogenesis, while showing also the ability of methanogens to grow under high sulfate concentration and in the presence of active sulfate reduction.
Keywords: co-existence; estuaries; methanogenesis; substrates; sulfate reduction.
Figures


Similar articles
-
Biological methane production and accumulation under sulfate-rich conditions at Cape Lookout Bight, NC.Front Microbiol. 2023 Oct 6;14:1268361. doi: 10.3389/fmicb.2023.1268361. eCollection 2023. Front Microbiol. 2023. PMID: 37869653 Free PMC article.
-
Cryptic Methane-Cycling by Methanogens During Multi-Year Incubation of Estuarine Sediment.Front Microbiol. 2022 Mar 17;13:847563. doi: 10.3389/fmicb.2022.847563. eCollection 2022. Front Microbiol. 2022. PMID: 35369448 Free PMC article.
-
Substrates for sulfate reduction and methane production in intertidal sediments.Appl Environ Microbiol. 1983 Jan;45(1):193-9. doi: 10.1128/aem.45.1.193-199.1983. Appl Environ Microbiol. 1983. PMID: 16346165 Free PMC article.
-
Upflow anaerobic sludge blanket reactor--a review.Indian J Environ Health. 2001 Apr;43(2):1-82. Indian J Environ Health. 2001. PMID: 12397675 Review.
-
The bioenergetics of methanogenesis.Biochim Biophys Acta. 1984 Sep 6;768(2):113-63. doi: 10.1016/0304-4173(84)90002-8. Biochim Biophys Acta. 1984. PMID: 6236847 Review.
Cited by
-
Microbial community composition across a coastal hydrological system affected by submarine groundwater discharge (SGD).PLoS One. 2020 Jun 29;15(6):e0235235. doi: 10.1371/journal.pone.0235235. eCollection 2020. PLoS One. 2020. PMID: 32598345 Free PMC article.
-
Magnetite Alters the Metabolic Interaction between Methanogens and Sulfate-Reducing Bacteria.Environ Sci Technol. 2023 Oct 31;57(43):16399-16413. doi: 10.1021/acs.est.3c05948. Epub 2023 Oct 20. Environ Sci Technol. 2023. PMID: 37862709 Free PMC article.
-
Biological methane production and accumulation under sulfate-rich conditions at Cape Lookout Bight, NC.Front Microbiol. 2023 Oct 6;14:1268361. doi: 10.3389/fmicb.2023.1268361. eCollection 2023. Front Microbiol. 2023. PMID: 37869653 Free PMC article.
-
Drivers of methane-cycling archaeal abundances, community structure, and catabolic pathways in continental margin sediments.Front Microbiol. 2025 Feb 6;16:1550762. doi: 10.3389/fmicb.2025.1550762. eCollection 2025. Front Microbiol. 2025. PMID: 39980692 Free PMC article.
-
Niche Differentiation of Sulfate- and Iron-Dependent Anaerobic Methane Oxidation and Methylotrophic Methanogenesis in Deep Sea Methane Seeps.Front Microbiol. 2020 Jul 8;11:1409. doi: 10.3389/fmicb.2020.01409. eCollection 2020. Front Microbiol. 2020. PMID: 32733397 Free PMC article.
References
-
- Abril G., Iversen N. (2002). Methane dynamics in a shallow non-tidal estuary (Randers Fjord, Denmark). Mar. Ecol. Prog. Ser. 230 171–181. 10.3354/meps230171 - DOI
-
- Antler G., Turchyn A. V., Herut B., Davies A., Rennie V. C., Sivan O. (2014). Sulfur and oxygen isotope tracing of sulfate driven anaerobic methane oxidation in estuarine sediments. Estuar. Coast. Shelf Sci. 142 4–11. 10.1016/j.ecss.2014.03.001 - DOI
-
- Archer D. (2007). Methane hydrate stability and anthropogenic climate change. Biogeosciences 4 993–1057. 10.5194/bgd-4-993-2007 - DOI
-
- Arnon S., Avni N., Gafny S. (2015). Nutrient uptake and macroinvertebrate community structure in a highly regulated Mediterranean stream receiving treated wastewater. Aquat. Sci. 77 623–637. 10.1007/s00027-015-0407-6 - DOI
-
- Balci N., Shanks W. C., Mayer B., Mandernack K. W. (2007). Oxygen and sulfur isotope systematics of sulfate produced by bacterial and abiotic oxidation of pyrite. Geochim. Cosmochim. Acta 71 3796–3811. 10.1016/j.gca.2007.04.017 - DOI
LinkOut - more resources
Full Text Sources
Other Literature Sources