. 2017 Jan;2(7):eaaj2195.
doi: 10.1126/sciimmunol.aaj2195. Epub 2017 Jan 20.

Complement C5a Receptor is the Key Initiator of Neutrophil Adhesion Igniting Immune Complex-induced Arthritis

Affiliations

Complement C5a Receptor is the Key Initiator of Neutrophil Adhesion Igniting Immune Complex-induced Arthritis

Yoshishige Miyabe et al. Sci Immunol. 2017 Jan.

Abstract

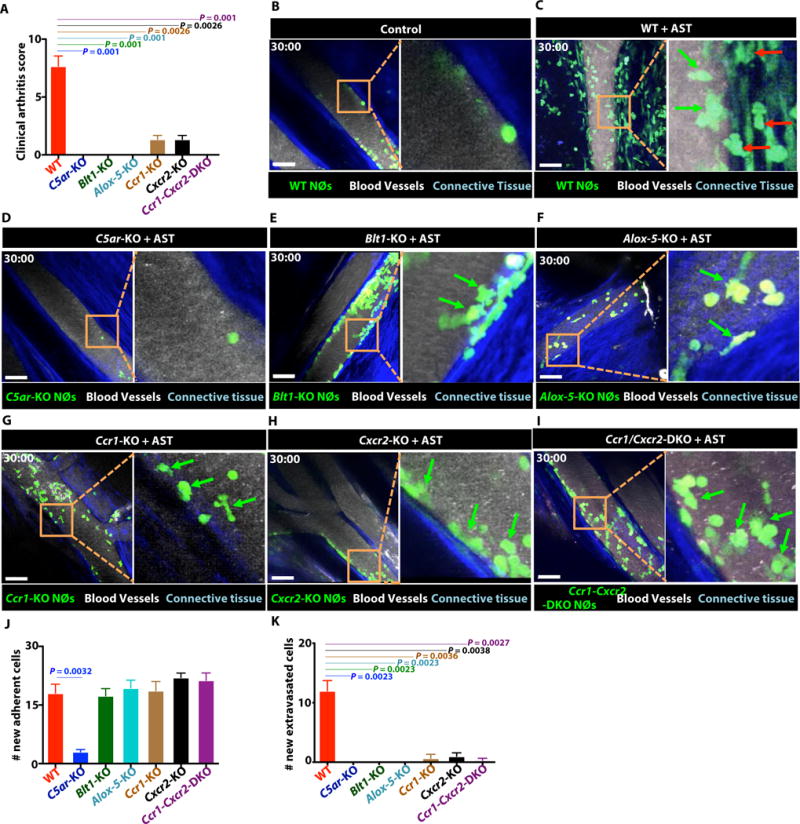
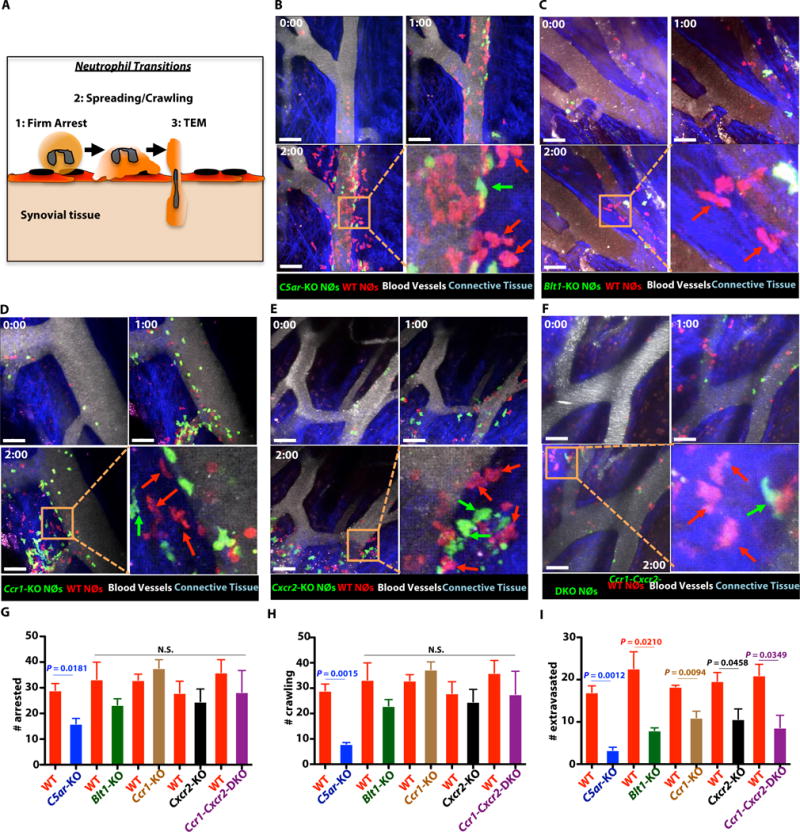
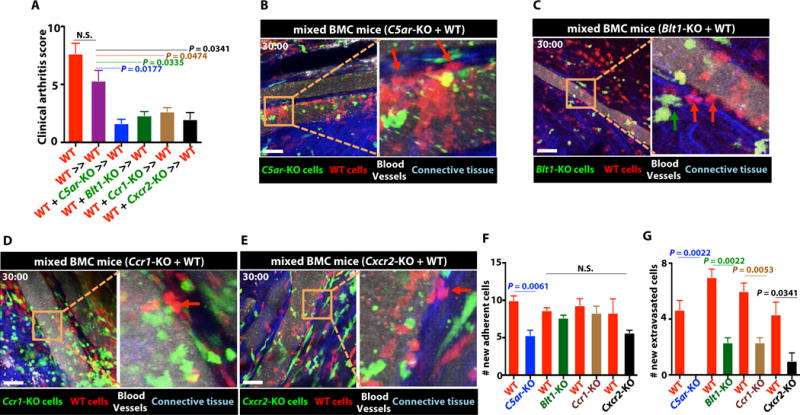
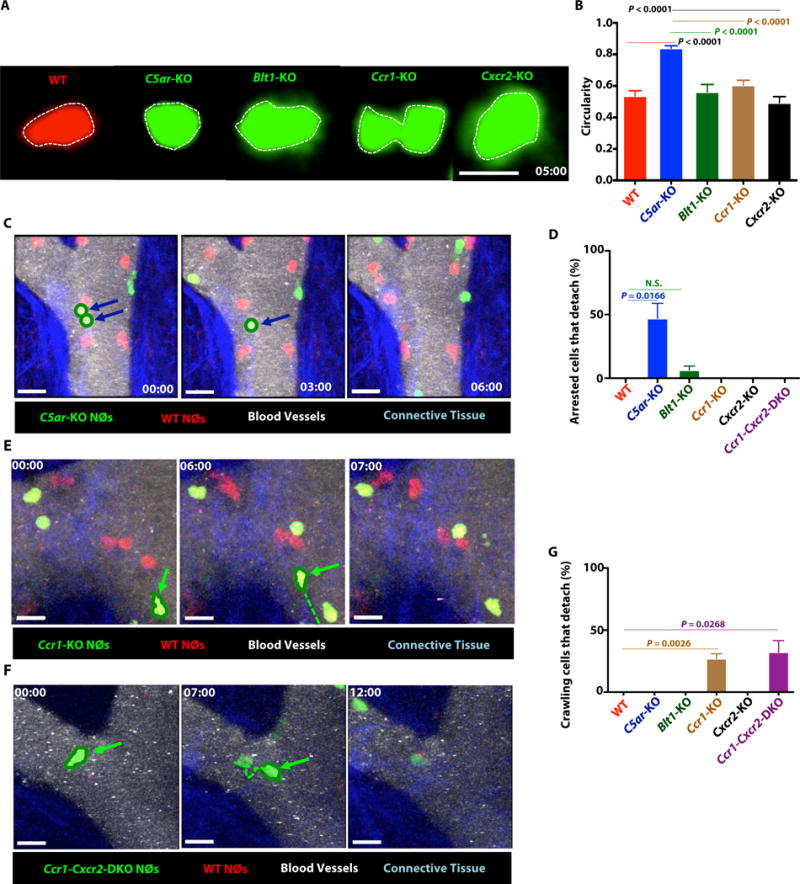
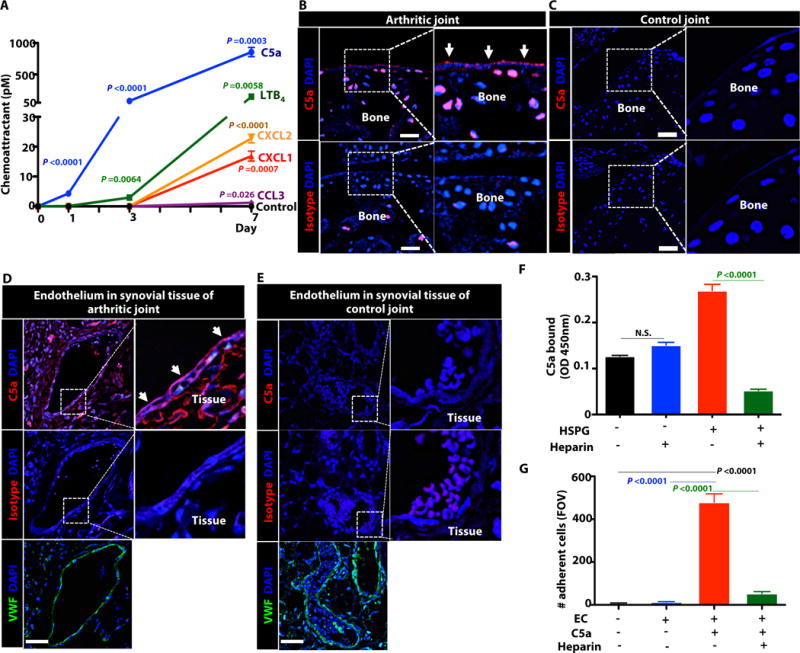
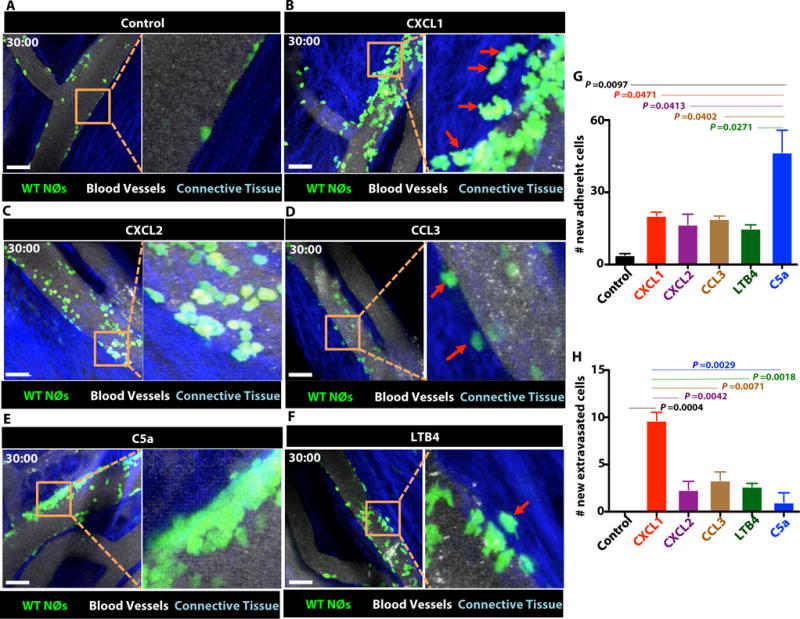
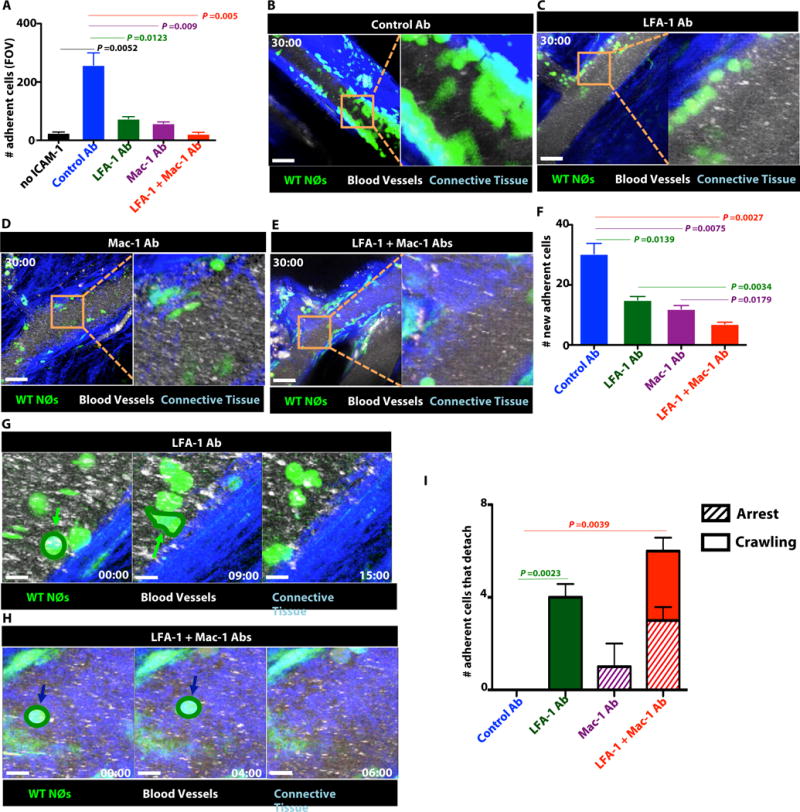
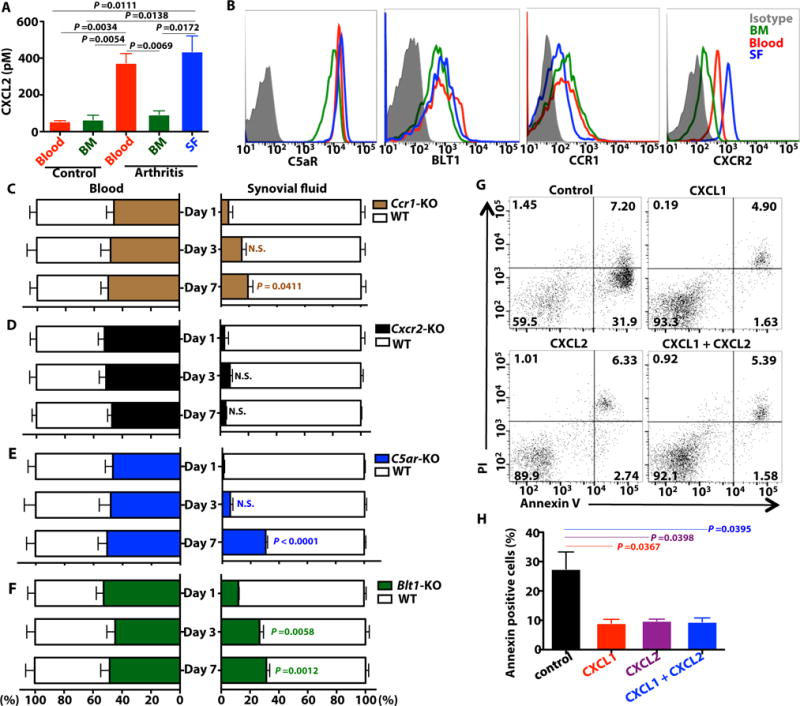
The deposition of immune complexes (IC) in tissues induces a "type III hypersensitivity" that results in tissue damage and underlies the pathogenesis of many autoimmune diseases. The neutrophil is the first immune cell recruited into sites of IC deposition and plays a critical role in shaping the overall tissue response. However, the mechanism by which IC initiate and propagate neutrophil infiltration into tissue is not known. Here, using intravital multiphoton joint imaging of IC-induced arthritis in live mice, we found that the complement C5a receptor (C5aR) was the key initiator of neutrophil adhesion on joint endothelium. C5a presented on joint endothelium induced β2 integrin-dependent neutrophil arrest, facilitating neutrophil spreading and transition to crawling, and subsequent leukotriene B4 receptor (BLT1)-mediated extravasation of the first neutrophils. The chemokine receptor CCR1 promoted neutrophil crawling on the joint endothelium while CXCR2 amplified late neutrophil recruitment and survival once in the joint. Thus, imaging arthritis has defined a new paradigm for type III hypersensitivity where C5a directly initiates neutrophil adhesion on the joint endothelium igniting inflammation.


Conflict of interest statement

Competing interests: The authors declare no competing financial interests.

Figures

Figure 1
Figure 1. In vivo imaging of inflammatory arthritis in live mice
(A) Clinical arthritis score of WT and CAR-KO mice on day 7 after arthritogenic serum transfer (AST). (B–I) In vivo imaging of the joint in live mice. Data are representative of 3 independent experiments. (B) WT-LysM-GFP no AST. (C–I) WT or CAR-KO-LysM-GFP mice on day 7 following AST. (C) WT, (D) C5ar-KO, (E) Blt1-KO, (F) Alox-5-KO (G) Ccr1-KO (H) Cxcr2-KO and (I) Ccr1-Cxcr2-DKO mice. GFP: neutrophils; Blue: Connective tissue; Qdots: Blood vessels. Time in mins:secs. Scale bars represent 50 μm. (J) Number of newly adherent cells, and (K) newly extravasated cells in the joints during 30-min recording. Data indicate mean ± SEM. n = 3 mice/group and P valve calculated using unpaired two-tails Student’s t-test
Figure 2
Figure 2. In vivo imaging WT and CAR-KO neutrophils co-adoptively transferred into arthritic WT mice
(A) Schematic of neutrophil migration cascade. (B–F) In vivo imaging of the joint after co-adoptive transfer of WT-Actin-RFP and CAR-KO-Actin-GFP purified neutrophils into WT mice that received AST 7 days prior. Data are representative of 3 independent experiments. (B) WT and C5ar-KO, (C) WT and Blt1-KO (D), WT and Ccr1-KO (E), WT and Cxcr2-KO and (F) WT and Ccr1-Cxcr2-DKO neutrophils. GFP: CAR-KO neutrophils; RFP: WT neutrophil; Blue: connective tissue; Qdots: Blood vessels. Scale bars represent 50 μm. Time in hrs:mins. Green arrows shows extravasated CAR-KO neutrophils, and red arrows show extravasated WT neutrophils. (G–I) Quantitation of the number of new (G) arrested, (H) crawling, and (I) extravasated neutrophils; in the joint during the 120 min observed. Data indicate mean ± SEM. n = 3 mice/group, P value calculated using unpaired two-tails Student’s t-test. N.S.- not statistically significant.
Figure 3
Figure 3. In vivo imaging joints of mixed bone marrow chimeric mice on day 7 after AST
(A) Clinical arthritis score on day 7 after AST. (B–E) Representative images the joint of mixed BMC mice on day 7 after AST. Mixed BMC mice were generated by the transfer of WT-Actin-RFP- and CAR-KO-Actin-GFP BM (1:1 ratio) into irradiated WT mice. While leukocytes other than neutrophils were fluorescently labeled in these experiments, neutrophils were easily identified by their size, shape and migratory properties. Data are representative of 3 independent experiments. (B) C5ar-KO-Actin-GFP and WT-Actin-RFP BM cells transferred into WT mice. (C) Blt1-KO-Actin-GFP and WT-Actin-RFP BM cells transferred into WT mice. (D) Ccr1-KO-Actin-GFP and WT-Actin-RFP BM cells transferred into WT mice. (E) Cxcr2-KO-Actin-GFP and WT-Actin-RFP BM cells transferred into WT mice. GFP: CARs-KO-cell, RFP: WT-cell, Blue: Connective tissue, Qdots: Blood vessels. Time in mins:secs. Scale bars represent 50 μm. (F, G) Quantitation of sticking cells and extravasated cells in the joint. (A, F, G) Data indicate mean ± SEM. n = 3 mice/group, P value calculated using unpaired two-tails Student’s t-test. N.S.- not statistically significant.
Figure 4
Figure 4. C5aR and CCR1 mediate interactions of neutrophils with the joint endothelium at different stages of the adhesion cascade
(A) Shape of WT and CAR-KO neutrophils 5 min after arrest. Broken white line outlines the shape of the neutrophils. Scale bars represent 10 μm. (B) Circularity of WT and CAR-KO neutrophils 5 mins after arrest. Data indicate mean ± SEM; n= 10 cells/genotype (C–G) In vivo joint imaging after adoptive transfer of WT-Actin-RFP and CAR-KO-Actin-GFP neutrophils into WT mice that received AST 7 days prior. Blue: Connective tissue; Qdots: Blood vessels. (C) WT and C5ar-KO neutrophils. Blue arrows indicate arrested cells that detached. Time in mins:secs. Scale bars represent 10 μm. Data are representative of 3 independent experiments. (D) Quantitation of arrested cell that detached from the joint endothelium over 120 mins observation. (E) WT and Ccr1-KO and (F) WT and Ccr1-Cxcr2-DKO neutrophils. Green arrow indicates crawling cells that detach. Green broken line indicates the track of a mobile cell. Time in mins:secs. Scale bars represent 10 μm. (G) Quantitation of crawling cells that detach from the joint endothelium over 120 mins of observation (C,E, F) Data are representative of 3 independent experiments. (D, G) Data indicate mean ± SEM; n = 3 mice/group; P value calculated using unpaired two-tails Student’s t-test. N.S.- not statistically significant.
Figure 5
Figure 5. C5a expression and binding in the inflamed joint
(A) Levels of CAs in SF on days 0, 1, 3 and 7 following AST as determined by ELISA. n = 3 mice/time point (B–E) Immunofluorescence staining of joint tissue from arthritic mice on day 7 after AST (B, D) or control mice (C, E). Red: C5a; Green: VWF+ECs; Blue: DAPI. Scale bars =50μm. Data are representative of 3 independent experiments. (F) In vitro binding assay. Amount of C5a bound to uncoated 96well assay plates or plates coated with HSPG (5μg/ml) in the presence or absence of heparin (80μg/ml) (G) In vitro adhesion assay. Number of BM neutrophils adherent to murine aortic endothelial cells that were pretreated with C5a (1nM) in the presence or absence of heparin (80μg/ml) (F,G) n = 3 independent experiments. Data indicate mean ± SEM; P value calculated using unpaired two-tails Student’s t-test. N.S.- not statistically significant.
Figure 6
Figure 6. In vivo joint adhesion assay
(A–F) In vivo joint imaging of WT-LysM-GFP mice following exposure to CAs (n = 3). (A) Control (B) CXCL1 (C) CXCL2 (D) CCL3 (E) C5a and (F) LTB4. GFP: neutrophils; Blue: Connective tissue; Qdots: Blood vessels. Time in mins:secs. Scale bars represent 50 μm. Images are representative from 3 independent experiments. (G) Number of newly adherent cells and (H) newly extravasated in the joints over the 30-min observation after the application of the CA (1nM). (G, H) Data indicate mean ± SEM.; n = 3 mice/group; P value calculated using unpaired two-tails Student’s t-test.
Figure 7
Figure 7. β2 integrin activation mediates C5a-induced neutrophil adhesion to the joint endothelium
(A) In vitro adhesion of C5a (1 nM) activated WT neutrophils to ICAM-1 coated plates in presence of β2 integrin blocking mAbs or an isotype control mAb. n = 3 independent experiments. Data indicate mean ± SEM; P value calculated using unpaired two-tails Student’s t-test. (B–F) In vivo imaging of joints in WT-LysM-GFP mice that were pretreated for 4 hrs with β2 integrin blocking mAbs or an isotype control mAb following exposure to C5a (1nM). (B) Control Ab, (C) LFA-1 Ab, (D) Mac-1 Ab (E) LFA-1 and Mac-1 Ab treated mice. Green: neutrophils; Blue: Connective tissue; Qdots: Blood vessels. Scale bars represent 50 μm. Time in mins:secs. Data are representative of 3 independent experiments. (F) Number of newly adherent cells on the joint endothelium over the 30 mins of observation. (G–I) Neutrophil detachment in vivo. (G) LFA-1 Ab, (H) Both LFA-1 and Mac-1 Ab treated mice. Green: neutrophils; Blue: Connective tissue; Qdots: Blood vessels. Green arrows indicate crawling cells that detached and blue arrows indicate arrested cells that detach. Time in mins:secs. Scale bars represent 10 μm. Data are representative of 3 independent experiments. (I) Number of newly adherent cells that detach over the 30 mins of observation. Striped bar indicates arrested cells that detach and closed bar indicates crawling cells that detach of the total number of adherent cells that detach. (F, I) n = 3 mice/group. Data indicate mean ± SEM; P value calculated using unpaired two-tails Student’s t-test.
Figure 8
Figure 8. CXCR2 propagates neutrophil recruitment and survival in the joint
(A) Quantitation of CXCL2 produced by neutrophils isolated from the BM, blood and SF of WT control and arthritic mice (day 7 following AST). n = 3 mice/group. (B) Surface protein CAR expression on neutrophils isolated from the BM, blood and SF of arthritic mice by flow cytometry. Data are representative of 3 independent experiments. (C–F) Neutrophils were isolated from blood and SF of mixed BMC mice on day 1, 3 and 7 after AST. WT and (C) Ccr1-KO, (D) Cxr2-KO, (E) C5ar-KO and (F) Blt1-KO neutrophil in blood and SF were analyzed by flow cytometry. n = 3 independent experiments/time point. (G, H) Neutrophils were isolated from SF of WT mice on day 7 after AST and incubated with CXCL1 (1nM) and/or CXCL2 (1nM) for 48 hrs. Neutrophil survival was assessed by flow cytometry using Annexin+ (apoptosis) and PI+ (necrosis) (G) and Annexin+ cells quantitated (H) n = 3 independent experiments. (A, C–F, H) Data indicate mean ± SEM; P value calculated using unpaired two-tails Student’s t-test, N.S.- not statistically significant.

Similar articles

Cited by

References

    1. Mayadas TN, Tsokos GC, Tsuboi N. Mechanisms of immune complex-mediated neutrophil recruitment and tissue injury. Circulation. 2009;120:2012–2024. - PMC - PubMed
    1. Sylvestre D, Clynes R, Ma M, Warren H, Carroll MC, Ravetch JV. Immunoglobulin G-mediated inflammatory responses develop normally in complement-deficient mice. J Exp Med. 1996;184:2385–2392. - PMC - PubMed
    1. Sylvestre DL, Ravetch JV. A dominant role for mast cell Fc receptors in the Arthus reaction. Immunity. 1996;5:387–390. - PubMed
    1. Sylvestre DL, Ravetch JV. Fc receptors initiate the Arthus reaction: redefining the inflammatory cascade. Science. 1994;265:1095–1098. - PubMed
    1. Stokol T, O’Donnell P, Xiao L, Knight S, Stavrakis G, Botto M, von Andrian UH, Mayadas TN. C1q governs deposition of circulating immune complexes and leukocyte Fcgamma receptors mediate subsequent neutrophil recruitment. J Exp Med. 2004;200:835–846. - PMC - PubMed

LinkOut - more resources