. 2017 May 22:8:15398.
doi: 10.1038/ncomms15398.

pSILAC mass spectrometry reveals ZFP91 as IMiD-dependent substrate of the CRL4CRBN ubiquitin ligase

Affiliations

pSILAC mass spectrometry reveals ZFP91 as IMiD-dependent substrate of the CRL4CRBN ubiquitin ligase

Jian An et al. Nat Commun. .

Abstract

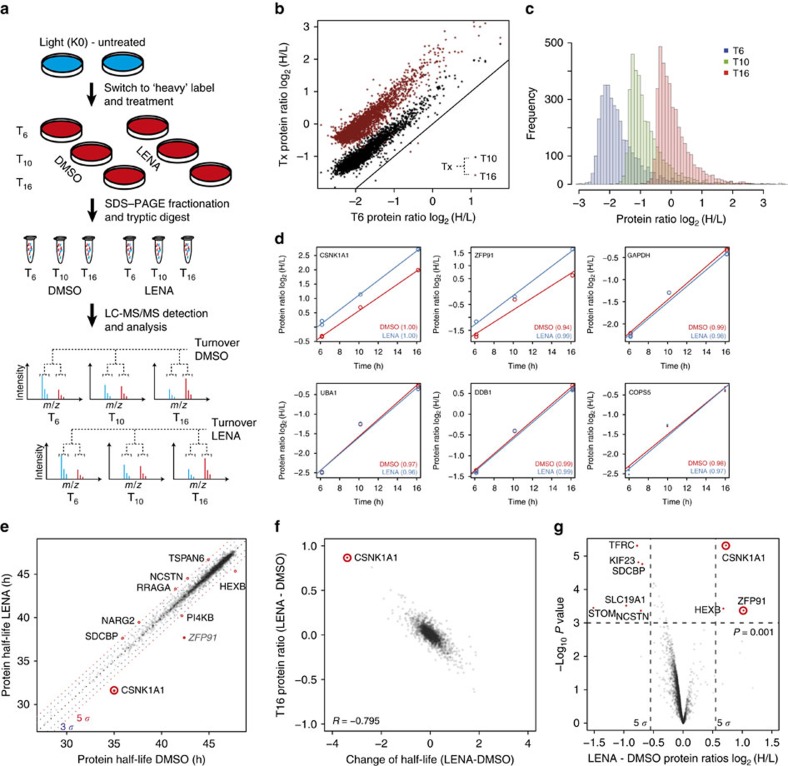
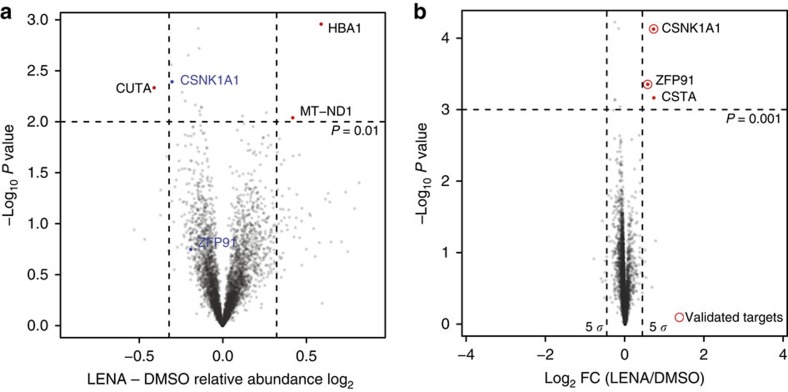
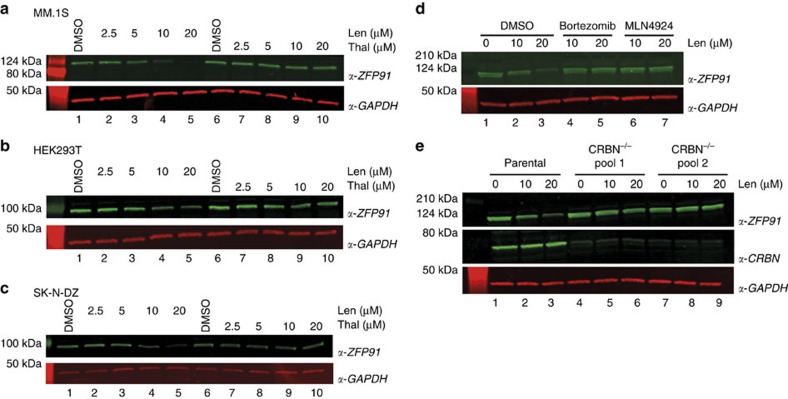
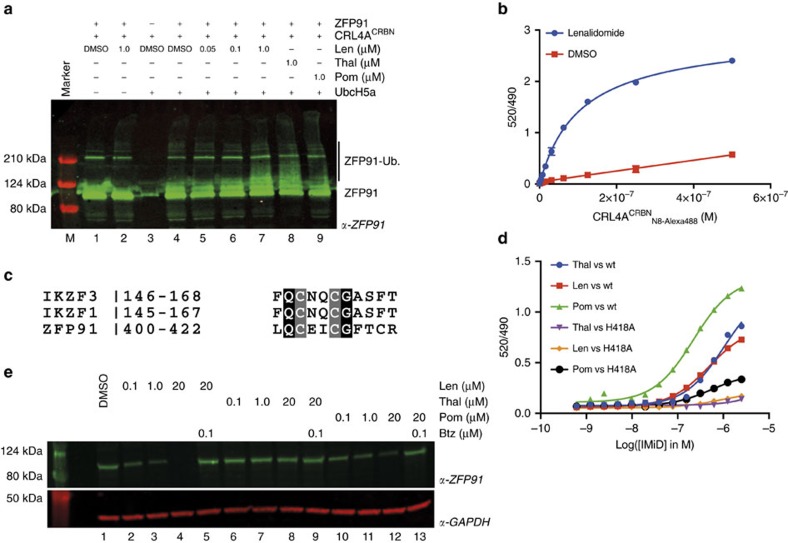
Thalidomide and its derivatives lenalidomide and pomalidomide (IMiDs) are effective treatments of haematologic malignancies. It was shown that IMiDs impart gain-of-function properties to the CUL4-RBX1-DDB1-CRBN (CRL4CRBN) ubiquitin ligase that enable binding, ubiquitination and degradation of key therapeutic targets such as IKZF1, IKZF3 and CSNK1A1. While these substrates have been implicated as efficacy targets in multiple myeloma (MM) and 5q deletion associated myelodysplastic syndrome (del(5q)-MDS), other targets likely exist. Using a pulse-chase SILAC mass spectrometry-based proteomics approach, we demonstrate that lenalidomide induces the ubiquitination and degradation of ZFP91. We establish ZFP91 as a bona fide IMiD-dependent CRL4CRBN substrate and further show that ZFP91 harbours a zinc finger (ZnF) motif, related to the IKZF1/3 ZnF, critical for IMiD-dependent CRBN binding. These findings demonstrate that single time point pulse-chase SILAC mass spectrometry-based proteomics (pSILAC MS) is a sensitive approach for target identification of small molecules inducing selective protein degradation.


Conflict of interest statement

The authors declare no competing financial interests.

Figures

Figure 1
Figure 1. Multi time point pSILAC mass spectrometry.
(a) Outline of the multi time point pulse-SILAC mass spectrometry experimental design. For simplification, replicate and reverse experiments are not depicted in this figure. (b) Scatter plot depicting the change of H/L protein ratios over time. Protein ratios of the 10 and 16 h time points are compared to the 6 h time point. Data in this figure are presented as means of biological replicates for T6 and T16 (n=2) or individual data points for T10 (n=1). (c) Frequencies of H/L protein ratios at different time points (data as in b). (d) Plots depicting the logarithmic H/L protein ratios over time are shown for the two validated targets CSNK1A1 and ZFP91 as well as for control proteins GAPDH, UBA1, DDB1 and CopS5. Differential turnover for CSNK1A1 and ZFP91 is observed, while stable conditions are found for controls. Data in this figure are presented as individual data points and separate r2 values for the linear regression are provided for lenalidomide and DMSO samples. (e) Scatter plot comparing protein half-lives of lenalidomide treated and control samples. Protein half-lives were obtained by fitting the H/L protein ratios of T6 (n=2), T10 reverse (n=1) and T16 (n=2) time points to a decay function. For further analysis, we retained only proteins quantified in all samples and with r2>0.9 for both linear regression fits (DMSO and lenalidomide treated), resulting in a total of 2,759 proteins. CSNK1A1 was found to exhibit a reduced half-life in presence of lenalidomide. Blue and red dotted lines indicate ±3 and ±5 s.d., respectively. ZFP91 was dropped from the data analysis for missing values in two replicate measurements. The depicted delta-half-life for ZFP91 is calculated using imputed values from replicates to replace the missing values. (f) Scatter plot depicting the negative correlation between differences in protein half-life (data as in e), and differences in log2 H/L protein ratios at the T16 time point (LENA-DMSO, mean of two biological replicates). R corresponds to the Pearson's correlation coefficient. (g) Fold change in H/L ratios comparing lenalidomide to DMSO control treatment on the x axis (HEK293 T16 SILAC samples). Moderated t-test P values were calculated using the limma package and shown as −log10 values on the y axis. The vertical dashed lines indicate ±5 s.d. log2 fold change in H/L ratio and the horizontal dashed line indicates P value <0.001. Data shown represents two biological replicates.
Figure 2
Figure 2. Single time point pulse-SILAC is sufficient to identify drug targets.
(a) Outline of the single time point pulse-SILAC mass spectrometry and RNA-seq experimental design. (b) Scatter plot depicting substrate candidates identified by comparing the H/L protein ratios of lenalidomide treated to DMSO control cells. Data presented are the means of protein ratios (n=4 biological replicates and R represents the Pearson's correlation coefficient). Only protein groups are shown that were quantified with minimum of three unique peptides in each experiment (3,352). (c) Scatter plot depicting the identification of substrate candidates. Log2 changes in LENA to DMSO H/L protein ratio are shown on the x axis, and log10 sum of MS1 intensities (combined for heavy and light peptides) on the y axis. Significance B was calculated for 10 intensity bins and proteins with Significance B P values <1 × 10⁻⁷ are shown in red. Only protein groups are shown that were quantified with minimum of three unique peptides in each experiment (3,352). (d) Comparison of intronic (x axis) and exonic (y axis) expression changes in lenalidomide treated to DMSO control cells after 16 h (T16, Hct116), identifies three genes with altered transcription, and none with altered post-transcriptional regulation. R indicates the Pearson's correlation coefficient. Data presented are the means of biological replicates (n=4).
Figure 3
Figure 3. Combining multiple data sets can further increase robustness and sensitivity.
(a) Scatter plot depicting the fold change in relative abundance comparing lenalidomide to DMSO control treatment (HEK293 TMT samples). Log2 fold changes are shown on the x axis and negative P values are shown on the y axis. The vertical dashed lines indicate ±0.32 log2 fold change (25% up- or downregulation) and the horizontal dashed line indicates P value <0.01 (n=2 biological replicates). (b) Linear model analysis across all forward samples (multi and single time point experiments) using limma (see Methods section) finds CSNK1A1, CSTA and ZFP91 as most significant hits (P value <0.001). The data are depicted as volcano plot showing differentially stable proteins following treatment with lenalidomide as compared with DMSO. The x axis shows the log2 fold change and the y axis refers to the associated P value (−log10 scale).
Figure 4
Figure 4. Validation of ZFP91 as bona fide lenalidomide-induced CRL4CRBN substrate.
(a) MM.1S cells were treated with increasing concentrations of lenalidomide or with DMSO. Following 24 h of incubation, ZFP91 and GAPDH levels were detected by anti-ZFP91 and anti-GAPDH western blot (shown is one representative experiment out of three replicates). (b) HEK293T cells were treated with 50μg ml−1 cycloheximide and increasing concentrations of lenalidomide, thalidomide or with DMSO, and cells were incubated for 6 h. ZFP91 and GAPDH levels were detected using anti-ZFP91 or anti-GAPDH immunoblotting (shown is one representative experiment out of five replicates). (c) as in (b) but using SK-N-DZ cells instead (shown is one representative experiment out of three replicates). (d) as in (b) but with co-treatment of bortezomib (proteasome inhibitor, lanes 4, 5) or MLN4924 (inhibitor of the NEDD8-activating enzyme, lanes 6,7). Shown is one representative experiment out of three replicates. (e) as in (b) using parental HEK293T (lane 1–3) or two independent pools of HEK293T cells with genetic inactivation of CRBN by CRISPR/Cas9 (shown is one representative experiment out of two replicates).
Figure 5
Figure 5. ZFP91 and IKZF1/3 share a common sequence motif.
(a) In vitro ubiquitination of recombinant ZFP91 by recombinant N8CRL4ACRBN is facilitated by lenalidomide (lanes 5–7), thalidomide (lane 8) and pomalidomide (lane 9). Shown is one representative experiment out of two replicates. (b) Alexa488-N8CRL4ACRBN titrated to biotinylated wild-type ZFP91 at 100 nM in the presence of lenalidomide or DMSO as a control in presence of tracer Tb-streptavidin at 2 nM. Data are presented as means±s.d. (n=3). (c) Multiple sequence alignment of the putative ZFP91, IKZF1 and IKZF3 degron motifs. Identical amino acids, and structural residues of the ZnF motif, are highlighted in black and grey, respectively. (d) Titration of thalidomide, lenalidomide and pomalidomide to Alexa488-N8CRL4ACRBN at 0.2 μM, biotin-ZFP91 at 0.1 μM and Tb-streptavidin at 2 nM. EC50 values are shown and indicate preference for pomalidomide in vitro. Data are presented as individual data points for one representative experiment out of four replicates. (e) MM.1S cells were treated with increasing concentrations of lenalidomide, thalidomide, pomalidomide or a DMSO control for 12 h. Co-treatment with the proteasome inhibitor bortezomib was included as an additional control. ZFP91 and GAPDH levels were detected using anti-ZFP91 or anti-GAPDH immunoblotting (shown is the data for one representative experiment).

References

    1. Komander D. & Rape M. The ubiquitin code. Annu. Rev. Biochem. 81, 203–229 (2012). - PubMed
    1. O'Connell B. C. & Harper J. W. Ubiquitin proteasome system (UPS): what can chromatin do for you? Curr. Opin. Cell Biol. 19, 206–214 (2007). - PubMed
    1. Hershko A. & Ciechanover A. The ubiquitin system. Annu. Rev. Biochem. 67, 425–479 (1998). - PubMed
    1. Deshaies R. J. & Joazeiro C. A. P. RING domain E3 ubiquitin ligases. Annu. Rev. Biochem. 78, 399–434 (2009). - PubMed
    1. Singhal S. et al. Antitumor activity of thalidomide in refractory multiple myeloma. N. Engl. J. Med. 341, 1565–1571 (1999). - PubMed

Publication types

MeSH terms