. 2017 Jun 30;127(7):2586-2597.
doi: 10.1172/JCI90832. Epub 2017 May 22.

Calcium-binding protein S100A4 confers mesenchymal progenitor cell fibrogenicity in idiopathic pulmonary fibrosis

Affiliations

Calcium-binding protein S100A4 confers mesenchymal progenitor cell fibrogenicity in idiopathic pulmonary fibrosis

Hong Xia et al. J Clin Invest. .

Abstract

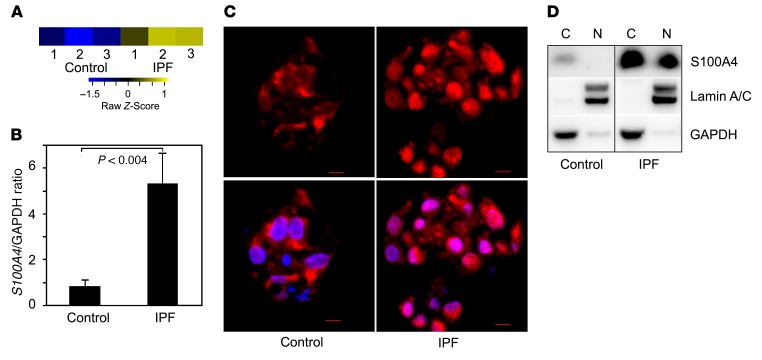
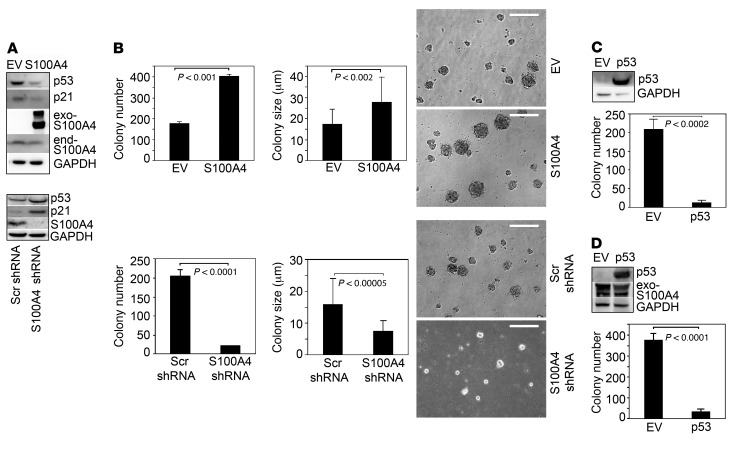
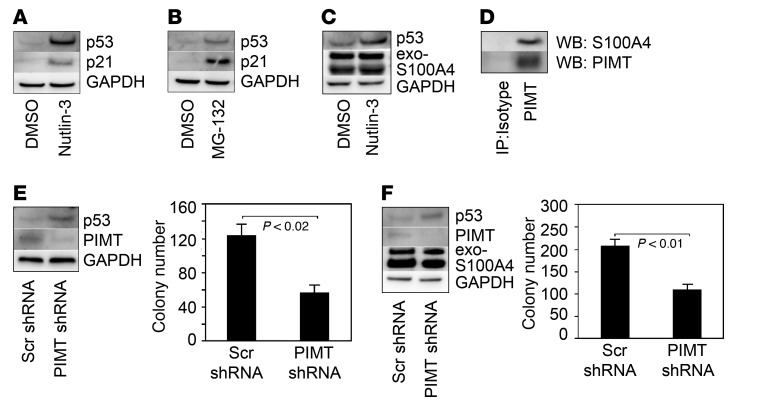
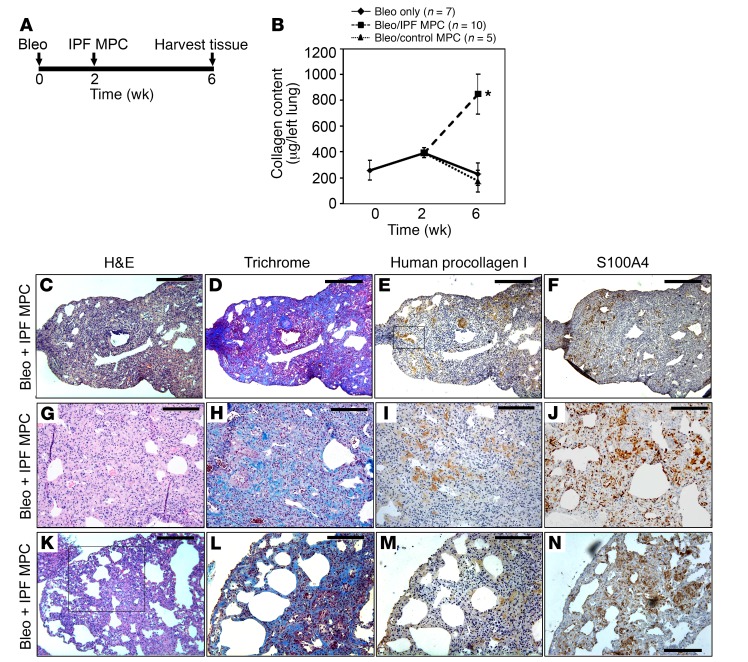
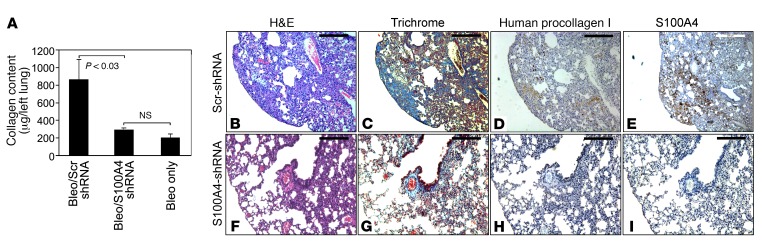
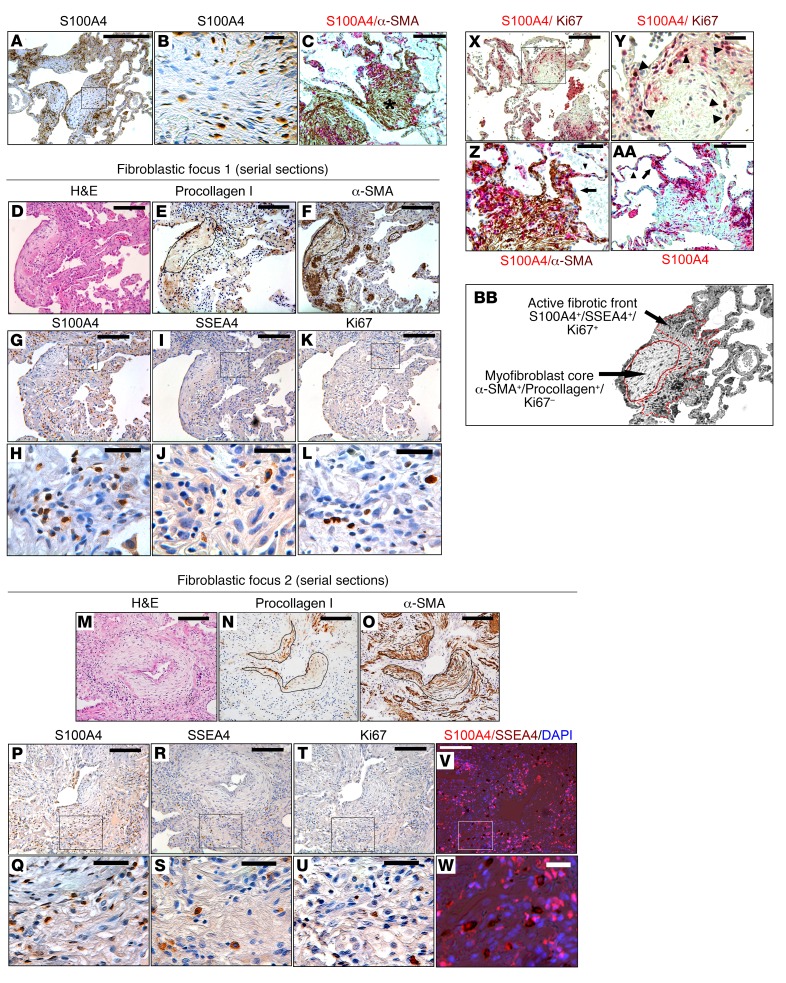
Idiopathic pulmonary fibrosis (IPF) is a progressive disease with a prevalence of 1 million persons worldwide. The fibrosis spreads from affected alveoli into contiguous alveoli and leads to death by asphyxiation. We previously discovered that the IPF lung harbors fibrogenic mesenchymal progenitor cells (MPCs) that serve as a cell of origin for disease-mediating myofibroblasts. In a prior genomewide transcriptional analysis, we found that IPF MPCs displayed increased expression of S100 calcium-binding A4 (S100A4), a protein linked to cancer cell proliferation and invasiveness. Here, we have examined whether S100A4 mediates MPC fibrogenicity. Ex vivo analysis revealed that IPF MPCs had increased levels of nuclear S100A4, which interacts with L-isoaspartyl methyltransferase to promote p53 degradation and MPC self-renewal. In vivo, injection of human IPF MPCs converted a self-limited bleomycin-induced mouse model of lung fibrosis to a model of persistent fibrosis in an S100A4-dependent manner. S100A4 gain of function was sufficient to confer fibrotic properties to non-IPF MPCs. In IPF tissue, fibroblastic foci contained cells expressing Ki67 and the MPC markers SSEA4 and S100A4. The expression colocalized in an interface region between myofibroblasts in the focus core and normal alveolar structures, defining this region as an active fibrotic front. Our findings indicate that IPF MPCs are intrinsically fibrogenic and that S100A4 confers MPCs with fibrogenicity.


Conflict of interest statement

Conflict of interest: The authors have declared that no conflict of interest exists.

Figures

Figure 1
Figure 1. IPF MPCs display increased S100A4, which localizes to the nucleus.
(A) Genome-wide RNA sequencing data. Shown is the heatmap for S100A4 gene expression in IPF and control MPCs derived from 3 IPF patients and 3 control patients based on our previously published data (14). Colors represent per gene Z score (expression difference normalized for standard deviation). (B) Validation testing for S100A4 mRNA expression in IPF and control MPCs. Shown are relative expression levels of each mRNA by qPCR. Data shown represents the mean mRNA levels in IPF MPCs derived from 3 cell lines. (C) Immunocytochemical analysis illustrating S100A4 location in IPF and control colony-forming MPCs (red, S100A4; blue, DAPI; n = 3). Scale bar: 5 μm. (D) Western blot analysis of S100A4 expression in nuclear (N) and cytoplasmic (C) fractions of IPF and control MPCs. Lamin A/C and GAPDH were used as loading controls. Data are expressed as mean ± SEM. P value in B was determined by 2-tailed Student’s t test.
Figure 2
Figure 2. S100A4 regulates IPF MPC self-renewal.
(A) IPF MPCs were infected with lentiviral vector containing WT S100A4 (S100A4) or empty vector (EV; top panel) or S100A4 shRNA or scrambled (Scr) shRNA (bottom panel) to achieve gain or loss of function. p53, p21, and S100A4 expression were quantified by Western blot analysis. GAPDH was used as loading control. Exo-S100A4, exogenous S100A4; end-S100A4, endogenous S100A4. (B) IPF MPCs were infected with a lentiviral vector containing WT S100A4 (S100A4) or empty vector control (EV) or S100A4 shRNA or scrambled (Scr) shRNA. Five-thousand cells were seeded per well in 24-well dishes containing methylcellulose, and they were cultured for 7 days (n = 3). Left panels: colony number was quantified by enumeration. Middle and right panels: graphs depicting colony size and phase contrast image of IPF MPC colony formation, respectively. Scale bar: 50 μm. (C) IPF MPCs were infected with an adenoviral vector containing WT p53 (p53) or empty vector (EV) and cultured in methylcellulose for 7 days. Left panel: Western blot analysis was performed to assess p53 protein expression. Right panel: colony number was quantified by enumeration (n = 3). (D) IPF MPCs overexpressing S100A4 were infected with an adenoviral vector containing WT p53 (p53) or empty vector control (EV). Left panel: Western blot analysis was performed to assess p53 protein expression. GAPDH was used as a loading control. Right panel: colony number was quantified by enumeration (n = 3). The data were replicated using MPCs isolated from an independent primary mesenchymal cell line. Data are expressed as mean ± SEM. P values in BD were determined by 2-tailed Student’s t test.
Figure 3
Figure 3. S100A4 promotes p53 degradation via the proteasome and its interaction with PIMT.
(A and B) IPF MPCs were treated with 10 μM nutlin-3, 5 μM MG-132, or DMSO control for 4 hours. The cells were harvested, and Western blot analysis was performed to quantify p53 and p21 levels. GAPDH was used as a loading control. (C) IPF MPCs overexpressing WT S100A4 were treated with 10 μM nutlin-3 (DMSO served as control) for 4 hours, and Western blot analyses for p53 and S1000A4 expression were performed. (D) PIMT was immunoprecipitated (IP) from IPF MPC cell lysates and Western blot (WB) analysis for S100A4 and PIMT was performed. Lane 1: IP using isotype control antibody. Lane 2: IP using PIMT antibody. (E) PIMT was knocked down in IPF MPCs using PIMT shRNA. Scrambled shRNA served as control. The cells were placed in methylcellulose and cultured for 7 days. Left panel: p53 and PIMT expression were quantified by Western blot analysis. Right panel: colony number was quantified by enumeration (n = 3). (F) S100A4 was first overexpressed in IPF MPCs using a lentiviral vector containing a WT S100A4 construct. PIMT was then knocked down using PIMT shRNA. Cells treated with scrambled shRNA served as control. The cells were placed in methylcellulose and cultured for 7 days. Left panel: p53, PIMT, and S100A4 expression were quantified by Western blot analysis. Right panel: colony number was quantified by enumeration (n = 3). The data were replicated using MPCs isolated from an independent primary mesenchymal cell line. Data are expressed as mean ± SEM. P values in E and F were determined by 2-tailed Student’s t test.
Figure 4
Figure 4. Human IPF MPCs convert the bleomycin model of lung fibrosis from a self-limited model to a model of persistent fibrosis.
(A) Schematic displaying timeline of mouse treatment protocol. (B) Three groups of immune-compromised mice were administered intratracheal bleomycin. In one group of mice (“bleo only”, n = 7), lungs were harvested at 2 and 6 weeks following bleomycin. In 2 groups of mice, 1 × 10⁶ IPF MPCs (n = 10 mice) or control MPCs (n = 5 mice) were injected via tail vein 2 weeks after bleomycin. Four weeks after administration of cells, lungs were harvested. Collagen content was quantified in left lungs by Sircol assay (data shown are aggregated from studies done using 2 independent IPF and control MPC lines). Data are expressed as mean ± SEM. *P < 0.01, by 2-tailed Student’s t test. (CN) Serial 4-μm sections of right-lung tissue from mice receiving bleomycin followed by IPF MPCs. (C and D) Representative H&E and Trichrome stains assessing fibrosis and collagen distribution, respectively. Scale bar: 200 μm. (E and F) IHC using an antibody recognizing human procollagen to identify human cells and assess collagen synthesis (E) and an S100A4 antibody to assess the distribution of S100A4 and human procollagen–expressing cells (F). Boxed area in E showing procollagen+ human cells forming a fibrotic lesion obliterating an airspace. Scale bar: 200 μm. (GJ) Higher-power images demonstrating regions with new collagen deposition (G and H) heavily infiltrated with human cells expressing procollagen and cells expressing S100A4 (I and J). Scale bar: 100 μm. (K) Morphological analysis demonstrated the presence of peripheral fibrosis with cystic areas. Scale bar: 200 μm. (LN) Trichrome stain (L) and IHC (M and N) of boxed region in K showing cystic change with heavy infiltration of procollagen+ human IPF MPCs codistributed with S100A4-expressing cells in fibrotic lesions. Scale bar: 100 μm.
Figure 5
Figure 5. S100A4 is necessary for MPCs to worsen fibrosis in vivo.
(AI) Immune-compromised mice were administered intratracheal bleomycin (1.25 U/kg) to establish lung fibrosis. Two weeks later, IPF MPCs (1 × 10⁶ cells) were infected with a lentiviral vector containing S100A4 shRNA or scrambled shRNA and injected via tail vein into the mice (n = 5/group). Four weeks after administration of cells, the lungs were harvested. (A) Collagen content in left lungs quantified by Sircol assay. Data are expressed as mean ± SEM. P < 0.03 determined by 2-tailed Student’s t test. (BI). Serial 4-μm sections of right-lung tissue from mice receiving IPF MPCs treated with scrambled shRNA (BE; scale bar: 200 μm) and S100A4 shRNA (FI; scale bar: 100 μm). (B, C, F, and G) Shown are representative H&E and trichrome stains to assess fibrosis and collagen distribution in right-lung tissue. (D and H) IHC was performed using an antibody that recognizes human procollagen to identify human cells and assess collagen synthesis. (E and I) IHC was also performed using an S100A4 antibody to assess distribution of S100A4 expression with human procollagen expression.
Figure 6
Figure 6. The IPF fibroblastic focus is a polarized structure.
IHC was performed on human IPF lung tissue (n = 10). (A) IHC showing distribution of S100A4 expression in fibroblastic foci. Scale bar: 200 μm. (B) Higher-power image of boxed region in A. Scale bar: 20 μm. (C) Double stain for S100A4 (red) and α-SMA (brown) defining the distribution of S100A4- and α-SMA–expressing cells in the fibroblastic focus. Asterisk, myofibroblast core. Scale bar: 50 μm. (DW) Serial 4-μm sections of 2 representative fibroblastic foci. (DF and MO) H&E (D and M), procollagen (E and N), and α-SMA (F and O) staining of the focus. Scale bar: 100 μm. Outline in E, F, N, and O delineate the focus core. (GL and PU) IHC for S100A4 (G, H, P, and Q), SSEA4 (I, J, R, and S), and Ki67 (K, L, T, and U). (G, I, K, P, R, and T). Scale bar: 100 μm. (H, J, L, Q, S, and U) Higher-power images of boxed regions in G, I, K, P, R, and T. Scale bar: 20 μm. (V and W) Low- and high-power images showing IHC for SSEA4 (brown) overlaid with immunofluorescence for S100A4 (red). Nuclei are stained with DAPI. Scale bar: 100 μm (V) and 20 μm (W). (X) Double stain for S100A4 (red) and Ki67 (nuclear brown signal). Scale bar: 100 μm. (Y) Higher-power image of boxed region in X. Arrowheads denote individual cells positive for both S100A4 and Ki67. Scale bar: 20 μm. (Z and AA) IHC staining of fibroblastic foci for S100A4 (red). Z is a higher power image of C. Arrow denotes thickened alveolar walls. Arrowhead denotes normal thin alveolar walls. Scale bar: 20 (Z) and 50 (AA) μm. (BB) Higher-power image of A depicting the active fibrotic front and myofibroblast core of the polarized fibroblastic focus (100×).

References

    1. Raghu G, Weycker D, Edelsberg J, Bradford WZ, Oster G. Incidence and prevalence of idiopathic pulmonary fibrosis. Am J Respir Crit Care Med. 2006;174(7):810–816. doi: 10.1164/rccm.200602-163OC. - DOI - PubMed
    1. Noble PW. Idiopathic pulmonary fibrosis: natural history and prognosis. Clin Chest Med. 2006;27(1 Suppl 1):S11–S16. - PubMed
    1. Kim DS, Collard HR, King TE. Classification and natural history of the idiopathic interstitial pneumonias. Proc Am Thorac Soc. 2006;3(4):285–292. doi: 10.1513/pats.200601-005TK. - DOI - PMC - PubMed
    1. Kuhn C, McDonald JA. The roles of the myofibroblast in idiopathic pulmonary fibrosis. Ultrastructural and immunohistochemical features of sites of active extracellular matrix synthesis. Am J Pathol. 1991;138(5):1257–1265. - PMC - PubMed
    1. Nishimura K, Kitaichi M, Izumi T, Nagai S, Kanaoka M, Itoh H. Usual interstitial pneumonia: histologic correlation with high-resolution CT. Radiology. 1992;182(2):337–342. doi: 10.1148/radiology.182.2.1732946. - DOI - PubMed

MeSH terms

Substances