. 2017 Jun 30;127(7):2555-2568.
doi: 10.1172/JCI89935. Epub 2017 May 22.

MYC-dependent oxidative metabolism regulates osteoclastogenesis via nuclear receptor ERRα

Affiliations

MYC-dependent oxidative metabolism regulates osteoclastogenesis via nuclear receptor ERRα

Seyeon Bae et al. J Clin Invest. .

Abstract

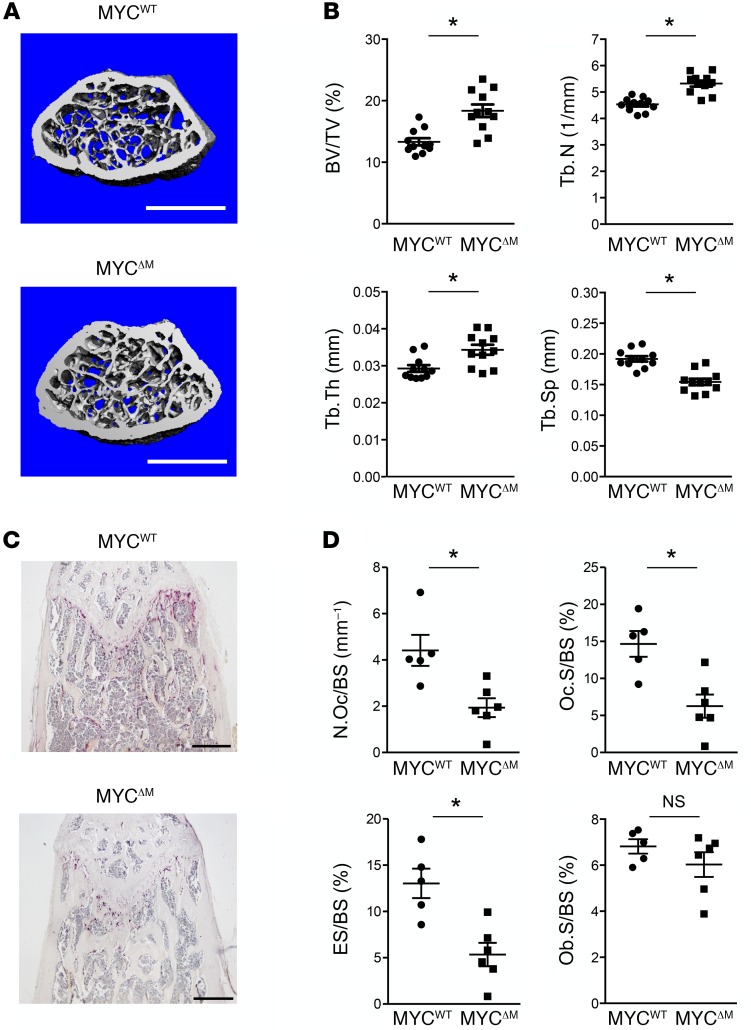
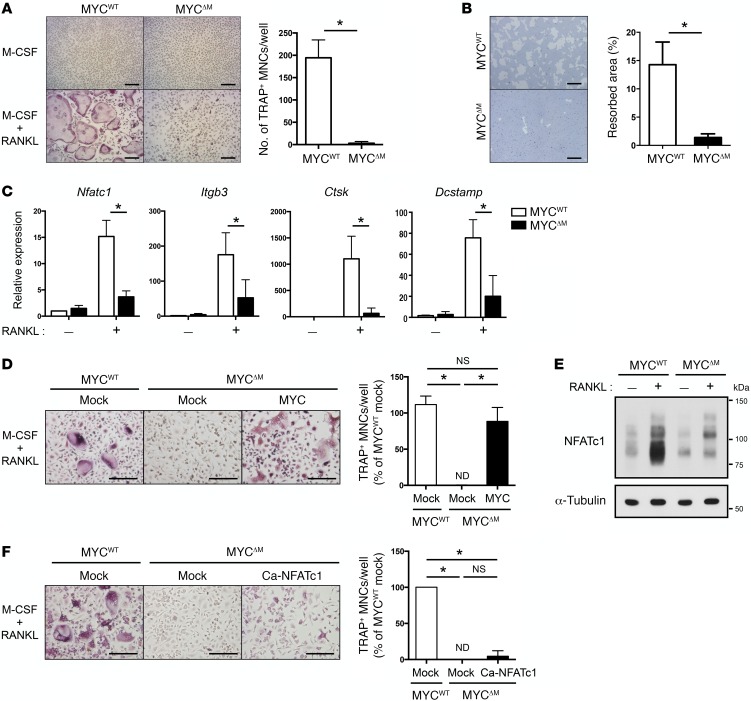
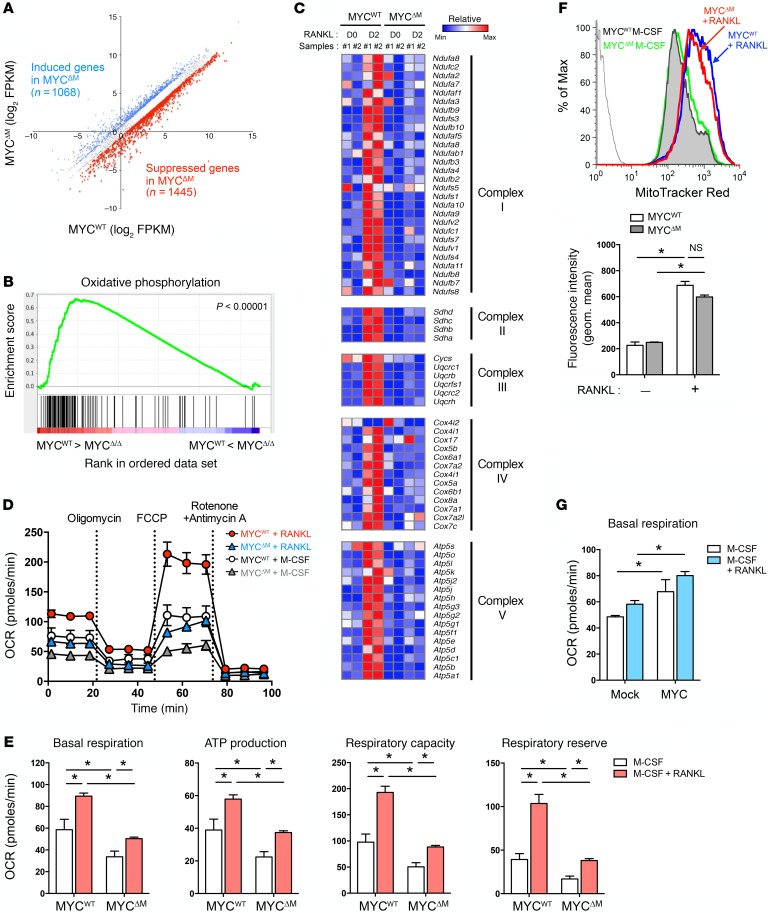
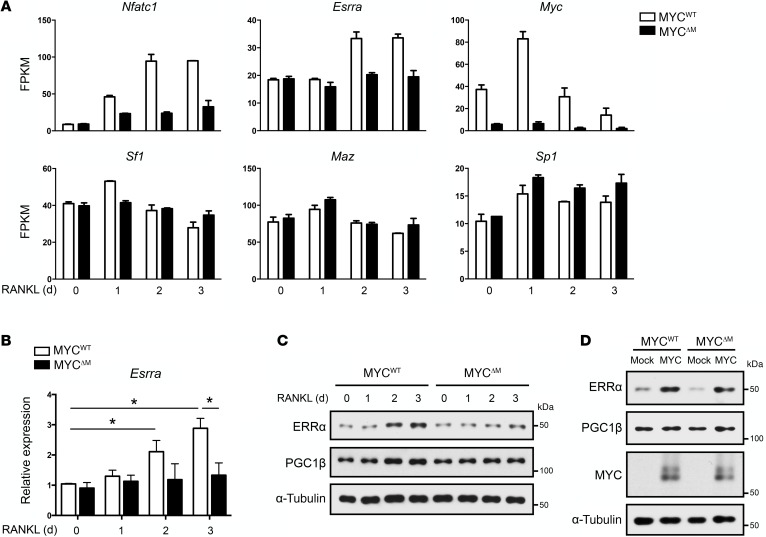
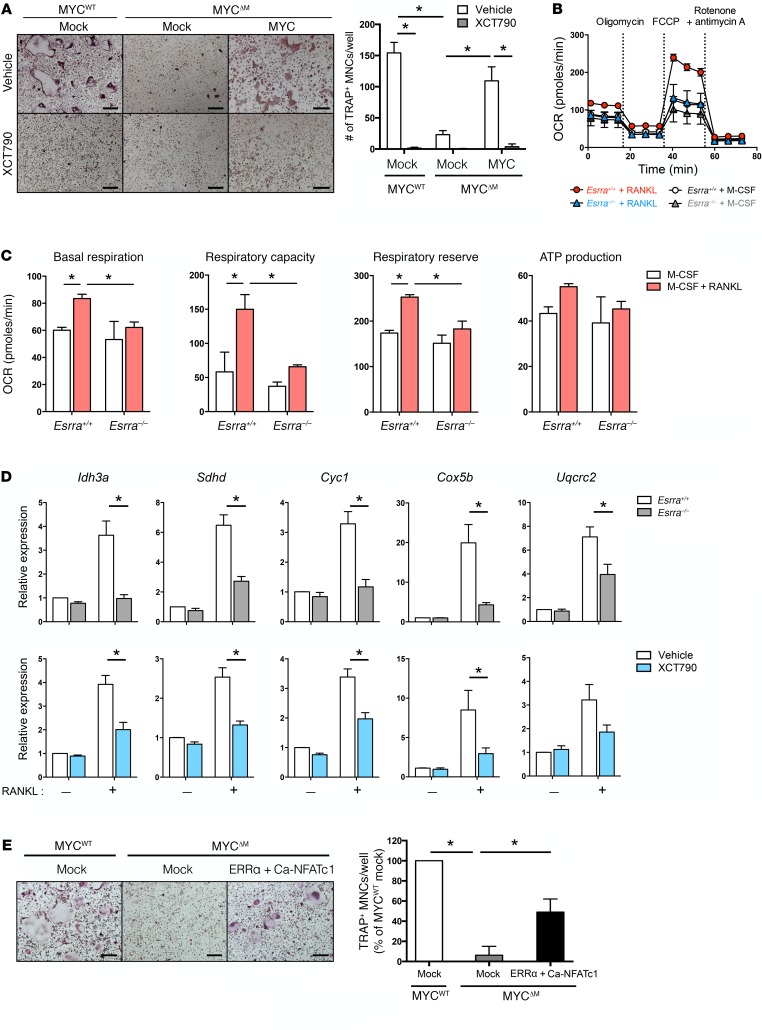
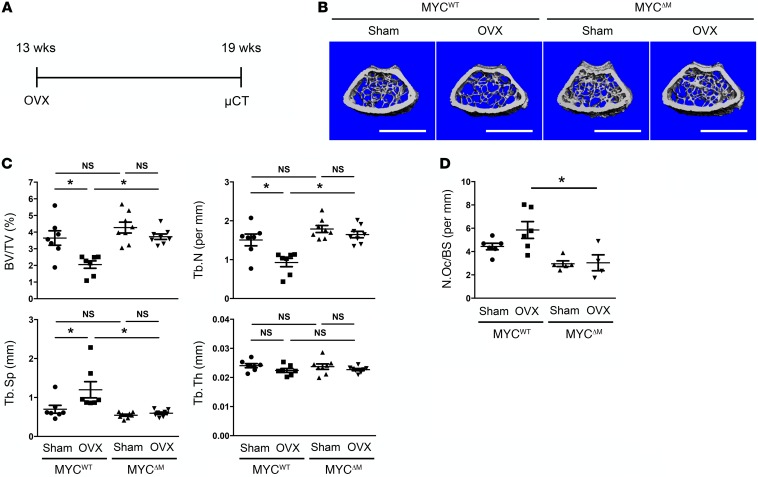
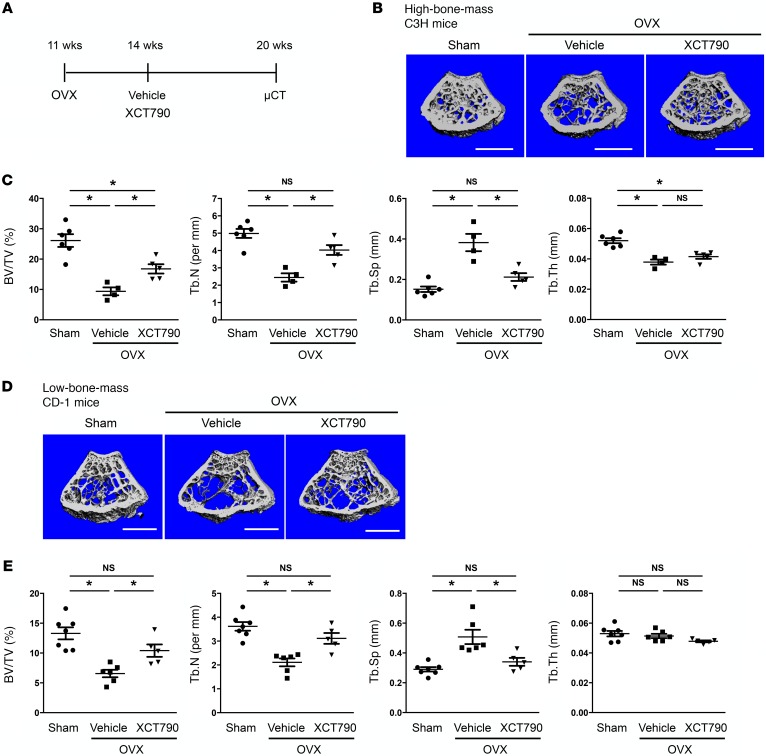
Osteoporosis is a metabolic bone disorder associated with compromised bone strength and an increased risk of fracture. Inhibition of the differentiation of bone-resorbing osteoclasts is an effective strategy for the treatment of osteoporosis. Prior work by our laboratory and others has shown that MYC promotes osteoclastogenesis in vitro, but the underlying mechanisms are not well understood. In addition, the in vivo importance of osteoclast-expressed MYC in physiological and pathological bone loss is not known. Here, we have demonstrated that deletion of Myc in osteoclasts increases bone mass and protects mice from ovariectomy-induced (OVX-induced) osteoporosis. Transcriptomic analysis revealed that MYC drives metabolic reprogramming during osteoclast differentiation and functions as a metabolic switch to an oxidative state. We identified a role for MYC action in the transcriptional induction of estrogen receptor-related receptor α (ERRα), a nuclear receptor that cooperates with the transcription factor nuclear factor of activated T cells, c1 (NFATc1) to drive osteoclastogenesis. Accordingly, pharmacological inhibition of ERRα attenuated OVX-induced bone loss in mice. Our findings highlight a MYC/ERRα pathway that contributes to physiological and pathological bone loss by integrating the MYC/ERRα axis to drive metabolic reprogramming during osteoclast differentiation.


Conflict of interest statement

Conflict of interest: The authors have declared that no conflict of interest exists.

Figures

Figure 1
Figure 1. Myeloid-specific MYC-deficient mice have high bone mass.
(A and B) μCT analysis of femurs from 12-week-old male MYCΔM and littermate control MYCWT mice (n = 11 per group). (A) Representative images show trabecular architecture by μCT reconstruction in the distal femurs. Scale bars: 1 mm. (B) μCT measurements for the indicated parameters in distal femurs. Bone volume/tissue volume ratio (BV/TV), trabecular numbers (Tb.N), trabecular thickness (Tb.Th ), and trabecular space (Tb.Sp) were determined by μCT analysis. (C and D) Histomorphometric analysis of femurs from 12-week-old male MYCΔM and MYCWT mice (n ≥5). (C) Representative images showing TRAP-positive, multinucleated osteoclasts (red). Scale bars: 200 μm. (D) Plots show the number of osteoclasts per bone surface (N.Oc/BS), osteoclast surface area per bone surface (Oc.S/BS), eroded surface per bone surface (ES/BS), and osteoblast surface area per bone surface (Ob.S/BS). All data are shown as the mean ± SEM. *P < 0.05, by 2-tailed, unpaired t test in B and D.
Figure 2
Figure 2. MYC is important for osteoclast differentiation and resorption.
(A) Representative images show osteoclast differentiation in control (MYCWT) and MYC-deficient (MYCΔM) OCPs stimulated with RANKL (50 ng/ml). Scale bars: 200 μm. Graph depicts the number of TRAP-positive multinucleated cells (MNCs) counted in triplicate from 5 independent experiments. (B) Representative images show bone resorption activity of MYCWT and MYCΔM OCPs stimulated with RANKL. Scale bars: 200 μm. Graph depicts the percentage of resorbed pit area per total area from at least 3 experiments. (C) Expression of osteoclast-related genes (relative to the Hprt housekeeping gene) on day 3 after RANKL stimulation (n = 8). (D) Osteoclast differentiation in mock-infected or MYC-transduced MYC-deficient OCPs stimulated with RANKL (50 ng/ml). Representative images of TRAP-stained cells are shown. Scale bars: 200 μm. Graph shows the number of TRAP-positive MNCs counted in triplicate from at least 4 experiments. (E) Immunoblot of whole-cell lysates using NFATc1 and α-tubulin antibodies. α-Tubulin served as a loading control. Data are representative of 3 experiments. (F) Osteoclast differentiation in mock-infected or Ca-NFATc1–transduced MYC-deficient OCPs. Representative images of TRAP-stained cells are shown. Scale bars: 200 μm. Graph shows the number of TRAP-positive MNCs counted in triplicate from at least 3 experiments. All data are shown as the mean ± SEM. *P < 0.05, by 2-tailed, unpaired t test (A and B); 2-way ANOVA with Tukey’s post-hoc test (C); 1-way ANOVA with Tukey’s post-hoc test (D and F). ND, not detected.
Figure 3
Figure 3. MYC deficiency impairs mitochondrial respiration during osteoclast differentiation.
Control (MYCWT) and MYC-deficient (MYCΔM) OCPs were stimulated with RANKL (50 ng/ml) for 2 days. (A) Scatterplot of global gene expression profiles of MYCWT and MYCΔM OCPs derived from RNA-seq analysis. (B) GSEA of RANKL-stimulated MYCΔM OCPs, with genes ranked on the basis of expression in MYCΔM OCPs relative to that in MYCWT OCPs, showing the distribution of genes in the oxidative phosphorylation gene set against the ranked list of the genes from the RNA-seq analysis. (C) Heatmap of RNA-seq FPKM values for genes involved in oxidative phosphorylation in MYCWT and MYCΔM OCPs following RANKL stimulation for 2 days. RNA-seq data from 2 biological replicates were used. D0, day 0 without RANKL stimulation; D2, day 2 following RANKL stimulation; Min, minimum; Max, maximum. (D and E) Mitochondrial function was assessed by real-time OCR measurement after sequential treatment of compounds modulating mitochondrial function. The OCR was normalized to the relative amount of DNA. (D) Representative time course data. (E) Assessment of mitochondrial activity as described in Supplemental Figure 9 (n = 3). (F) Measurements of mitochondrial mass using MitoTracker Red with flow cytometry (n = 3). (G) The basal OCR was measured with mock-infected or MYC-transduced MYC-deficient OCPs stimulated with RANKL (50 ng/ml) for 2 days (n = 3). All data are shown as the mean ± SEM. *P < 0.05, by 2-way ANOVA with Tukey’s post-hoc test.
Figure 4
Figure 4. MYC regulates ERRα expression in osteoclastogenesis.
(A) RNA-seq FPKM values for Nfatc1, Esrra, Myc, Sf1, Maz, and Sp1 in control (MYCWT) and MYC-deficient (MYCΔM) OCPs during osteoclast differentiation. RNA-seq data from 2 biological replicates are shown, and the level of each gene expression in each sample was normalized by means of FPKM. Data are shown as the mean ± SEM. (B and C) Expression of ERRα in MYCWT and MYCΔM OCPs during osteoclastogenesis. (B) mRNA expression of Esrra (relative to the Hprt housekeeping gene), as measured by real-time quantitative PCR (n = 6). Data are shown as the mean ± SEM. *P < 0.05, by 2-way ANOVA with Tukey’s post-hoc test. (C) Protein expression of ERRα and PGC1β, as determined by immunoblotting. Data are representative of 3 experiments. (D) Effect of MYC overexpression on ERRα and PGC1β expression levels. Protein expression of ERRα in mock-infected or MYC-transduced cells was determined by immunoblotting. Data are representative of 3 experiments.
Figure 5
Figure 5. MYC-dependent expression of ERRα is required for osteoclastogenesis.
(A) Osteoclast differentiation in mock-infected or MYC-transduced MYCΔM OCPs treated with XCT790 (10 μM). Representative images of TRAP-stained cells are shown. Scale bars: 200 μm. Graph indicates the number of TRAP-positive MNCs counted in triplicate from at least 3 experiments. (B and C) Effect of ERRα deficiency on mitochondrial respiration. Control (Esrra+/+) and ERRα-deficient (Esrra–/–) OCPs were stimulated with RANKL (50 ng/ml) for 2 days, and then the mitochondrial respiration rate of those cells was assessed by real-time measurement of the OCR (n = 4). (B) Representative time course data. (C) Assessment of mitochondrial activity as described in Supplemental Figure 9. (D) mRNA expression of oxidative phosphorylation–related genes in Esrra+/+ and Esrra–/– OCPs and XCT790-treated OCPs (10 μM) following RANKL stimulation (n = 3). Idh3a, isocitrate dehydrogenase 3; Sdhd, succinate dehydrogenase complex, subunit D, integral membrane protein; Cyc1, cytochrome c-1; Cox5b, cytochrome c oxidase subunit Vb; Uqcrc2, ubiquinol cytochrome c reductase core protein 2. (E) Osteoclast differentiation in mock-infected or Ca-NFATc1– and ERRα-transduced MYCΔM OCPs. Representative images of TRAP-stained cells are shown. Scale bars: 200 μm. Graph shows the number of TRAP-positive MNCs counted in triplicate from 4 independent experiments. All data are shown as the mean ± SEM. *P < 0.05, by 2-way ANOVA with Tukey’s post-hoc test (A, C, and D) and 1-way ANOVA with Tukey’s post-hoc test (E).
Figure 6
Figure 6. Ablation of MYC protects mice from OVX-induced pathological bone loss.
(A) Schematic diagram illustrating the experimental design. (B and C) μCT analysis of femurs from 19-week-old sham-operated or OVX myeloid-specific MYC-deficient mice (MYCΔM) and control mice (MYCWT). n = 7 sham-operated or OVX MYCWT; n = 8 sham-operated or OVX MYCΔM mice. (B) Representative images show trabecular architecture by μCT reconstruction in distal femurs. Scale bars: 1 mm. (C) μCT measurements for the indicated parameters in distal femurs. Bone volume, trabecular numbers, trabecular thickness, and trabecular space were determined by μCT analysis. (D) Osteoclast numbers per bone surface were measured by histomorphometric analysis (n 4). All data are shown as the mean ± SEM. *P < 0.05, by 1-way ANOVA with Tukey’s post-hoc test.
Figure 7
Figure 7. Therapeutic effect of XCT790 on the osteoporosis model.
(A) Schematic diagram illustrating the experimental design. (B and C) μCT analysis of the femurs of sham-operated, vehicle-treated (sham, n = 6), vehicle-treated OVX (vehicle, n = 4), and XCT790-treated OVX (XCT790, n = 5) high-bone-mass C3H mice. (B) Representative images showing trabecular architecture by μCT reconstruction in the distal femurs of C3H mice. Scale bars: 1 mm. (C) μCT measurements for the indicated parameters in distal femurs. (D and E) μCT analysis of the femurs of sham-operated, vehicle-treated (sham, n = 7), vehicle-treated OVX (vehicle, n = 6), and XCT790-treated OVX (XCT790, n = 5) low-bone-mass CD-1 mice. (D) Representative images show trabecular architecture by μCT reconstruction in distal femurs. Scale bars: 1 mm. (E) μCT measurements for the indicated parameters in distal femurs. All data are shown as the mean ± SEM. *P < 0.05, by 1-way ANOVA with Tukey’s post-hoc test.

Comment in

  • The many ways of osteoclast activation

Similar articles

Cited by

References

    1. Nie Z, et al. c-Myc is a universal amplifier of expressed genes in lymphocytes and embryonic stem cells. Cell. 2012;151(1):68–79. doi: 10.1016/j.cell.2012.08.033. - DOI - PMC - PubMed
    1. Lin CY, et al. Transcriptional amplification in tumor cells with elevated c-Myc. Cell. 2012;151(1):56–67. doi: 10.1016/j.cell.2012.08.026. - DOI - PMC - PubMed
    1. Rahl PB, et al. c-Myc regulates transcriptional pause release. Cell. 2010;141(3):432–445. doi: 10.1016/j.cell.2010.03.030. - DOI - PMC - PubMed
    1. Baudino TA, et al. c-Myc is essential for vasculogenesis and angiogenesis during development and tumor progression. Genes Dev. 2002;16(19):2530–2543. doi: 10.1101/gad.1024602. - DOI - PMC - PubMed
    1. Dang CV. MYC on the path to cancer. Cell. 2012;149(1):22–35. doi: 10.1016/j.cell.2012.03.003. - DOI - PMC - PubMed

MeSH terms