. 2017 Jun;19(6):653-665.
doi: 10.1038/ncb3528. Epub 2017 May 22.

Endoglin controls blood vessel diameter through endothelial cell shape changes in response to haemodynamic cues

Affiliations

Endoglin controls blood vessel diameter through endothelial cell shape changes in response to haemodynamic cues

Wade W Sugden et al. Nat Cell Biol. 2017 Jun.

Abstract

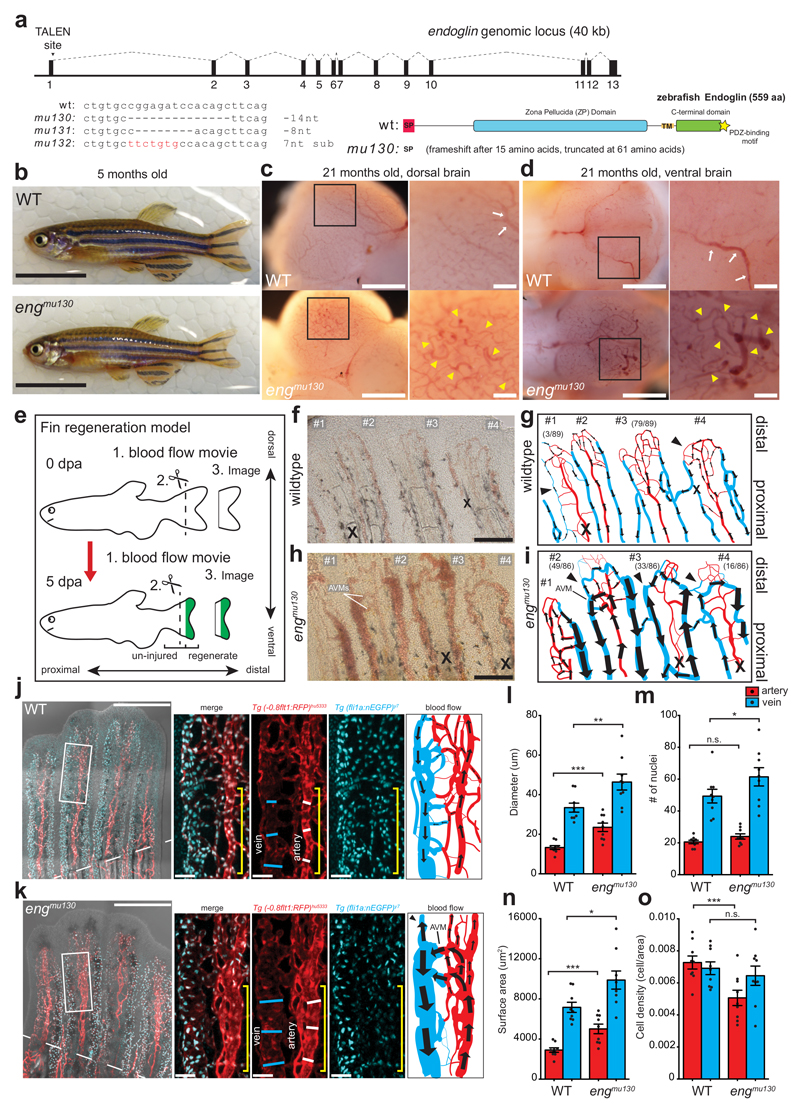
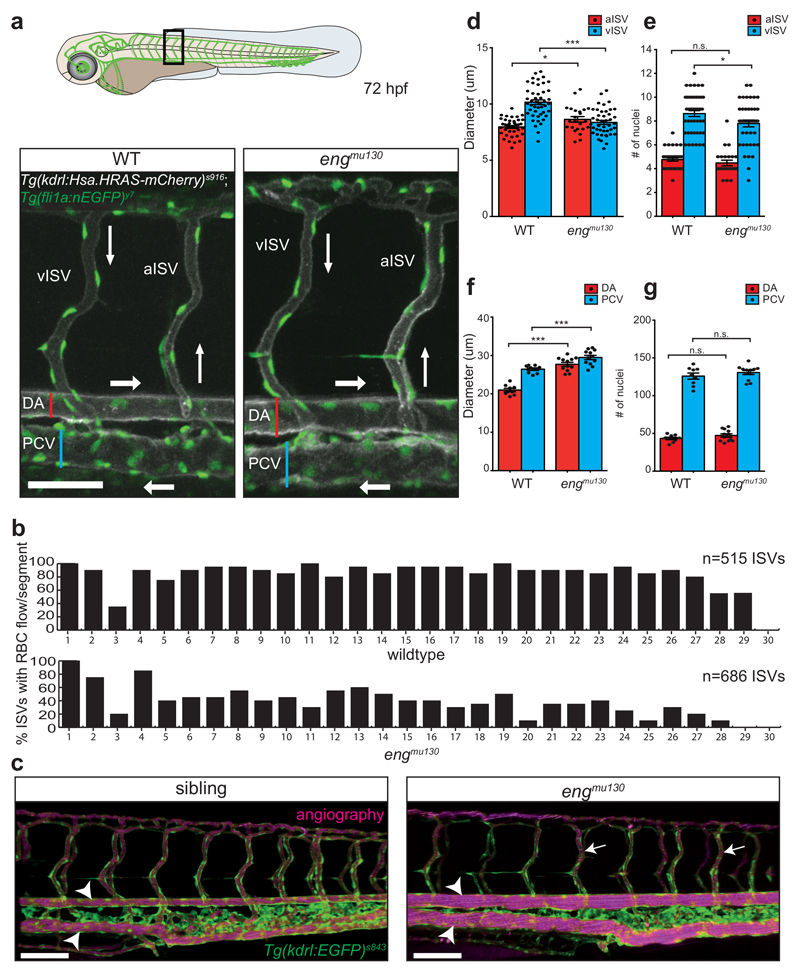
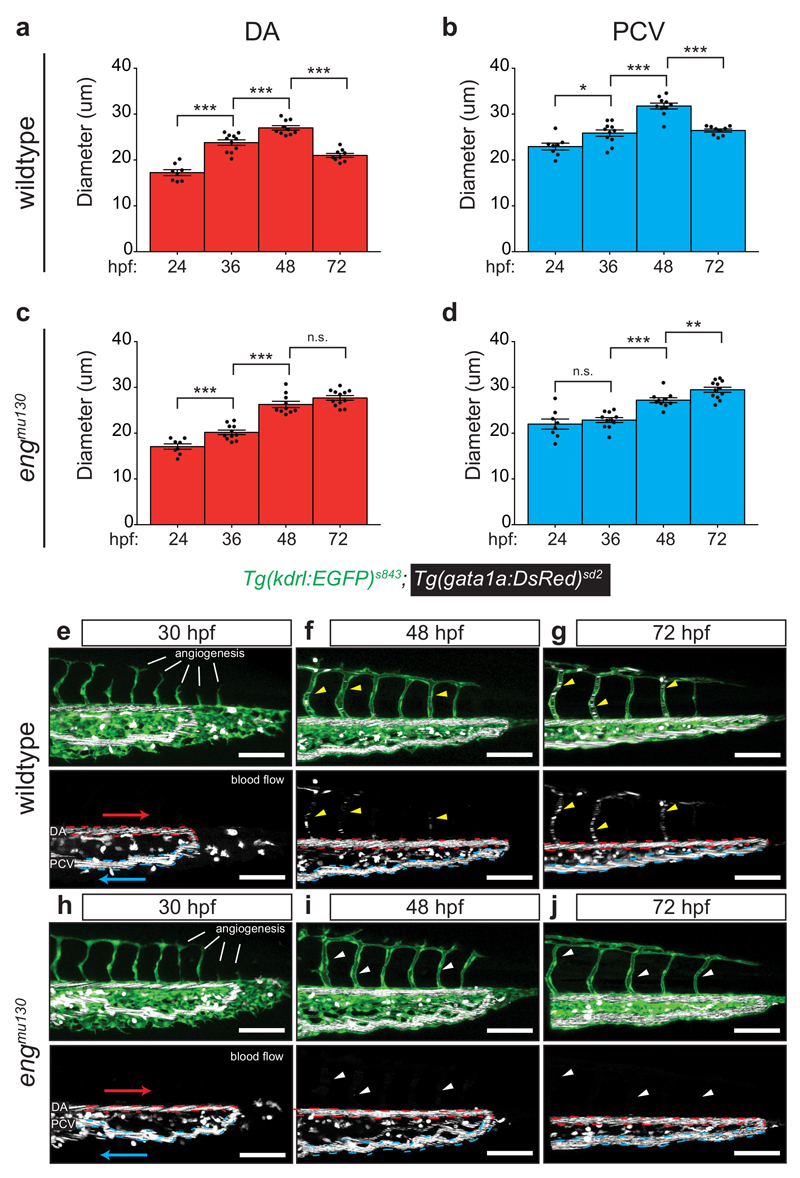
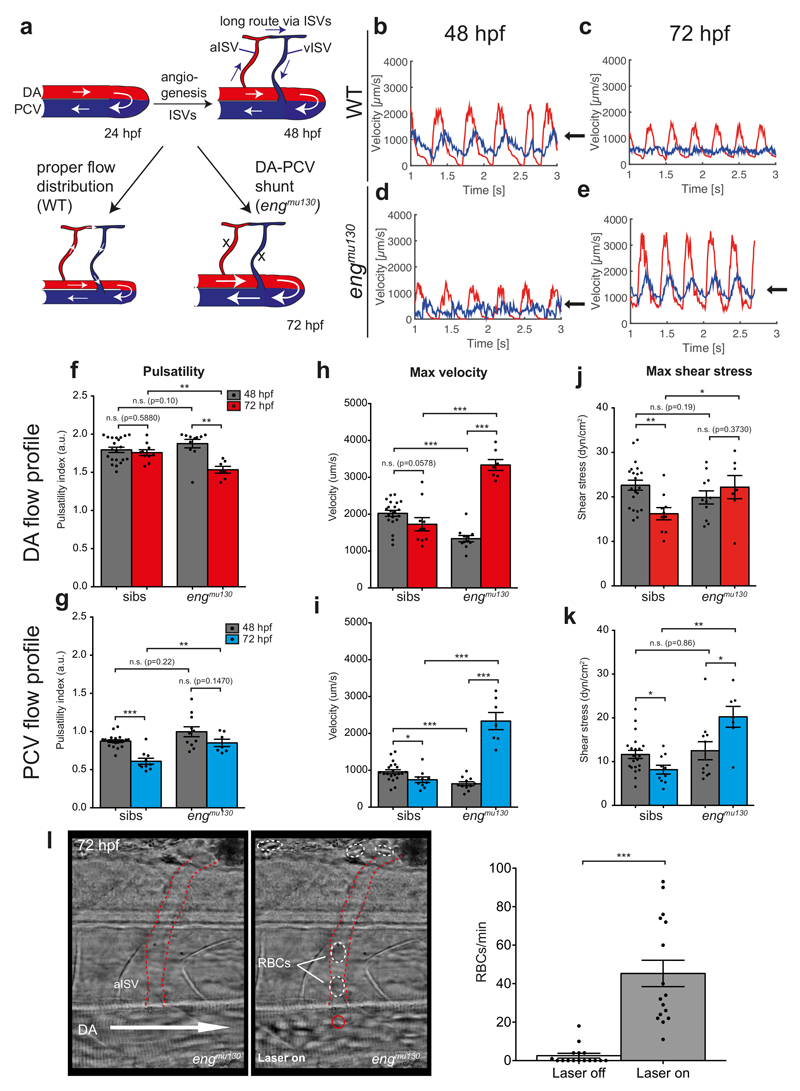
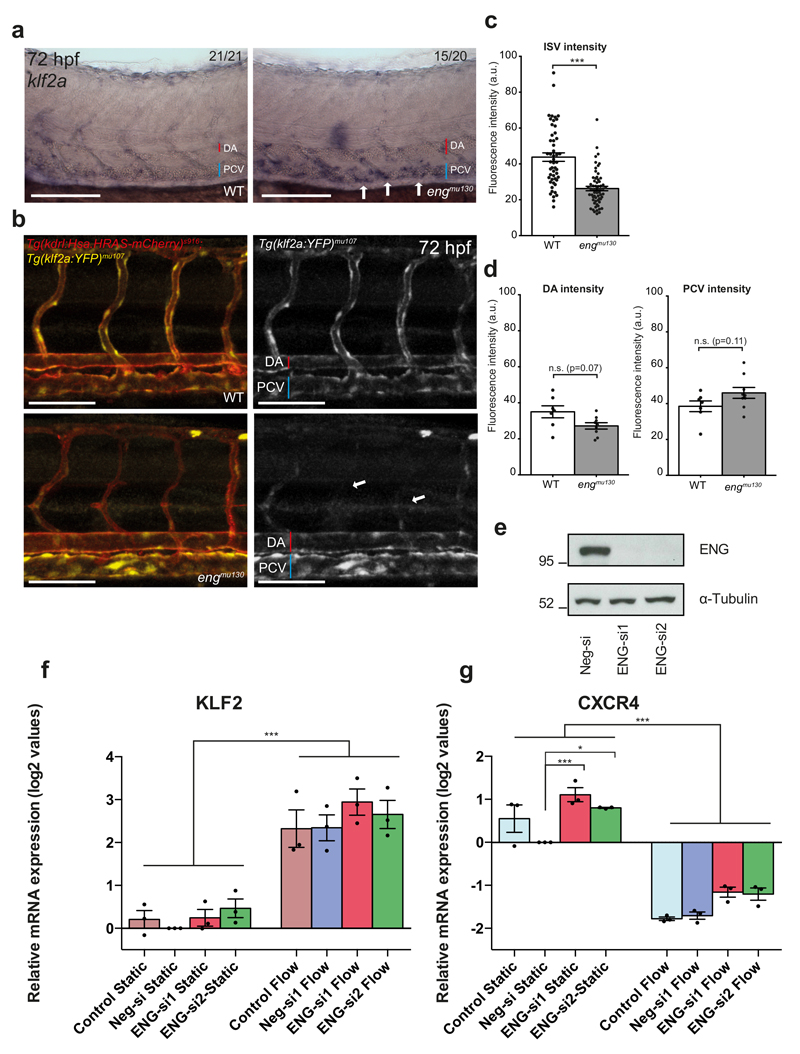
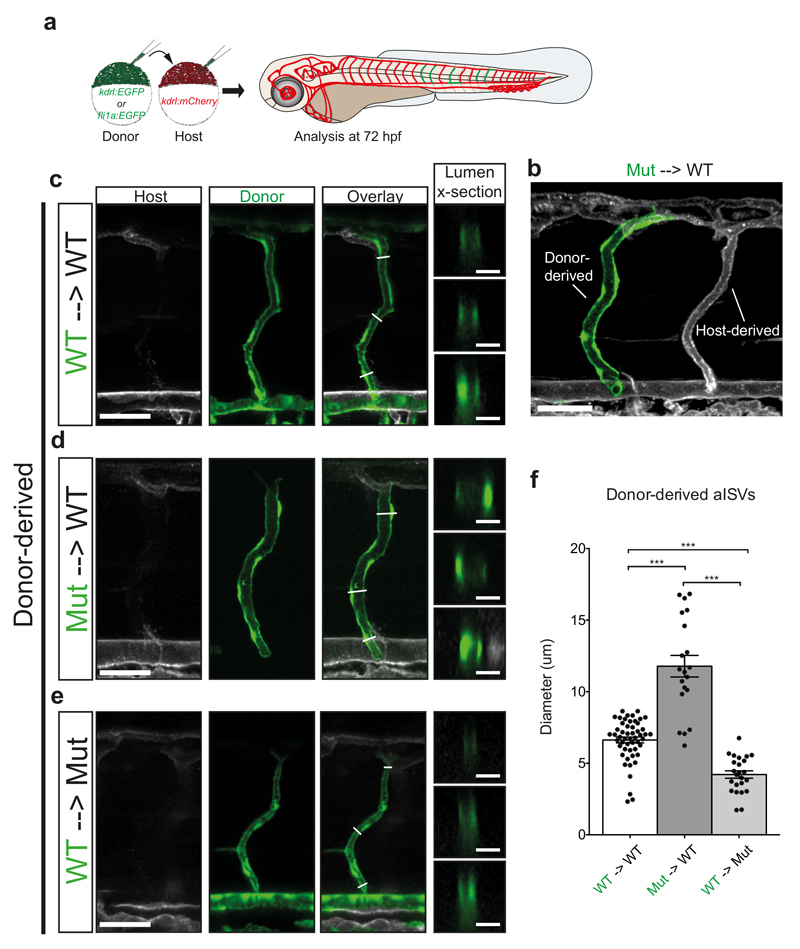
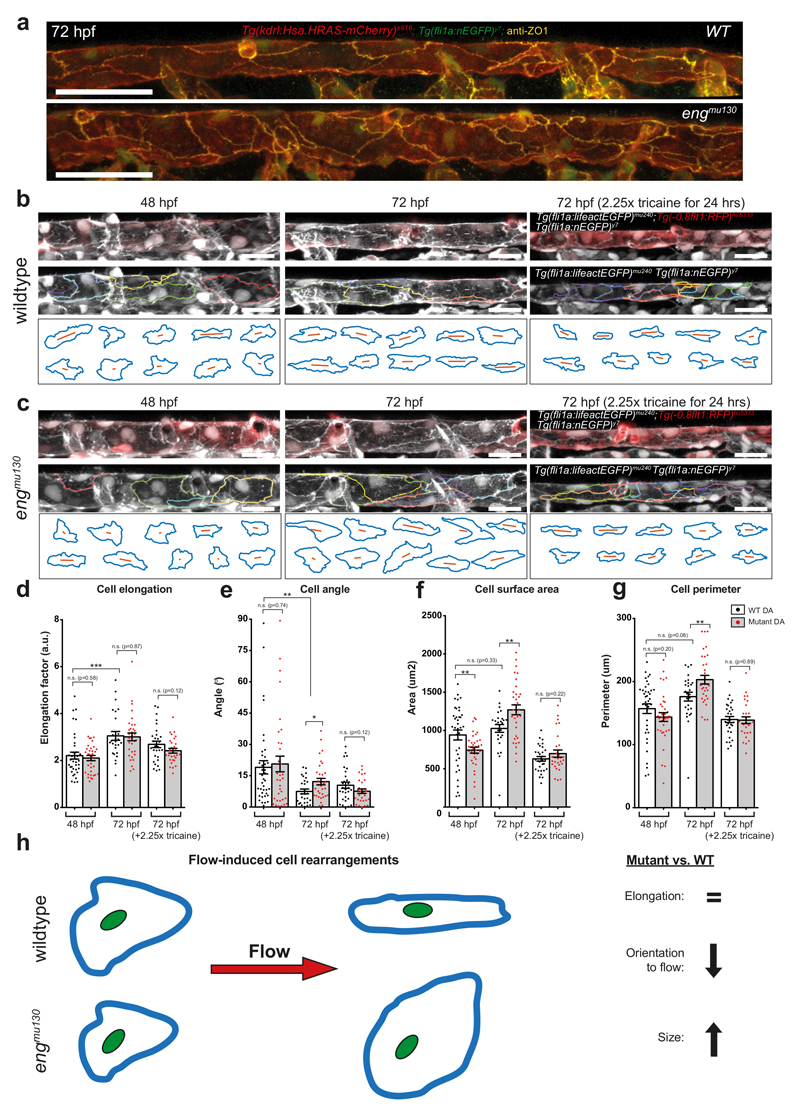
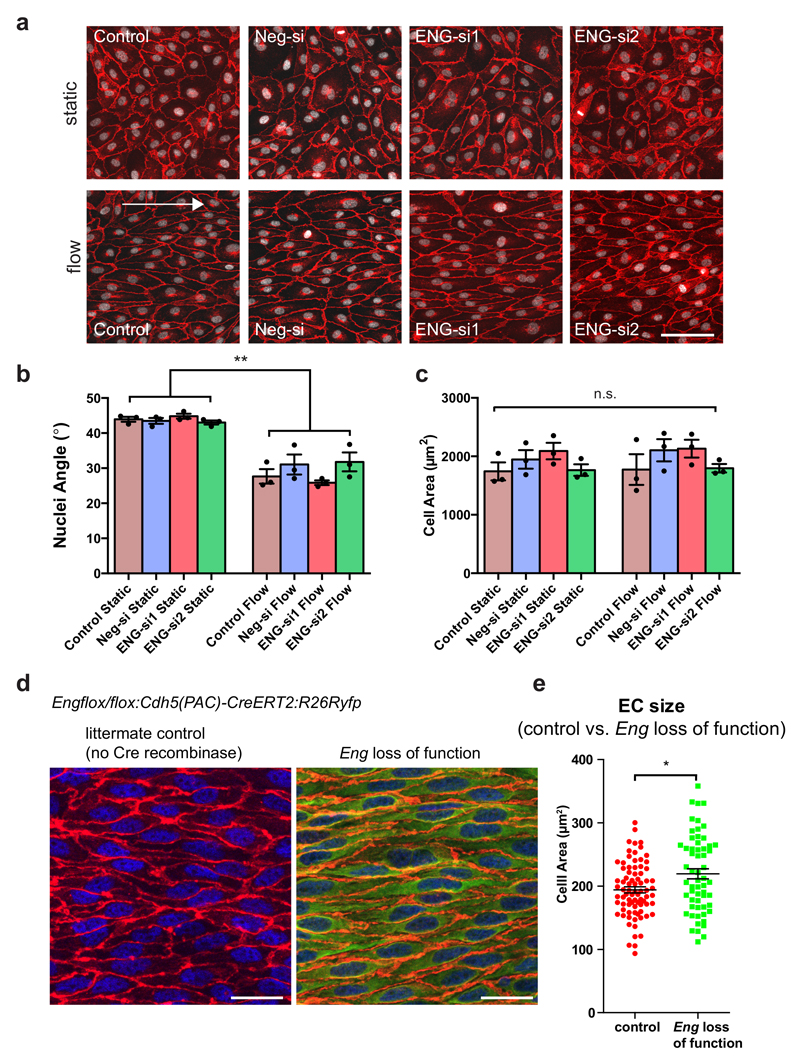
The hierarchical organization of properly sized blood vessels ensures the correct distribution of blood to all organs of the body, and is controlled via haemodynamic cues. In current concepts, an endothelium-dependent shear stress set point causes blood vessel enlargement in response to higher flow rates, while lower flow would lead to blood vessel narrowing, thereby establishing homeostasis. We show that during zebrafish embryonic development increases in flow, after an initial expansion of blood vessel diameters, eventually lead to vessel contraction. This is mediated via endothelial cell shape changes. We identify the transforming growth factor beta co-receptor endoglin as an important player in this process. Endoglin mutant cells and blood vessels continue to enlarge in response to flow increases, thus exacerbating pre-existing embryonic arterial-venous shunts. Together, our data suggest that cell shape changes in response to biophysical cues act as an underlying principle allowing for the ordered patterning of tubular organs.


Conflict of interest statement

Competing financial interests

The authors declare no competing financial interests.

Figures

Figure 1
Figure 1. Zebrafish eng mutants develop AVMs.
(a) TALEN target site of zebrafish eng and isolated alleles. Endoglin domain structure predicted by zebrafish primary sequence: signal peptide (SP, red), Zona Pellucida domain (ZP, blue), transmembrane region (TM, orange), cytoplasmic region containing a serine/threonine-rich sequence (green) and a C-terminal PDZ-binding motif (yellow star). (b) Adult WT and engmu130 zebrafish. Scale bar is 10 mm. (c, d) Dorsal (c) and ventral (d) images of dissected brains from aged zebrafish. WTs exhibit hierarchical organization of vasculature, with large calibre vessels (arrows in inset). engmu130 zebrafish present with dilated tortuous vessels (arrowheads in inset) and loss of hierarchical patterning. Images are representative of 5 WT and 5 mut fish. Scale bar is 500 um (overview), 100 um (inset). (e) Schematic of fin regeneration model. (f-i) Still images from blood flow movies in 5 dpa fin regenerate and cartoon depiction of blood flow (arrows) in WTs (f, g) and engmu130 mutants (h, i). Numbers label individual rays in the movie. Arrows indicate flow direction, arrowheads highlight reversals. Numbers in parentheses depict number of rays in analysed fish sharing a similar flow characteristic (89 rays from 12 WT, and 86 rays from 12 mut). X indicates large inactive vessel. Note bleedings at distal tips of regenerating rays in engmu130 fish. Scale bar is 200 um. (j, k) Maximum intensity projections of confocal z-stacks of AVM in engmu130 regenerate and comparable region in WT at 5 dpa. Dashed line indicates amputation plane. Solid lines indicate vessel calibre and yellow bracket indicates region of vasculature analysed (inset). Cartoon depicts blood flow patterns in movies. Note shunting of arterial blood to the vein in mutant AVM, and flow reversal in distal part of affected vein (arrowhead). Scale bar is 400 um (overview), 50 um (inset). (l-p) Quantification of diameter (l), endothelial cell (EC) number (m), endothelial area (n) and cell density (o) in arteries and veins in proximity to AVM in engmu130 fish and comparable WT regions (n=9 WT, n=9 mut). Analysed by paired Student’s t-test. n.s., not significant, *P<0.05, **P<0.01, ***P<0.001, error bars indicate s.e.m.
Figure 2
Figure 2. Zebrafish 72 hpf trunk vasculature recapitulates an AVM-like phenotype.
(a) Cartoon of 72 hpf embryo, box indicates region of images. Maximum intensity projection of confocal z-stack of single segmental unit in zebrafish trunk at 72 hpf. Tg(kdrl:Hsa.HRAS-mcherry)s916 labels EC membranes, while Tg(fli1a:nEGFP)y7 shows EC nuclei. The dorsal aorta (DA), posterior cardinal vein (PCV), arterial and venous intersegmental vessels (aISVs and vISVs) are labelled. Blood flow direction indicated with arrows. Scale bar is 60 um. (b) Quantification of the number of ISVs actively carrying RBCs shows approximately 50% reduction in engmu130 embryos (515 ISVs from 9 WT embryos, 686 ISVs from 12 mut embryos). (c) Angiography with Qdots 633 nm in engmu130 sibling and mutant. Both sibling and mutant embryos show lumenization of nearly all ISVs (arrows). Note, however, the dramatic increase in diameter of axial vessels in the mutant compared to sibling (arrowheads). Images are representative of 6 WT and 6 mut embryos. Scale bar is 100 um. (d) Quantification of vessel diameter for aISVs and vISVs in WT and engmu130 mutant embryos. In WTs, vISVs have a larger diameter than aISVs. In mutants, aISVs slightly dilate while vISVs have a reduced calibre (n=38 aISVs/46 vISVs from 9 WTs; n=23 aISVs/43 vISVs from 12 mut). Analysed by unpaired Student’s t-test. (e) Quantification of EC number in ISVs. There is no change in the EC number in aISVs, while vISVs show a slight reduction in EC number. Analysed by Mann-Whitney U test (n=38 aISVs/46 vISVs from 9 WTs; n=23 aISVs/43 vISVs from 12 mut). (f) Quantification of vessel diameter for the DA and PCV in WT and engmu130 mutant embryos. Both DA and PCV show significant dilation in mutants (n=9 WT, n=12 mut). Analysed by unpaired Student’s t-test. (g) Quantification of the number of ECs in the DA and PCV. WT and engmu130 mutants have no difference in EC numbers in these vessels (n=9 WT, n=12 mut). Analysed by unpaired Student’s t-test. n.s., not significant, *P<0.05, **P<0.01, ***P<0.001, error bars indicate s.e.m.
Figure 3
Figure 3. Analysis of DA and PCV diameter during development.
(a, b) Average DA (a) and PCV (b) diameter in WT embryos from 24-72 hpf. Notice steady increase in vessel calibre until 48 hpf, followed by reduction at 72 hpf. (c, d) Average DA (c) and PCV (d) diameter in engmu130 embryos from 24-72 hpf. Same progression of vascular calibre increases as WT until 48 hpf, with pronounced failure to reduce size at 72 hpf in both artery and vein (WT 24, 36, 48, 72 hpf: n=8, 11, 10, and 9 embryos; Mut 24, 36, 48, 72 hpf: n=8, 11, 10, 12 embryos). Analysed by unpaired Student’s t-test. (e-j) Maximum intensity projections of confocal z-stacks of WT (e-g) and engmu130 mutants (h-j) at 30, 48 and 72 hpf. Dashed lines indicated DA (red) and PCV (blue), while arrows indicate flow direction. At 30 hpf, the ISV network is still in the process of forming via sprouting angiogenesis, and does not have RBCs in the vessels. In WTs, RBC flow in ISVs is weak at 48 hpf and strongly increased by 72 hpf (yellow arrowheads in f and g). White arrowheads (i and j) show ISVs that are lumenized but do not carry RBCs in engmu130 mutants. Images are representative of 6 WT and 6 mut embryos. Scale bar is 100 um. n.s., not significant, *P<0.05, **P<0.01, ***P<0.001, error bars indicate s.e.m.
Figure 4
Figure 4. Blood flow patterns adapt to the expansion of the embryonic vasculature.
(a) Cartoon depicting blood flow changes through axial vasculature during development. At 24 hpf, all blood flow is through a primary arterial-venous loop. The addition of new capillaries through angiogenesis creates longer loops that are perfused with RBCs in WT, but not in engmu130 mutants. (b-e) Representative DA (red) and PCV (blue) blood flow profiles for sibling and engmu130 mutant embryos at 48 hpf and 72 hpf. Arrows indicate PCV velocity peaks following arterial velocity peaks. (f-k) Quantification of DA and PCV blood flow parameters (pulsatility, maximum velocity and maximum shear stress) in siblings and engmu130 mutants between 48 hpf and 72 hpf (48 hpf n=21 siblings, n=11 mut; 72 hpf n=10 siblings, n=7 mut). Analysed by Mann-Whitney U test. (l) Still images from movie showing diversion of RBCs into aISV by application of holographic optical tweezers (HOT). Arrow indicates direction of DA blood flow. aISV outlined by dashed red lines. Red circle denotes HOT laser focal point near aISV entrance. Dashed white circles highlight RBCs in lumen of aISV. Quantifcation of RBC flow through the same ISVs with HOT inactive (laser off) or active (laser on) (n=16 aISVs). Analysed by Mann-Whitney U test. n.s., not significant, *P<0.05, **P<0.01, ***P<0.001, error bars indicate s.e.m.
Figure 5
Figure 5. Eng does not affect klf2a-mediated shear stress-sensing.
(a) Whole-mount in situ hybridization of endogenous klf2a expression in WT or engmu130 mutant embryos at 72 hpf. Note enhanced staining in PCV of engmu130 mutants (arrows). Images are representative of 21 out of 21 WT embryos and 15 out of 20 mut embryos. Scale bar is 100 um. (b) Maximum intensity projection of confocal z-stack of zebrafish trunk at 72 hpf. Tg(klf2a:YFP)mu107 exhibits vascular-specific YFP expression, evidenced by overlap with Tg(kdrl:Hsa.HRAS-mCherry)s916. engmu130 mutants also display YFP expression in axial vessels, but decreased expression in ISVs (arrows). Scale bar is 100 um. (c, d) Quantification of YFP fluorescence intensity in ISVs, DA and PCV of WT and engmu130 mutants. ISVs have reduced YFP signal, while engmu130 mutants have a trend toward less intensity in the DA and more intensity in the PCV (not significant) (ISVs n=51 ISVs from 7 WT, n=62 ISVs from 9 mut; DA/PCV n=7 WT, n=9 mut). Analysed by Mann-Whitney U test. (e) Down-regulation of ENG in HUVEC. siRNA efficiency was confirmed with western blot (representative of 8 blots is shown, molecular weight in kDa is shown on the left). Full size western blots are shown in Supplementary Fig. 8. (f, g) The expression of shear stress responsive genes KLF2 (f) and CXCR4 (g) in siRNA-transfected HUVEC exposed to 15 dyn/cm2 for 4 h. mRNA expression data are shown as log2 values (mean±SEMs) relative to Neg-si, which was set as 0 (n=3 independent experiments). Statistical analysis was performed with One-Way ANOVA and Tukey’s multiple comparison test. n.s., not significant, *P<0.05, **P<0.01, ***P<0.001, error bars indicate s.e.m.
Figure 6
Figure 6. Loss of eng function leads to blood vessel enlargement in an EC autonomous manner.
(a) Schematic of transplantation scheme, using GFP-labelled donor cells and mCherry-labelled host cells. Analysis of vasculature was performed at 72 hpf. (b) Maximum intensity projection of confocal z-stack of mosaic embryo. Some ISVs can be derived completely from donor cells (note dilation of mutant aISV on left compared to WT aISV on the right). Scale bar is 50 um. (c-e) Representative examples of donor-derived ISVs from (c) WT->WT (d) Mut->WT and (e) WT -> Mut transplantations. Optical sections of the lumen reveal complete enclosure by donor cells. Scale bar on overview is 50 um, scale bar on lumen cross-section is 10 um. (f) Quantification of diameter of donor-derived aISVs. (WT->WT n=52 vessel segments from 13 ISVs; Mut->WT n=20 vessel segments from 5 ISVs; WT->Mut n=24 vessel segments from 6 ISVs). Analysed by One-Way ANOVA. n.s., not significant, *P<0.05, **P<0.01, ***P<0.001, error bars indicate s.e.m.
Figure 7
Figure 7. Endoglin function is necessary for blood flow-induced cell shape changes.
(a) Maximum intensity projection of confocal z-stack of the DA at 72 hpf. ZO-1 labels EC tight junctions, which are present in both WT and engmu130 mutants. Note the relatively disordered arrangement of mutant ECs compared to WT. Representative of 5 WTs and 5 muts. Scale bar is 50 um. (b, c) Maximum intensity projection of confocal z-stack of the DA at 48 hpf and 72 hpf (with or without 2.25x tricaine treatment) in WT and engmu130 mutants. Tg(fli1a:lifeactEGFP)mu240 enrichment at cell-cell contacts, together with mosaic Tg(-0.8flt1:RFP)hu5333 and Tg(fli1a:nEGFP)y7, can be used to outline 3D perimeters of cells. Note elongation and alignment of cells at 72 hpf compared to 48 hpf in WTs. engmu130 mutant cells have a larger surface area at 72 hpf, but tricaine treatment reduces surface area in both WTs and mutants. Scale bar is 25 um. (d-g) Quantification of DA endothelial cell shape parameters: cell elongation, angle, surface area and perimeter in WTs and engmu130 mutants. (48 hpf: n=38 cells from 2 WTs, n=35 cells from 2 muts; 72 hpf: n=27 cells from 2 WTs, n=33 cells from 2 muts; 72 hpf (2.25x tricaine): n=30 cells from 2 WTs, n=29 cells from 2 muts). Individual fish from 2 independent experiments per condition. See Materials and Methods for description of statistical analysis. (h) Schematic of flow-induced EC shape changes. Flow causes WT cells to elongate and align without a change in their surface areas. In engmu130 mutants, elongation occurs normally, but EC sizes increase considerably. n.s., not significant, *P<0.05, **P<0.01, ***P<0.001, error bars indicate s.e.m.
Figure 8
Figure 8. Role of endoglin in controlling morphology of mammalian ECs exposed to flow.
(a) VE-cadherin (red) and nuclei (white) staining of HUVEC transfected with siRNAs against ENG or negative siRNA and exposed to unidirectional shear stress of 15 dyn/cm2 for 24 h. The arrow represents flow direction. Scale bar is 100 um. (b) Quantification of angle of nuclei to the direction of flow (set as 0°) in (a). The bars represent the mean nuclei angle (n=3 independent experiments). (c) Cell area, measured by dividing total image area by the number of nuclei. For all quantifications, an average was taken from five random images per sample (n=3 independent samples). Statistical analysis was performed with One-Way ANOVA and Tukey’s multiple comparison test. (d) Immunostaining of ECs in thoracic aorta from WT and Engflox/flox:Cdh5(PAC)-CreERT2:R26Ryfp mice at P9 after 50 ug tamoxifen injection at P4. GFP indicates recombination. EC outlines can be distinguished by CD31 labelling (red), and nuclei with ERG (blue). Scale bar is 20 um. (e) Quantification of surface area in ECs of the thoracic aorta in WT and Eng loss of function mice. (WT aorta: n=79 cells from 3 mice; Eng KO cells from fully recombined aorta: n=59 cells from 3 mice). Analysed by unpaired Student’s t-test. n.s., not significant, *P<0.05, **P<0.01, error bars indicate s.e.m.

Comment in

References

    1. Ochoa-Espinosa A, Affolter M. Branching Morphogenesis: From Cells to Organs and Back. Cold Spring Harb Perspect Biol. 2012 - PMC - PubMed
    1. Filosa JA, Morrison HW, Iddings JA, Du W, Kim KJ. Beyond neurovascular coupling, role of astrocytes in the regulation of vascular tone. Neuroscience. 2016;323:96–109. - PMC - PubMed
    1. Joyner MJ, Casey DP. Regulation of increased blood flow (hyperemia) to muscles during exercise: a hierarchy of competing physiological needs. Physiol Rev. 2015;95:549–601. - PMC - PubMed
    1. Baeyens N, Schwartz MA. Biomechanics of vascular mechanosensation and remodeling. Mol Biol Cell. 2016;27:7–11. - PMC - PubMed
    1. Kamiya A, Togawa T. Adaptive regulation of wall shear stress to flow change in the canine carotid artery. Am J Physiol. 1980;239:H14–21. - PubMed

Publication types

MeSH terms