. 2017 Jun;19(6):689-697.
doi: 10.1038/ncb3525. Epub 2017 May 22.

Actin cortex architecture regulates cell surface tension

Affiliations

Actin cortex architecture regulates cell surface tension

Priyamvada Chugh et al. Nat Cell Biol. 2017 Jun.

Abstract

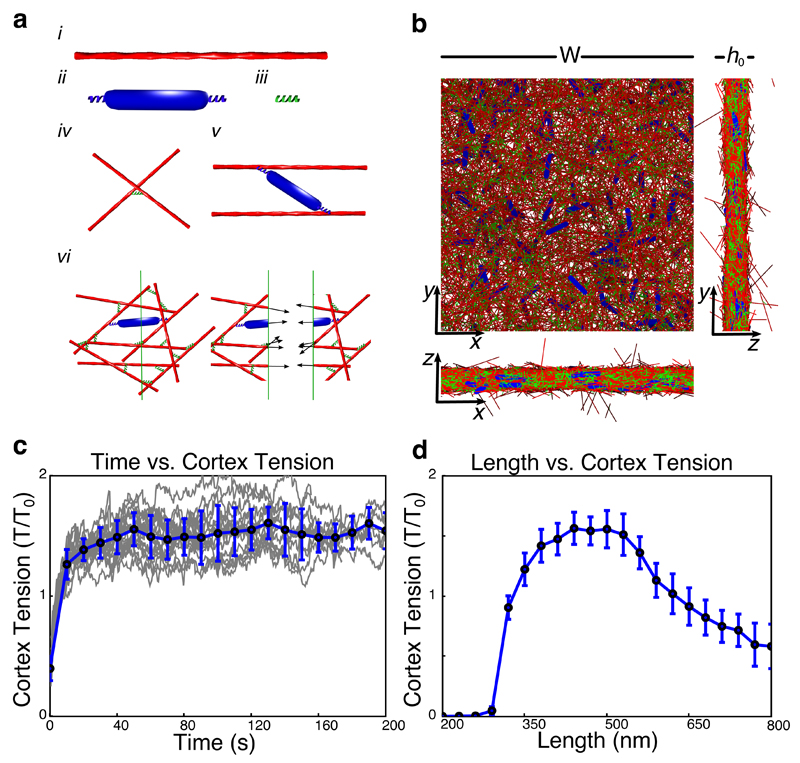
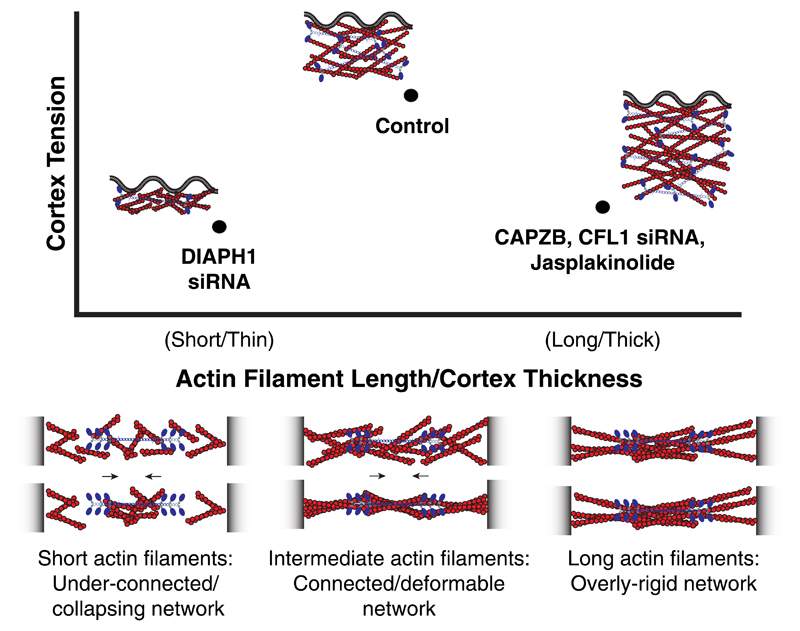
Animal cell shape is largely determined by the cortex, a thin actin network underlying the plasma membrane in which myosin-driven stresses generate contractile tension. Tension gradients result in local contractions and drive cell deformations. Previous cortical tension regulation studies have focused on myosin motors. Here, we show that cortical actin network architecture is equally important. First, we observe that actin cortex thickness and tension are inversely correlated during cell-cycle progression. We then show that the actin filament length regulators CFL1, CAPZB and DIAPH1 regulate mitotic cortex thickness and find that both increasing and decreasing thickness decreases tension in mitosis. This suggests that the mitotic cortex is poised close to a tension maximum. Finally, using a computational model, we identify a physical mechanism by which maximum tension is achieved at intermediate actin filament lengths. Our results indicate that actin network architecture, alongside myosin activity, is key to cell surface tension regulation.


Conflict of interest statement

Competing Financial Interests

The authors declare no competing financial interests.

Figures

Figure 1
Figure 1. The mitotic cortex is thinner and has higher tension than the interphase cortex.
(a) Schematic representation of cortex thickness and tension measurements in adherent HeLa cells in interphase (trypsinized) and mitosis. (b) Adherent HeLa (HeLa) and suspension HeLa (S-HeLa) cells synchronized in interphase (G1/S) and mitosis (prometaphase) expressing GFP-Actin and mCherry-CAAX. Images are representative of 3, 13, 6, 5 independent experiments and 41, 100, 47, 27 cells). Scale bars = 10 μm. (c, d) Boxplots comparing cortex tension and cortex thickness, h, between interphase (blue) and mitotic (red) HeLa (c) and S-HeLa cells (d). Points represent individual measurements (n=12, 13, 41, 100 cells pooled across at least 3 independent experiments; p=0.0009, 1.4x10⁻¹⁵ for adherent HeLa cells and n=40, 42, 47, 27 cells (outliers included) pooled across 5-6 independent experiments; p=7.9x10⁻⁵, 2.4x10⁻⁸ for S-HeLa cells). The points plotted with 'X' were determined to be outliers (see Methods for details) and were not considered for statistical analysis. (e) Representative images of interphase and mitotic Normal Rat Kidney (NRK) cells (trypsinized) expressing GFP-Actin and mCherry-CAAX and mouse embryonic stem cells (Mouse ESC) expressing LifeAct-GFP and labelled with plasma membrane binding dye Cell Mask Orange™ (CMO). Mouse ESCs were cultured in 2i/LIF medium, where they display a rounded morphology throughout the cell cycle. Images are representative of 2-3 independent experiments (11, 13, 22, 13 cells). Scale bars = 10 μm. (f) Boxplot comparing cortex thickness between interphase and mitotic NRK and mouse ESCs. Points represent individual measurements (n=11, 13, 22, 13 cells pooled across 2-3 independent experiments; p=0.0016, 2.6x10⁻⁵). (g) Scanning electron micrographs of membrane extracted cortices of adherent HeLa (left) and S-HeLa (right) cells blocked in interphase and mitosis (representative of 11-18 cells from 1 to 2 independent experiments). Scale bars = 100 nm. Insets: lower magnification images of whole cells; boxed areas indicate the high magnification regions; scale bars = 10 μm. See Supplementary Fig. 2h-j for quantifications. Welch's t-test p-values: **p<0.01; ***p<0.001. For all boxplots in this figure and all subsequent figures, the box extends from the lower to upper quartile of the data, and the line denotes the median. Whiskers extend to include the most extreme values within 1.5 times the interquartile range below and above the lower and upper quartiles, respectively.
Figure 2
Figure 2. Actin filament length-regulating proteins control cortex thickness in mitosis.
Box plots comparing relative cortex thickness in mitotic HeLa cells depleted for contractility-related ABPs (a), cortex-membrane linkers (b), crosslinkers (c) and actin filament length regulators (d). Relative cortex thickness values were obtained by dividing cortex thickness in siRNA-depleted cells (Target) by the median of the corresponding scrambled control (Scr.). Points represent individual measurements (n=14, 26, 18, 23, 10, 25, 21, 17; 14, 24, 20, 17, 40, 33, 13, 9, 13, 12, 17, 17, 26, 17, 21, 7; 38, 18, 38, 16, 38, 16, 27, 16; 21, 18, 8, 12, 38, 17, 40, 44, 21, 16, 20, 20, 21, 25, 40, 23, 8, 13, 13, 16 cells pooled across 2-3 independent experiments; p=0.61, 0.86, 0.15, 0.57; 0.99, 0.47, 0.36, 0.45, 0.82, 0.35, 0.06, 0.36; 0.84, 0.48, 0.80, 0.20; 0.91, 0.0028, 0.0004, 0.034, 0.65, 3.6x10⁻⁶, 0.57, 0.64, 0.47, 0.37). Details on the siRNA treatments are given in Supplementary Table 2; depletion levels were checked by qPCR (Supplementary Fig. 4). Welch's t-test p-values: *p<0.05, **p<0.01 and ***p<0.001.
Figure 3
Figure 3. Perturbation of actin filament length-regulating proteins causes a decrease in cortex tension.
(a) Representative images of mitotic HeLa cells expressing GFP-Actin and mCherry-CAAX treated with siRNA against capping protein subunit beta (CAPZB), cofilin1 (CFL1) and diaphanous1 (DIAPH1). Images are representative of 3-4 independent experiments (17, 44 and 20 cells). Scale bar = 10 μm. (b) Western blots of CAPZB, CFL1 and DIAPH1 levels after siRNA depletion compared to corresponding scrambled controls (Scr.). Representative blots from 3 independent experiments for CAPZB and DIAPH1 and 1 experiment for CFL1, confirming results from Clark et al.. GAPDH was used as the loading control. See Supplementary Fig. 7 for uncropped western blots. (c, d) Boxplots comparing cortex thickness (c, the same data are presented, normalized, in Fig. 2) and cortex tension (d) between cells treated with scrambled (Scr., black) siRNA or siRNA targeted against CAPZB, CFL1 or DIAPH1 (Target, red). Points represent individual measurements (n=38, 17, 40, 44, 20, 20 cells pooled across 3-4 independent experiments, p=0.0004, 0.034, 3.6x10⁻⁶ for thickness measurements; n=7, 14, 17, 24, 14, 20 cells pooled across 2-5 independent experiments, p=0.0046, 0.0315, 0.0006 for tension measurements). (e) Representative images of mitotic HeLa cells expressing myosin-IIA heavy chain MYH9-GFP, treated with siRNA against CAPZB, CFL1, DIAPH1 and corresponding scrambled controls (Scr.). Images are representative of 1-3 independent experiments (28, 35, 22, 28, 23, 38 cells). Scale bars = 10 μm. (f) Boxplots comparing the cortex-to-cytoplasm intensity ratio of MYH9-GFP for all conditions in (e) (n=28, 35, 22, 28, 23, 38 cells pooled across 1-3 independent experiments; p=0.96, 0.0055, 0.088). Welch's t-test p-values: nsp>0.05, *p<0.05, **p<0.01 and ***p<0.001.
Figure 4
Figure 4. A computational model of cortex tension generation predicts maximal tension at intermediate actin filament length.
(a) Components of the simulation: i. actin filament, ii. myosin minifilament, iii. crosslinker, iv. example of crosslinked actin filaments, v. example of a myosin motor binding two actin filaments, vi. tension measurement by slicing the network, arrows represent forces within the network components. (b) Projections of an initialized simulation from the top (xy) and the sides (xz, yz). W: width of simulation box, h0: seeding thickness. (c) Plot of tension (T/T0) as a function of time for an ensemble of simulations with filament length of 500 nm (see Supplementary Table 5 for the other parameters). Gray lines represent measurements for a single plane in a simulation; blue circles are mean values (±SD) for each time point, n=9 simulations. The magnitude at which tension saturates in the simulations is comparable to experimental tension values with our choice of myosin stall force (see Discussion of Model Assumptions in the Supplementary Note). (d) Plot of cortex tension as a function of actin filament length. Blue dots represent mean tension values after 25 s (±SD) calculated from 9 simulations. In c and d, tension is normalized to T0 = 230 pN/μm (see Supplementary Note for details).
Figure 5
Figure 5. Local network behaviour in response to myosin-induced stresses.
(a) Plot of cortex tension as a function of actin filament length separating the total tension (blue) into the tension exerted within myosin motors (green) and the network tension exerted within actin filaments and crosslinkers (red). (b) Example of triangulation used for measuring strain in the network. The black lines are triangles before network deformation, white lines are triangles after deformation, red arrows are the displacement field. Green box marks the zoomed inset (right). (c) Projections of simulated cortical networks with different actin filament lengths (la). xy (top) and xz (bottom) projections were generated after 100 s of simulation runs. The whitened section of the network in the xz view is not shown in the xy view. (d,e) Local strain (d) and local 2D network stress (e) distributions in the deformed networks for filament lengths of 200 nm (left), 500nm (middle) and 740 nm (right) (see Supplementary Note for a description of strain calculation). (d) Positive strain corresponds to stretched regions, negative strain to compressed regions. The strain distributions are largely symmetric, and shorter filament networks exhibit higher strain than networks with longer filaments. (e) Network stress distributions are asymmetric, with larger positive stresses. Stress asymmetry is more pronounced for shorter filament networks. Distribution asymmetry is quantified with the parameter a= (T+T)/(T+ + T), with T+ and T the sum of positive and negative local stresses, and normalized to T0 = 230 pN/μm.
Figure 6
Figure 6. Actin cortex architecture regulates cortical tension.
Our experimental measurements and simulations indicate that cortical tension is maximum at intermediate actin filament length and intermediate cortex thickness (top panel). Conditions that either increase or decrease cortex thickness/actin filament length result in lower tension in mitotic cells. Our simulations suggest a physical mechanism for this non-monotonic relationship (bottom panel). While networks of short filaments are too poorly connected to allow for build up of myosin-induced stresses, networks of long filaments are too rigid to allow for sufficiently asymmetric stress generation. At intermediate filament lengths, networks are sufficiently connected for tension generation, and sufficiently compliant to promote stress asymmetry and the build up of positive tensile stresses, leading to an overall high contractile tension.

References

    1. Salbreux G, Charras G, Paluch E. Actin cortex mechanics and cellular morphogenesis. Trends Cell Biol. 2012;22:536–545. - PubMed
    1. Bray D, White JG. Cortical flow in animal cells. Science. 1988;239:883–888. - PubMed
    1. Clark AG, Paluch E. Mechanics and regulation of cell shape during the cell cycle. In: Kubiak JZ, editor. Cell Cycle in Development. Vol. 1. Springer-Verlag; Berlin, Heidelberg, Germany: 2011. pp. 31–73. - PubMed
    1. Heisenberg CP, Bellaiche Y. Forces in tissue morphogenesis and patterning. Cell. 2013;153:948–962. - PubMed
    1. Levayer R, Lecuit T. Biomechanical regulation of contractility: spatial control and dynamics. Trends Cell Biol. 2012;22:61–81. - PubMed

Publication types

MeSH terms