. 2017 Jun;19(6):639-652.
doi: 10.1038/ncb3534. Epub 2017 May 22.

Endoglin prevents vascular malformation by regulating flow-induced cell migration and specification through VEGFR2 signalling

Affiliations

Endoglin prevents vascular malformation by regulating flow-induced cell migration and specification through VEGFR2 signalling

Yi Jin et al. Nat Cell Biol. 2017 Jun.

Abstract

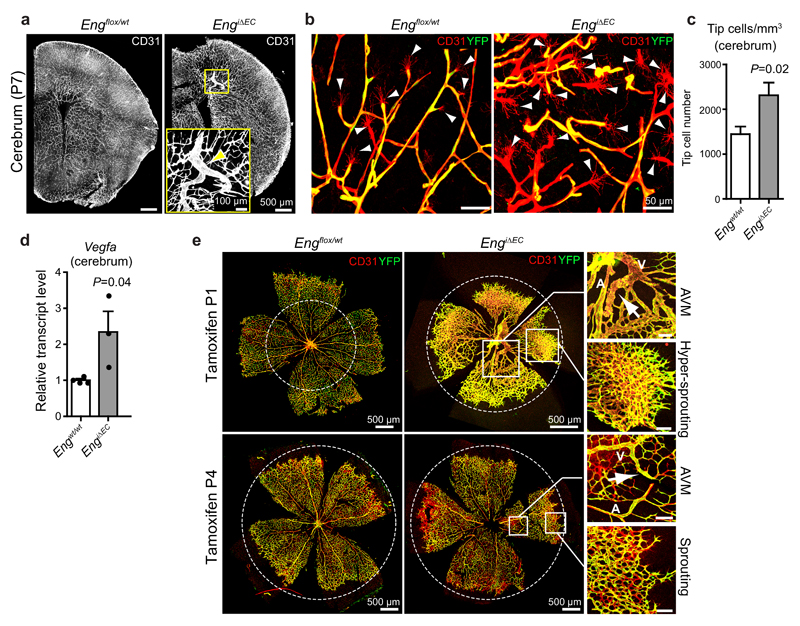
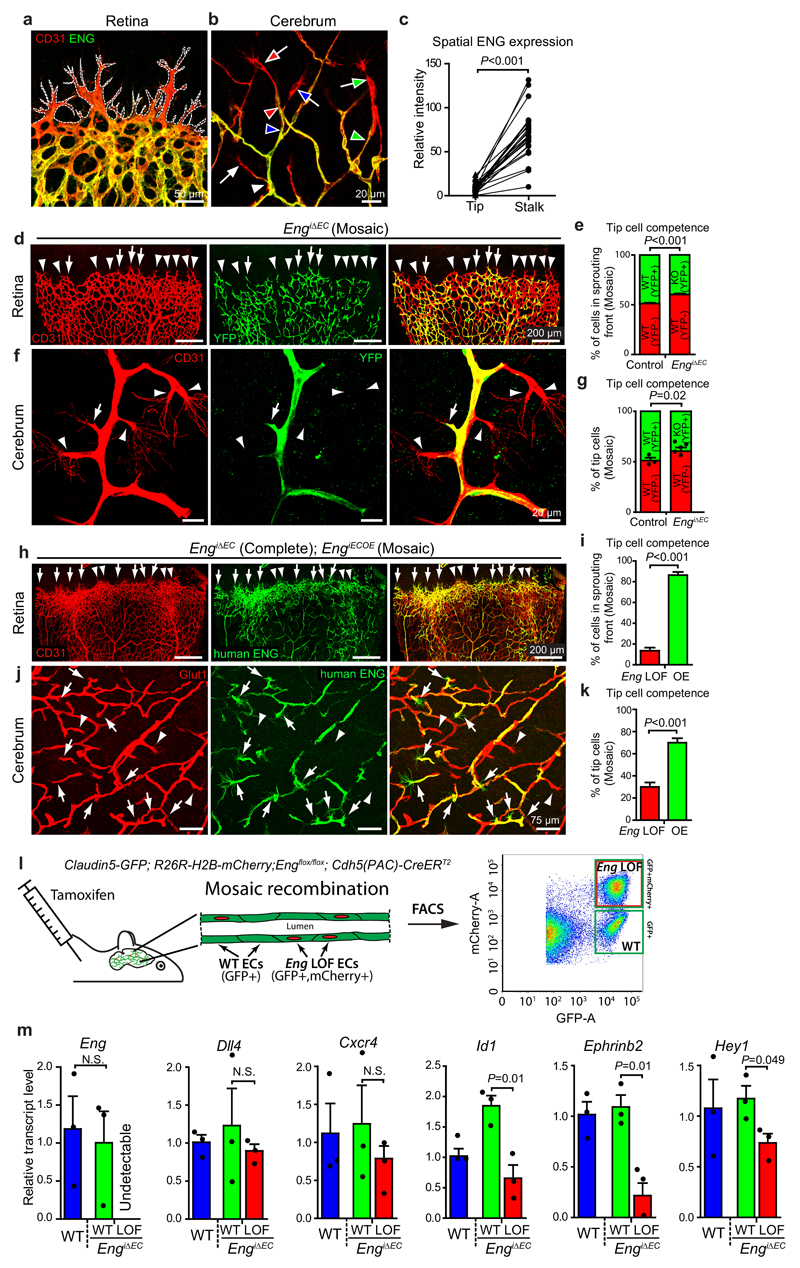
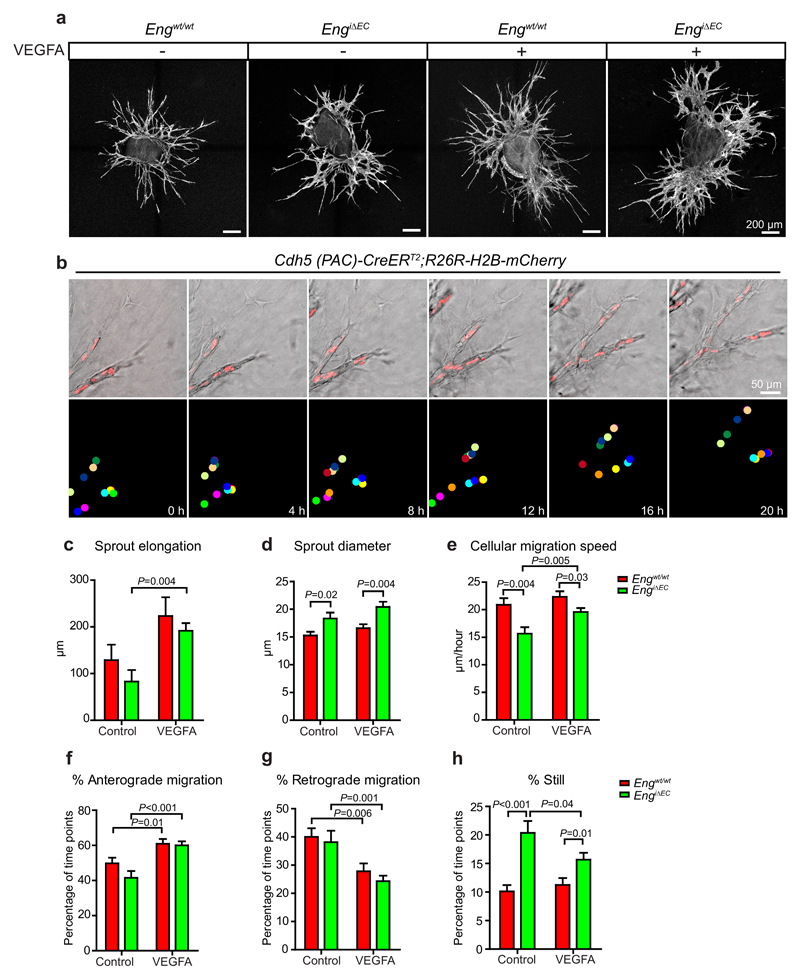
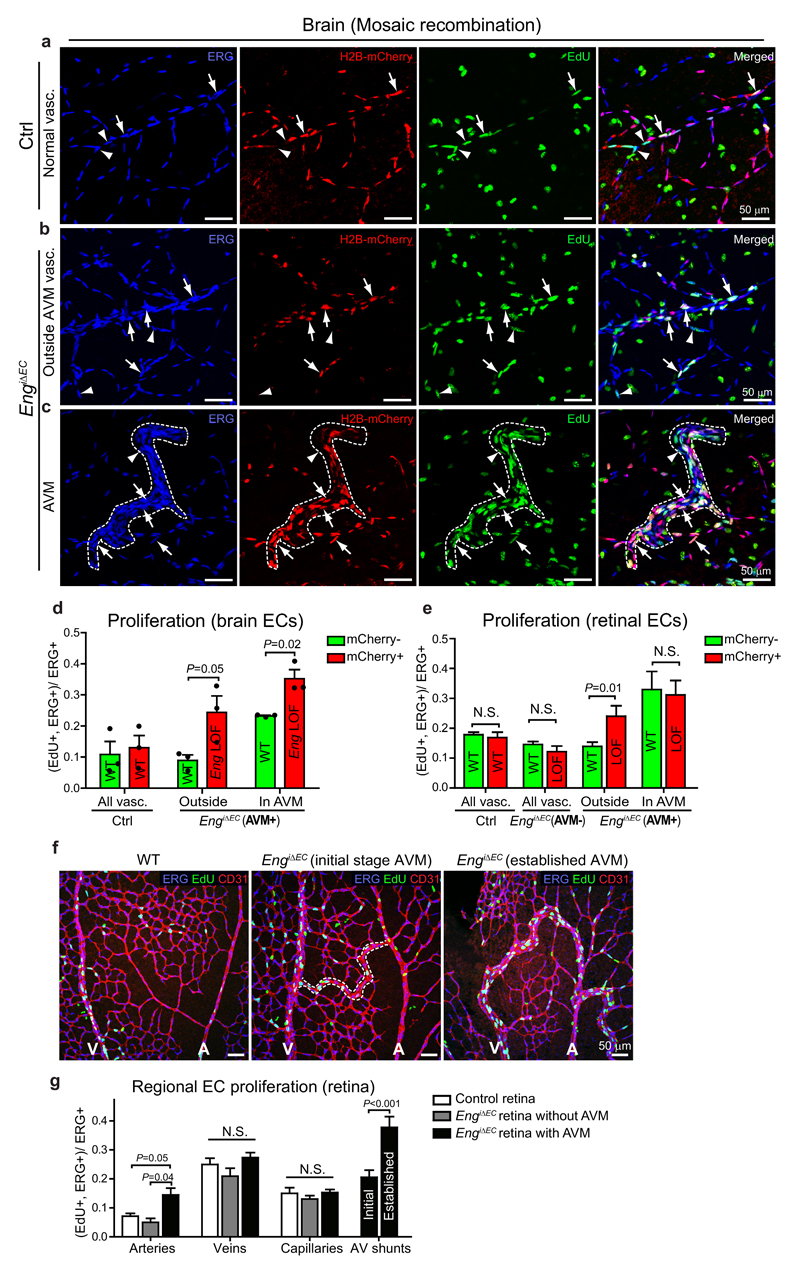
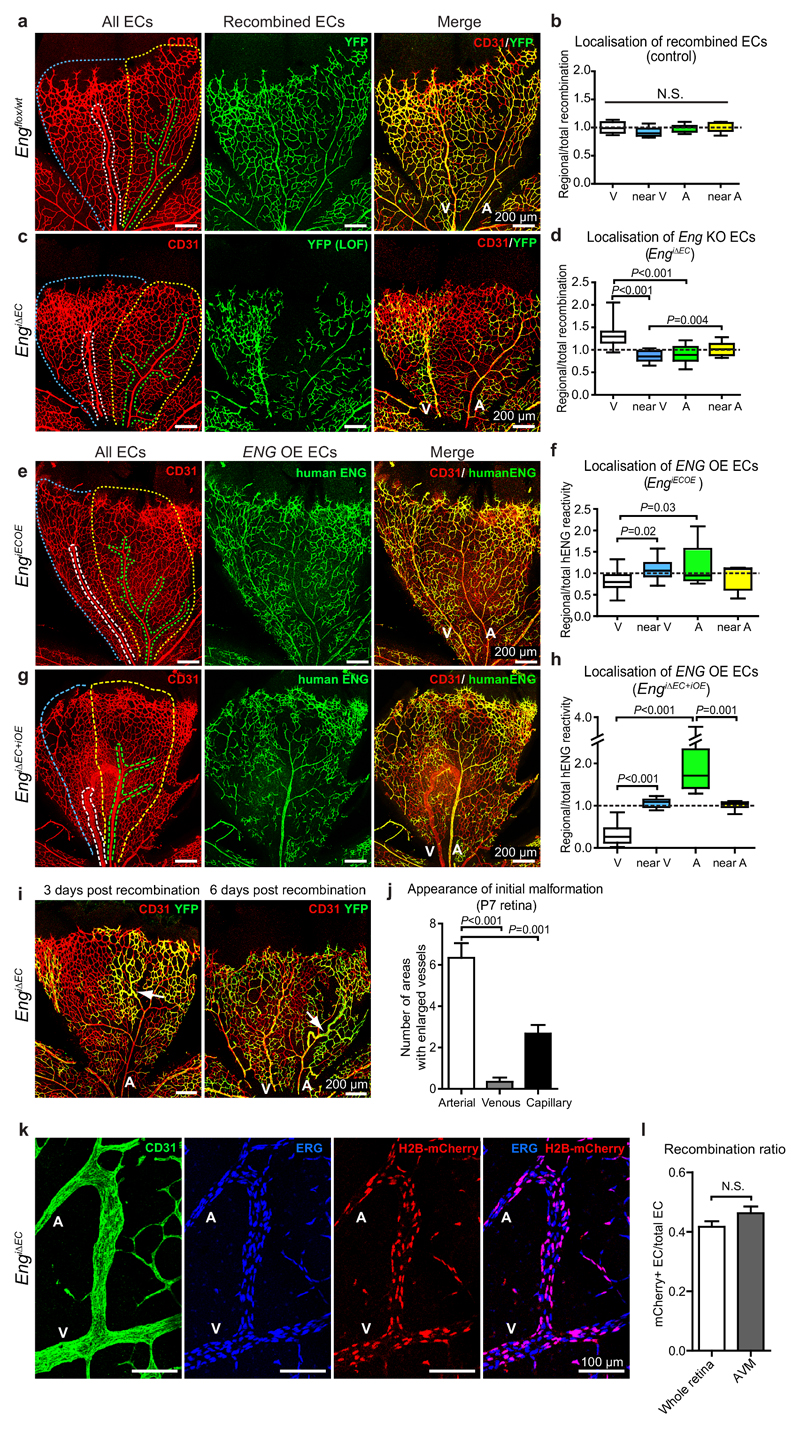
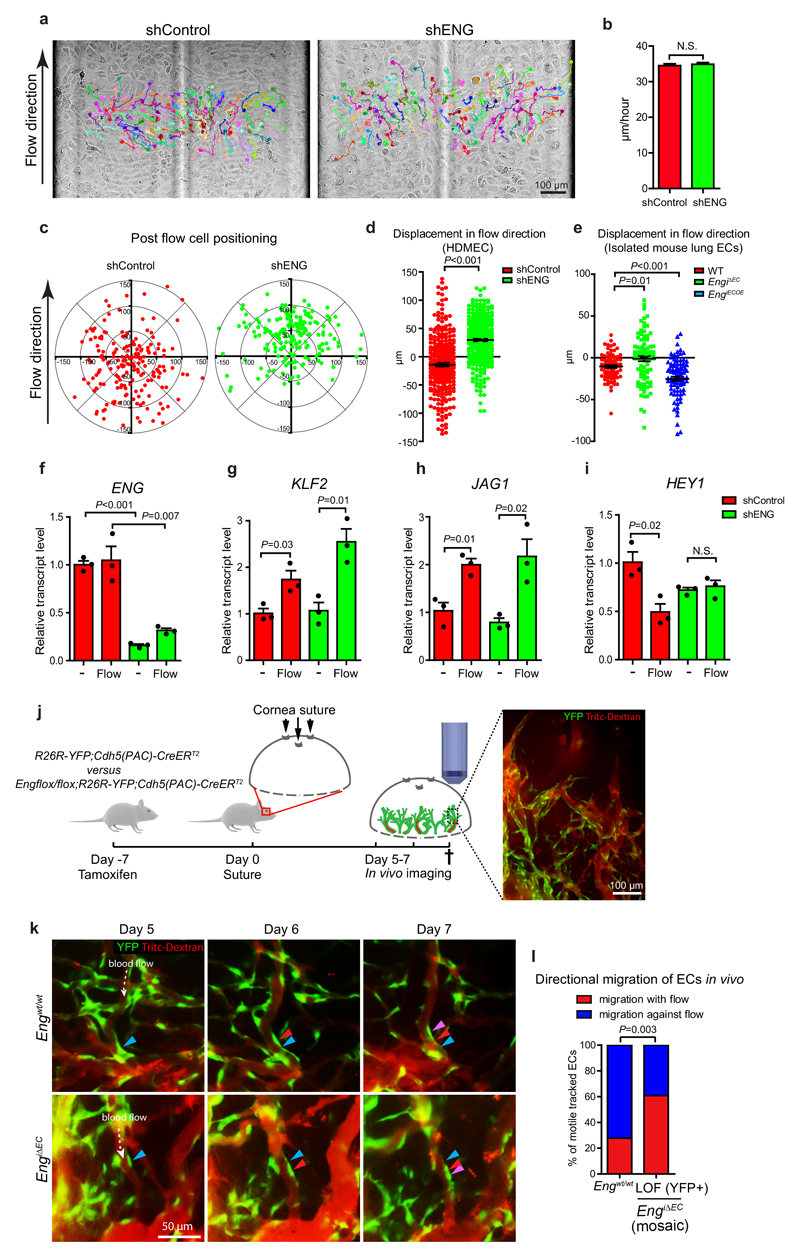
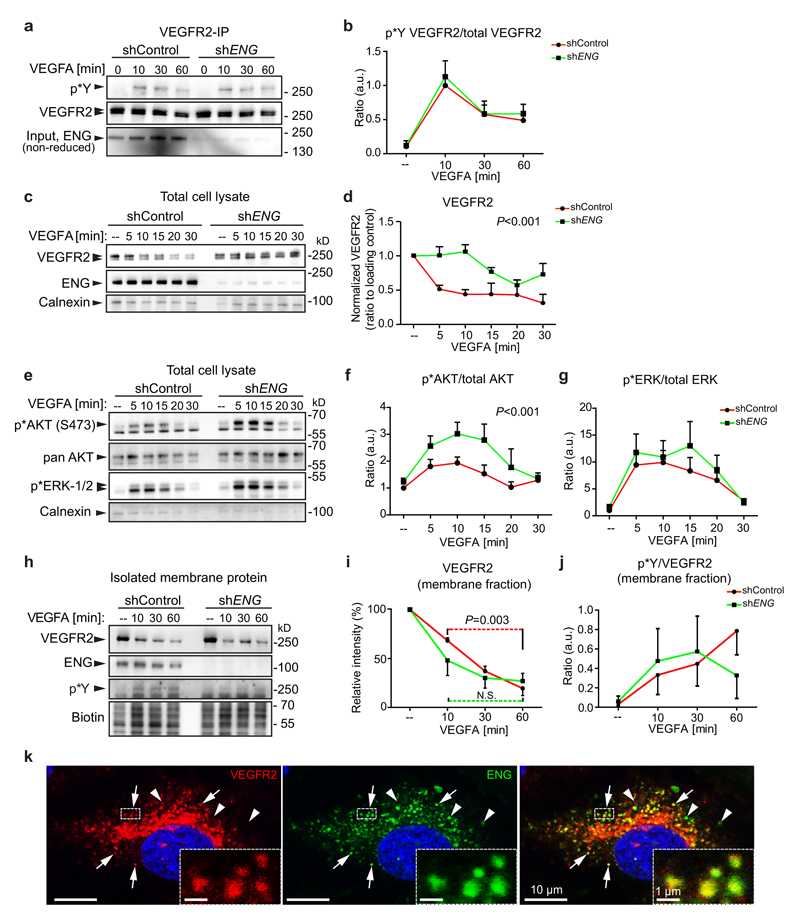
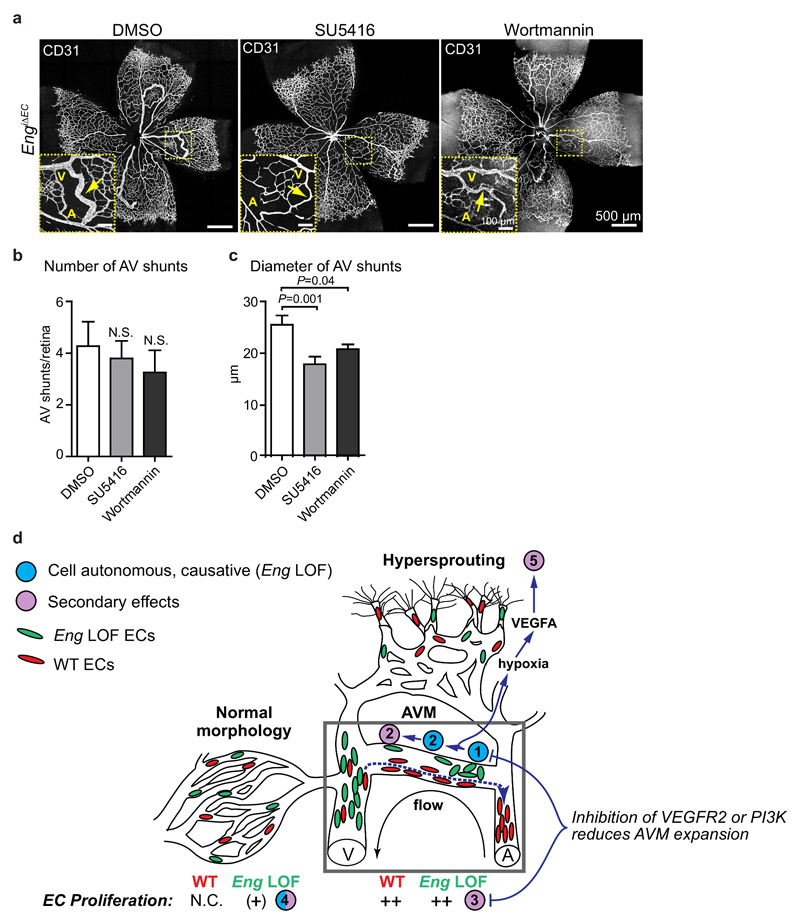
Loss-of-function (LOF) mutations in the endothelial cell (EC)-enriched gene endoglin (ENG) cause the human disease hereditary haemorrhagic telangiectasia-1, characterized by vascular malformations promoted by vascular endothelial growth factor A (VEGFA). How ENG deficiency alters EC behaviour to trigger these anomalies is not understood. Mosaic ENG deletion in the postnatal mouse rendered Eng LOF ECs insensitive to flow-mediated venous to arterial migration. Eng LOF ECs retained within arterioles acquired venous characteristics and secondary ENG-independent proliferation resulting in arteriovenous malformation (AVM). Analysis following simultaneous Eng LOF and overexpression (OE) revealed that ENG OE ECs dominate tip-cell positions and home preferentially to arteries. ENG knockdown altered VEGFA-mediated VEGFR2 kinetics and promoted AKT signalling. Blockage of PI(3)K/AKT partly normalized flow-directed migration of ENG LOF ECs in vitro and reduced the severity of AVM in vivo. This demonstrates the requirement of ENG in flow-mediated migration and modulation of VEGFR2 signalling in vascular patterning.


Conflict of interest statement

Competing Financial Interests

The authors declare no competing financial interests.

Figures

Figure 1
Figure 1. Postnatal EC-specific Eng LOF causes local AVM and secondary sprouting.
(a) The vasculature (CD31, white) within coronal sections of developing brains of control (Engflox/wt, left) and tamoxifen induced Eng LOF (induced P1, EngiΔEC, right) P7 mice. The boxed, zoomed area indicates an AVM following Eng LOF (arrow). Images are representative of five brains analysed for each genotype. Scale bars, 500µm (whole pictures); 100µm (Boxed area). (b) Cortical vasculature of P7 control mice (left) and Eng LOF (right) mice indicating increased tip cell formation. Arrowheads indicate filopodia-rich tip cells. ECs were stained for CD31 (red) and recombination assessed by YFP expression (Yellow). Scale bars, 50µm. (c) Quantification of tip cell numbers of the cerebral vasculature of P7 mice. Ten images were quantified from each brain. Engwt/wt, n=8 mice; EngiΔEC, n=5 mice. P=0.02. (d) Vegfa mRNA levels measured by quantitative PCR from total brain lysates of P7 mice. Engwt/wt, n=4 mice; EngiΔEC, n=3 mice P=0.04. Values are mean ± S.E.M. Significances in (c, d) were determined by two-tailed unpaired t-test. Statistics source data are shown in Supplementary Table 1. (e) The developing retinal vasculature of P7 Engflox/wt (left) and EngiΔEC (right) mice displaying radial expansion (dotted circles), AVMs (boxed) and sprouting front (boxed) within the same retinas following long term or short term Eng LOF. Gene deletion was induced by tamoxifen injection at P1 (upper panel) or P4 (lower panel). Note the different scale in control versus Eng LOF. The dotted circles are of the same absolute size for comparison. A: artery; V: vein. Images are representative of at least 8 retinas analysed. Scale bars, 500µm (whole pictures); 100µm (boxed areas).
Figure 2
Figure 2. Eng expression is suppressed in tip- versus stalk- cells, but promotes tip cell potential.
(a) Retinas from P7 WT mice, stained for ECs (CD31) and for ENG. Dotted white line outlines the sprouting front. Images are representative of 8 retinas analysed. Scale bar, 50µm. (b) Brain vasculature of WT mice at P7, stained for ECs (CD31) and for ENG. Tip cells and their corresponding stalk cells are indicated by colour-coded arrows and arrowheads respectively. Scale bar, 20µm. (c) Quantification of fluorescent intensities of ENG-Immunolabelled brain tip cells and corresponding stalk cells (pairwise connected by lines), n=25 tip and stalk cells each from 5 WT brains. P<0.001. (d, f, h, j) The retinal or brain vasculature of P7 EngiΔEC and EngiΔEC+iOE mice with mosaic recombination. CD31 or GLUT1 immunostaining indicates all ECs. (d, f) Eng LOF cells are identified by the YFP reporter (arrows) and non-recombined WT cells by CD31 only (arrowheads). Scale bars, 200µm (d); 20µm (f). (h, j) ECs with the human ENG transgene were stained for human ENG . ENG OE ECs (arrows) or Eng LOF ECs (arrowheads) in the sprouting front. Scale bars, 200µm (h); 75µm (j). (e, g) Quantification of tip cell competences of recombined (YFP+) or non-recombined (YFP-) ECs within the retinal (e) or brain (g) vasculature of P7 WT or mosaic Eng LOF mice. (e) Control, n=5 retinas; EngiΔEC, n=9 retinas. P<0.001. (g) Control, n=3 mice; EngiΔEC, n=5 mice. P=0.02. (i, k) Quantifications of tip cell competence of LOF or OE (human ENG+) cells within the P7 retinas or cerebral vasculature of EngiΔEC+iOE mice. (i) n=15 retinas. P<0.001. (k) n=19 cerebral areas from 6 mice. P<0.001.(l) Schematic pictures describing the FACS sorting of the Eng LOF and WT EC populations from the cerebral vasculature of the same mouse by the use of Claudin5-GFP and R26R-H2B-mCherry reporters. (m) Changes of gene-expression following Eng deletion were assessed by q-PCR from Eng LOF ECs compared with Eng WT ECs isolated by FACS from EngiΔEC brains of P8-9 mice, n=3 mice each for Eng WT and EngiΔEC. P=0.01 (Id1); P=0.01 (Ephrinb2); P=0.049 (Hey1), between Eng WT and LOF cells in EngiΔEC mice. All values are mean ± S.E.M. Significances in (c, e, g, i, k, m) were determined by two-tailed unpaired t-test. Statistics source data are shown in Supplementary Table 1.
Figure 3
Figure 3. Eng LOF reduces EC migration in sprouting angiogenesis
(a) Representative overview images of EC sprouts (CD31, white) from aortic ring explants cultured in medium with indicated treatments for 48 hours. Scale bars, 200µm. (b) Snapshots from a time-lapse sequence of growing sprouts of an aortic ring with induced nuclear-localized mCherry under the EC-specific Cdh5 promoter (upper panel). Nuclei of individual cells were labelled with colour coded dots for tracking and quantification in ImageJ (lower panel). Scale bar, 50µm. (c) Quantification of the elongation of sprouts during the first 24 hours of treatment. WT control, n=9 sprouts from 3 aortic rings; WT VEGF, n=7 sprouts from 4 aortic rings; EngiΔEC control, n=9 sprouts from 3 aortic rings; EngiΔEC VEGF, n=7 sprouts from 4 aortic rings. P=0.004 between EngiΔEC control and EngiΔEC VEGFA. (d) Quantifications of the diameters of the vascular sprouts on fixed samples. n=45 sprouts from 8-10 rings for each condition. Control, P=0.02; VEGFA, P=0.04, between WT and EngiΔEC. (e-h) Quantifications of cell migration speed and directions during the sprouting process under different conditions reveals reduced migration of Eng LOF ECs (see more details in Methods). WT control, n=22 live imaged cells from 3 aortic rings; WT VEGF, n=26 cells from 4 aortic rings; EngiΔEC control, n=18 cells from 3 aortic rings; EngiΔEC VEGF, n=38 cells from 4 aortic rings. (e) Control, P=0.004; VEGFA, P=0.03, between WT and EngiΔEC. P=0.005 between EngiΔEC control and EngiΔEC VEGFA. (f) WT, P=0.01; EngiΔEC, P<0.001, between control and VEGFA treated samples. (g) WT, P=0.006; EngiΔEC, P=0.001, between control and VEGFA treated samples. (h) Control, P<0.001; VEGFA, P=0.01, between WT and EngiΔEC. P=0.04 between EngiΔEC control and EngiΔEC VEGFA. Data are pooled from 2 independent experiments and represent mean ± S.E.M. Significances in (c-h) were determined by two-tailed unpaired t-test.
Figure 4
Figure 4. Eng LOF mediates context-dependent effects on proliferation.
(a-c) Cerebral vessels of P7 mice carrying a conditional nuclear-localized mCherry under an EC-specific promoter, allowing for identification of recombined ECs (H2B-mCherry, red). Arrowheads indicate proliferating non-recombined ECs (mCherry-, EdU+, ERG+) and arrows indicate proliferating recombined ECs (mCherry+, EdU+, ERG+). Right most panels are overlays of the ones to the left. (a) Normal vasculature of control mice with mosaic mCherry recombination. (b) Morphologically normal vasculature of EngiΔEC mice displaying mosaic recombination. (c) AVM-like structure (outlined by dotted line) of EngiΔEC mice. (d) Quantification of percentage of proliferating recombined and non-recombined ECs out of total ECs in cerebral vessels. Three to five different regions (covering either malformations or normal areas) were counted and summed as one brain for quantification (n=3 mice each for WT and EngiΔEC). P=0.05 (“outside”); P=0.02 (“in AVM”), between Eng WT and LOF cells. Statistics source data are shown in Supplementary Table 1. (e) Quantification of percentage of proliferating recombined and non-recombined ECs out of total ECs in retinal vessels. WT, n=9 retinas; AVM-, n=9 retinas; AVM+, n=12 retinas; AVM regions, n=13 AVMs. P=0.01 (“outside”) between Eng WT and LOF cells. (f) Proliferating ECs in P7 retinas were shown by co-staining for EdU (green), ERG (blue) and CD31. (g) Quantification of proliferation of ECs in the arteries, veins, capillaries and AV shunts in retinas. Arteries, control, n=12 vessels; EngiΔEC without AVM, n=8 vessels; EngiΔEC with AVM, n= 29 vessels. Veins, control, n=12 vessels; EngiΔEC without AVM, n=5 vessels; EngiΔEC with AVM, n= 23 vessels. Capillaries, control, n=12 areas; EngiΔEC without AVM, n=14 areas; EngiΔEC with AVM, n= 24 areas. Initial AV shunts, n=23 vessels. Established AV shunts, n=15 vessels. P=0.05 between arteries in control and EngiΔEC with AVM. P=0.04 between arteries in EngiΔEC without AVM and EngiΔEC with AVM. P<0.01 between initial and established AV shunts. Significances in (d, e, g) were determined by two-tailed unpaired t-test. All values are mean ± S.E.M. N.S.= not significant. Scale bars, 50µm.
Figure 5
Figure 5. Loss- or gain- of ENG alters retinal EC distribution and Eng deletion initiates AVM in arterioles.
(a, c, e, g) P7 retinal vasculature of Engflox/wt:Cdh5(PAC)CreERT2:R26Ryfp (Engflox/wt), EngiΔEC, EngiECOE and EngiΔEC+iOE pups induced with tamoxifen. Vessels were stained for CD31 (red) to indicate all ECs and for YFP to visualize tamoxifen-induced control (Engflox/wt) or LOF ECs (green in a, c). Human ENG were stained to visualize ENG OE cells (green in e, g). Scale bars, 200µm. (b, d) The ratio of regional/total recombination area (YFP+) was calculated for each retinal leaflet containing both an artery and a vein from control (Engflox/wt) or EngiΔEC respectively. Engflox/wt, n=8 retinal regions from 3 mice. EngiΔEC, n=13 retinal regions from 4 mice, P<0.001 between “V” and “A” or “near V”; P=0.004 between “near V” and “near A”. (f, h) The ratio of regional/total percentage of ENG OE cells was calculated for each retinal leaflet containing both an artery and a vein from EngiECOE or EngiΔEC+iOE. EngiECOE, n=11 retinal regions from 5 mice, P=0.03 between “V” and “A”; P=0.02 between “V” and “near V”. EngiΔEC+iOE, n=10 retinal regions from 4 mice, P<0.001 between “V” and “A” or “near V”; P=0.001 between “A” and “near A”. Box plots display values of minimum, first quartile, median, third quartile, and maximum. Regions were segmented as indicated in (a), (c), (e) and (g) where white is venous (V), blue is near vein (near V), green is arterial (A) and yellow near artery (near A). Retinas with 20-80% total recombination were used for the quantification.; (i) Retinal vasculature of EngiΔEC mice at P7, induced for mosaic recombination at either P4 (left) or P1 (right). Arrows indicate abnormal arterioles suggesting initiation of AVMs. Scale bars, 200µm. (j) Quantification of anatomical localization of malformation initiation in P7 retinas following mosaic recombination at P4, n=6 retinas. P<0.001 between arterial and venous regions; P=0.001 between arterial and capillary regions. Data represent mean ± S.E.M. (k) An AVM in a mosaic recombined Eng LOF retina. ECs are stained with CD31 (green) and ERG (blue) antibody. Nuclear localized H2B-mCherry (red) shows ECs with recombination. Scale bars, 100µm. (l) Quantification of recombination ratio of AVMs in the mosaic recombined retinas, compared with the recombination ratio of the whole retinas. 17 AVMs in 5 retinas were quantified. A: artery; V: vein. All values are mean ± S.E.M. Significances in (b, d, f, h, j, l) were determined by two-tailed unpaired t-test. N.S.= not significant.
Figure 6
Figure 6. ENG regulates EC migration in response to shear stress and blood flow.
(a) Bright field images of HDMECs under laminar flow (7.5 dyne/cm2) acquired every 5 minutes for 5 hours. Individual cell tracks and migratory routes are indicated by colours. Scale bar, 100µm. (b) Migration speed of control and ENG knockdown cells. Migration speed of individual cells was calculated as migration distance/time. Control, n=295 cells; shENG, n=287 cells (pooled from 3 experiments per condition) (c) Relative positions of the cells after being subjected to flow for 5 hours. Each dot represents an individual cell with original position set at (0,0). (d) The displacement of HDMECs migration towards direction of flow (Y axis). Data derive from the same experiments as in (b). P<0.001, two-tailed unpaired t-test. (e) The displacement of isolated mouse lung ECs migration towards direction of flow (Y axis). WT, n=83 cells; EngiΔEC, n=89 cells; EngiECOE, n=95 cells (pooled from 2 independent experiments. P=0.01 between WT and EngiΔEC; P<0.001 between WT and EngiECOE, two-tailed unpaired t-test). (f-i) Relative transcript levels of ENG, KLF2, JAG1, HEY1 in control and ENG knockdown cells with or without flow treatment are determined by qPCR. n=3 independent experiments. Statistics source data are shown in Supplementary Table 1. Significances were determined by two-tailed unpaired t-test. (f) P<0.001 (without flow); P=0.007 (Flow), between shControl and shENG. (g) P=0.03 (shControl); P=0.01 (shENG), between “-” and “Flow”. (h) P=0.01 (shControl); P=0.02 (shENG), between “-” and “Flow”. (i) P=0.01 (shControl) between “-” and “Flow”. (j) Schematic pictures describing the timeline of the cornea suture model. Scale bar, 100µm. (k) Representative pictures showing directional migration of ECs in WT and EngiΔEC. Expression of YFP is switched on in subsets of ECs (green). Vessels are visualized by I.V. injection of Tritc-dextran (red). Direction of blood flow is indicated by white arrows. Positions of the cells at day 5, 6 and 7 are indicated by blue, red and purple arrowheads respectively. Scale bar, 50µm. (l) Quantification of percentages of ECs migrating with or against flow direction. Eng WT, n=36 tracked migrating ECs (pooled data from 3 mice); Eng LOF, n=46 tracked migrating ECs (pooled data from 4 mice).P=0.003, Chi-squared test. Error bars represent S.E.M. N.S.=not significant.
Figure 7
Figure 7. ENG affects VEGFR2 trafficking and downstream signalling.
(a) Immunoprecipitation of VEGFR2 with protein samples from VEGF-treated HDMECs lenti-virally transduced with either control shRNA or shRNA targeting ENG. Phosphorylated VEGFR2 was detected by blotting with pTyr antibody. (b) Ratio of Phosphorylated/total VEGFR2 was measured by ImageJ, n=4 independent experiments. (c, d) Western blot of total cell lysates of HDMECs, indicates knockdown of ENG in the shENG condition (non-reduced condition). VEGFA treatment for indicated time points reveals differential loss of VEGFR2 over time in control versus knockdown cells as shown by densitometric analysis relative to the loading control calnexin. P<0.001, 2-way ANOVA, n=3 independent experiments. (e) Total cell lysates of the above analysed for VEGFR2 downstream components p*AKT, pan AKT, p*ERK1/2 and the loading control calnexin. (f, g) Densitometric quantification of p*AKT/total AKT or p*ERK1/2 /total ERK showing potentiated AKT phosphorylation in ENG knockdown ECs (P<0.001, 2-way ANOVA, n=7 independent experiments for time points 0, 10, 30 min; n=3 independent experiments for time points 5, 15, 20 min) and no difference in p* ERK1/2. (h) Cellular membrane proteins were isolated at different time points and analysed for VEGFR2 (note the absence of the intracellular unglycosylated band), ENG, p*Y and total amount (biotin). (i) Densitometric analysis of membrane localised VEGFR2 in (h). Red or green dotted line indicates comparison between 10 and 60 minutes for the control or shENG cells, respectively. n=3 independent experiments. P=0.003 (shControl) between 10 and 60 minutes, two-tailed unpaired t-test. (j) Phosphorylated VEGFR2 within the cell membrane was detected with anti-phospho-Tyrosine antibody (p*Y and ratios of phosphorylated/total VEGFR2 at different time points were plotted. n=3 independent experiments. No difference between shControl and shENG, 2-way ANOVA. (k) Co-staining for VEGFR2 (red) and ENG (green) in HDMECs treated with VEGF (50ng/ml) for 10 min. VEGFR2 and ENG colocalise in subsets of intracellular vesicles (indicated by arrows and the dashed line box). Arrowheads indicate non-colocalising VEGFR2 or ENG. Co-localisation of signals within the boxed region was analysed by Volocity. Images are representative of 3 independent experiments. Scale bars, 10µm (whole pictures); 1µm (boxed areas). Unprocessed scans of the blots shown in (a, c, e, h) are provided in supplementary figure 9. Statistics source data are shown in Supplementary Table 1. a.u. = Arbitrary units.
Figure 8
Figure 8. Effects of VEGFR2 or PI3K inhibition on AVM properties and summary of concepts.
(a) P7 retinas from EngiΔEC mice (tamoxifen injected at P3) treated with SU5416 or Wortmannin at P4-6. Yellow boxes show regions with AVMs (inset). Arrows indicate AVMs. A: artery; V: vein. Scale bars, 500µm (whole pictures); 100µm (boxed areas). (b, c) Quantification of the numbers and the diameters of retinal AVMs from mice treated with DMSO, SU5416 or Wortmannin. (b) DMSO, n=11 retinas; SU5416, n=10 retinas; Wortmannin, n=8 retinas. (c) DMSO, n=41 AV shunts from 11 retinas; SU5416, n=41 AV shunts from 10 retinas; Wortmannin, n=27 AV shunts from 8 retinas. P=0.001 between DMSO and SU5416; P=0.04 between DMSO and Wortmannin, two-tailed unpaired t-test. (d) Schematic summary of findings. Eng LOF disturbs normal allocation and specification of ECs in the developing vasculature by cell-autonomous reduction of flow-directed migration, which leads to initiation of AVM, followed by non-cell autonomous effects on proliferation that contribute to the expansion of the AVM. (1) Lack of flow-sensing by Eng LOF cells (green) prevents normal migration (red cells, blue dotted line) against flow into the main artery thereby leading to (2) clonal cohesion and enlargement of the vessel causing initiation (primary, cell autonomous) and expansion (secondary, non-cell autonomous) of AVM. (3) Highly proliferative ECs including both Eng WT and LOF cells are found in well-established AV shunts. (4) Eng LOF ECs display a cell-autonomous increase in proliferation in the vasculature adjacent to AVM. Proliferation is not affected in mosaic Eng LOF vasculature of retinas lacking AVM. (5) AVMs in turn cause insufficient oxygenation, driving VEGFA production that stimulates sprouting angiogenesis despite the reduced tip cell potency of Eng LOF ECs (green). Eng LOF alters VEGFR2 signalling with potentiated AKT phosphorylation. This may, at least in part, be the underlying cause of the disturbed migratory response, which could explain the protective effects of VEGFR2 inhibition on AVM. N.C., not changed.

Comment in

References

    1. Herbert SP, Stainier DY. Molecular control of endothelial cell behaviour during blood vessel morphogenesis. Nat Rev Mol Cell Biol. 2011;12:551–564. - PMC - PubMed
    1. Udan RS, Vadakkan TJ, Dickinson ME. Dynamic responses of endothelial cells to changes in blood flow during vascular remodeling of the mouse yolk sac. Development. 2013;140:4041–4050. - PMC - PubMed
    1. Olsson AK, Dimberg A, Kreuger J, Claesson-Welsh L. VEGF receptor signalling - in control of vascular function. Nat Rev Mol Cell Biol. 2006;7:359–371. - PubMed
    1. Hellstrom M, et al. Dll4 signalling through Notch1 regulates formation of tip cells during angiogenesis. Nature. 2007 - PubMed
    1. Leslie JD, et al. Endothelial signalling by the Notch ligand Delta-like 4 restricts angiogenesis. Development. 2007;134:839–844. - PubMed

Publication types

MeSH terms

Substances