. 2017 Jul;20(7):960-968.
doi: 10.1038/nn.4566. Epub 2017 May 22.

Causal evidence for retina-dependent and -independent visual motion computations in mouse cortex

Affiliations

Causal evidence for retina-dependent and -independent visual motion computations in mouse cortex

Daniel Hillier et al. Nat Neurosci. 2017 Jul.

Abstract

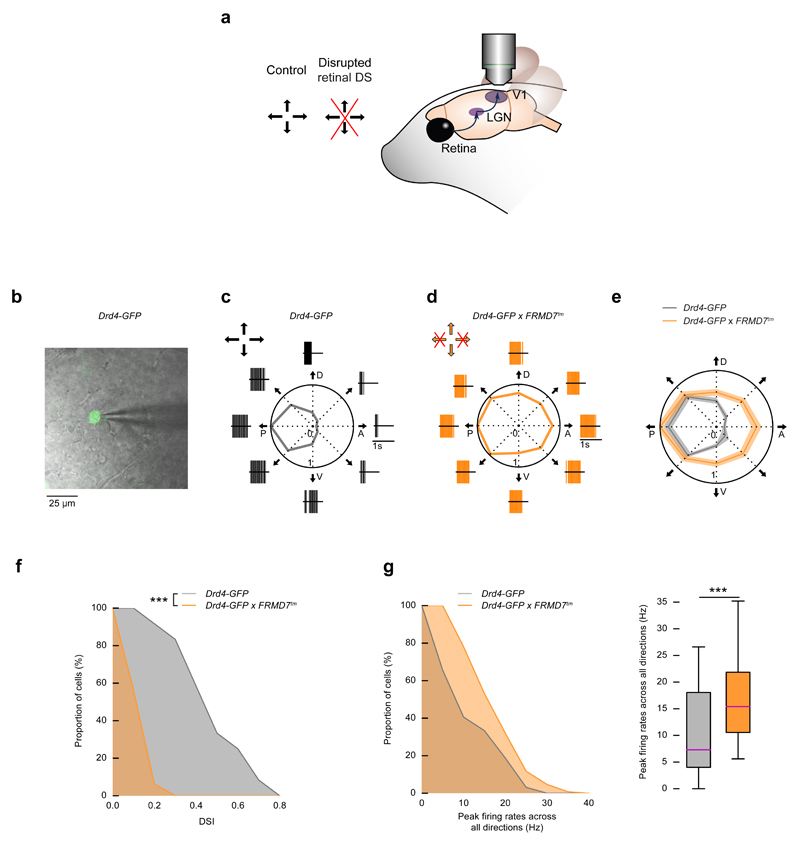
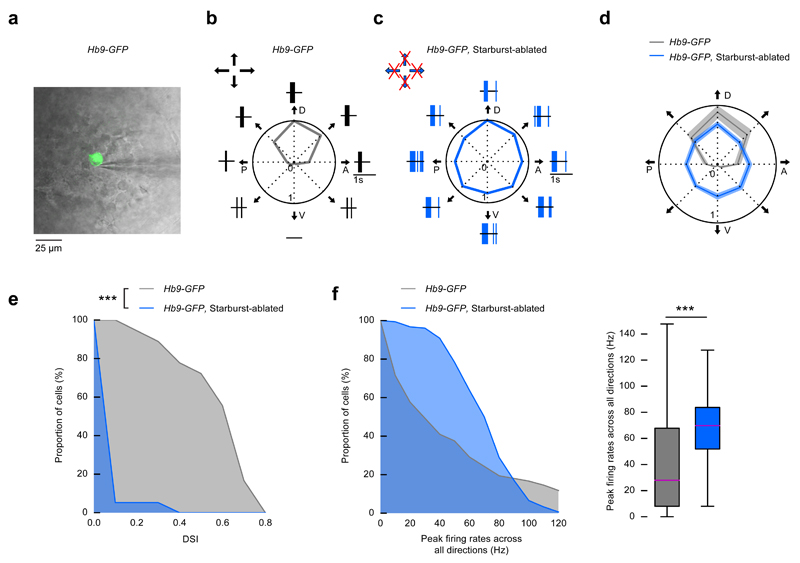
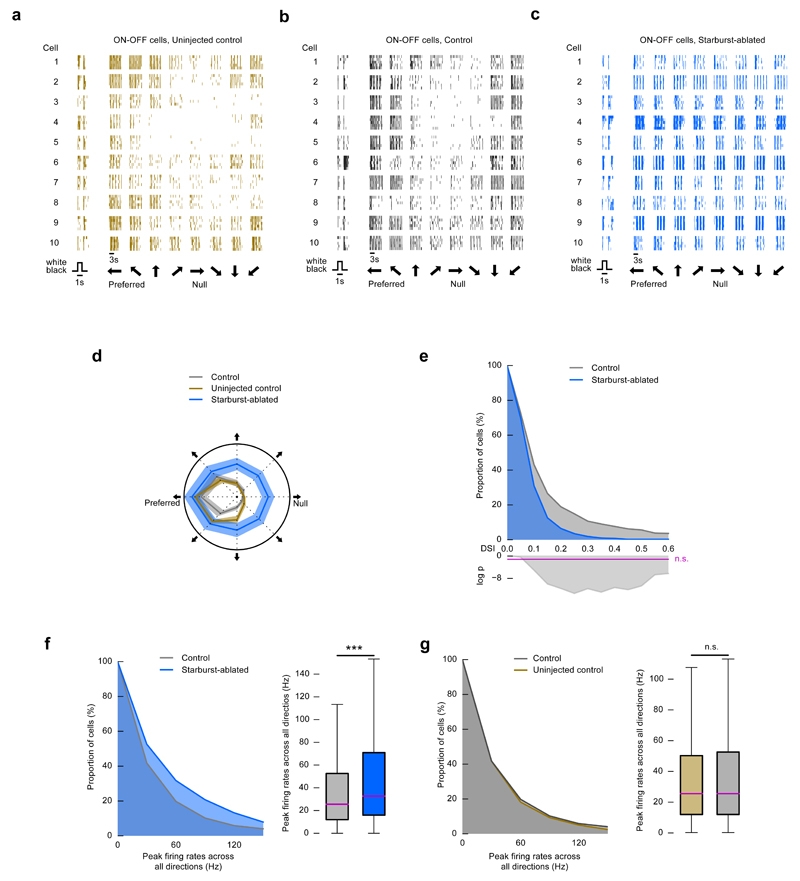
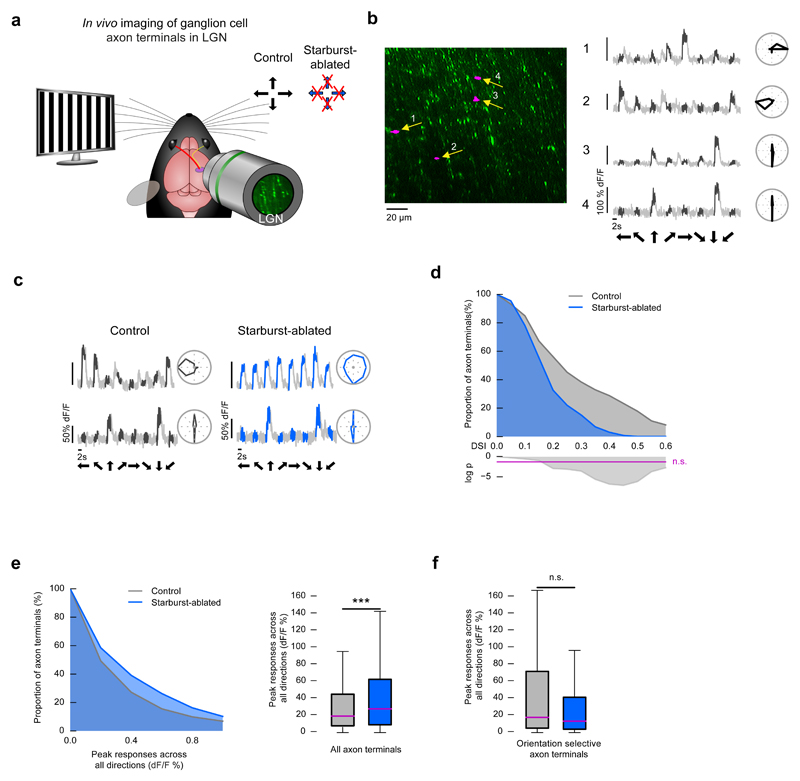
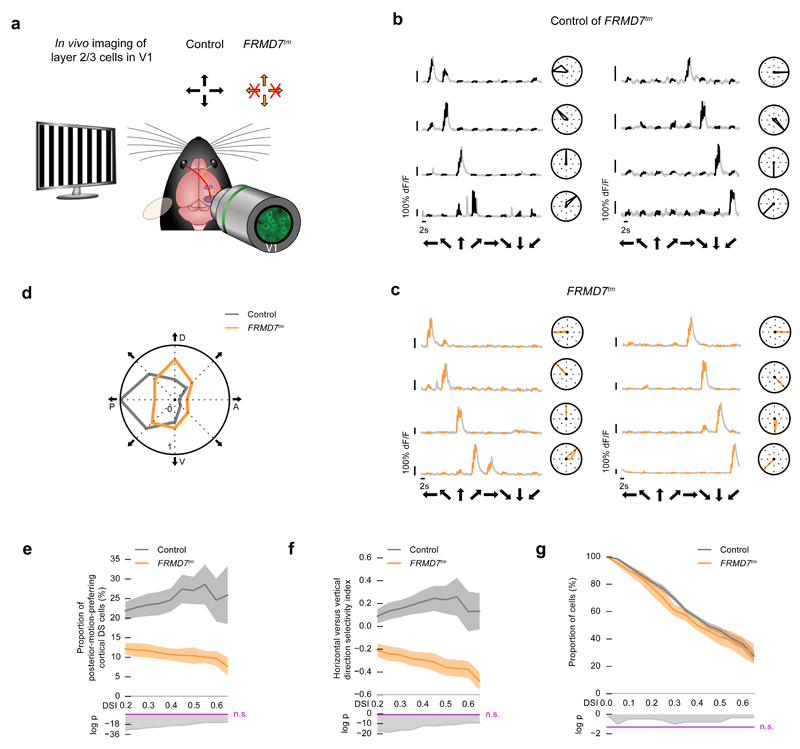
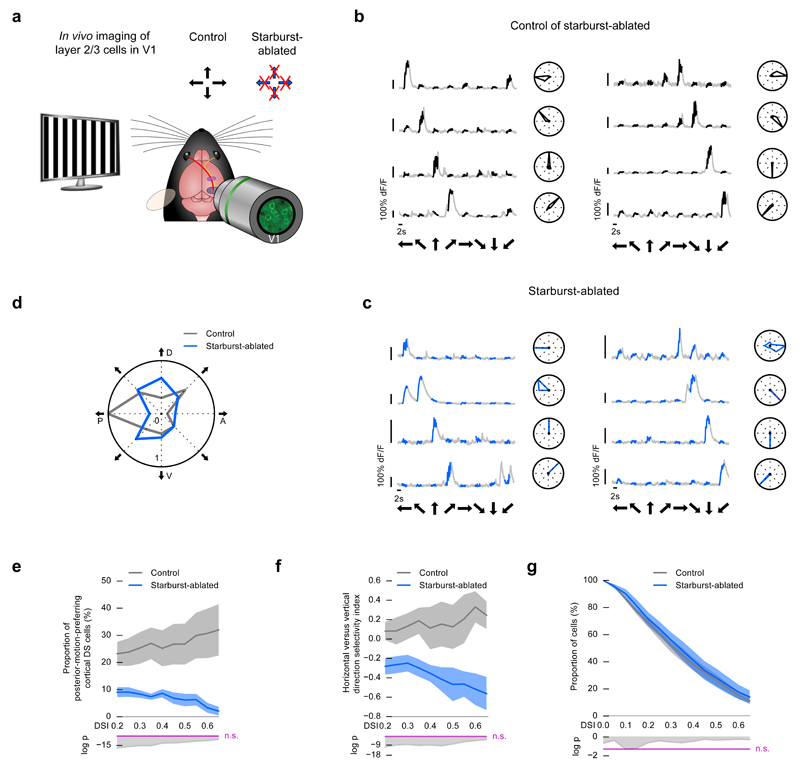
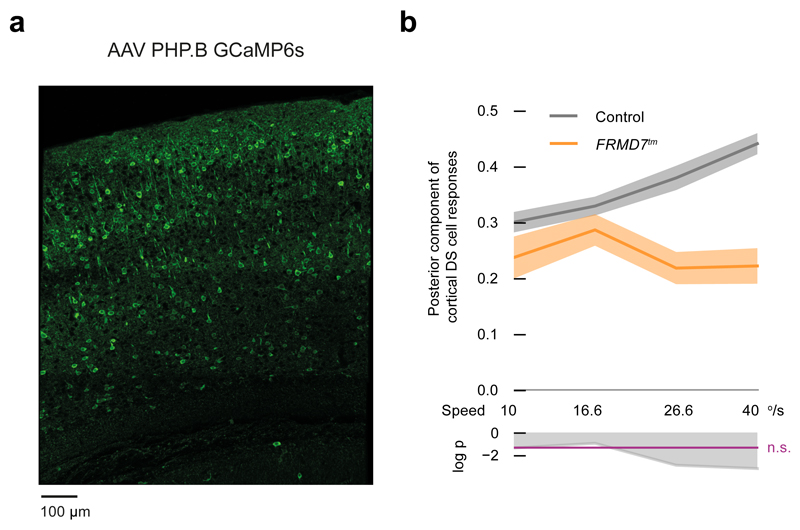
How neuronal computations in the sensory periphery contribute to computations in the cortex is not well understood. We examined this question in the context of visual-motion processing in the retina and primary visual cortex (V1) of mice. We disrupted retinal direction selectivity, either exclusively along the horizontal axis using FRMD7 mutants or along all directions by ablating starburst amacrine cells, and monitored neuronal activity in layer 2/3 of V1 during stimulation with visual motion. In control mice, we found an over-representation of cortical cells preferring posterior visual motion, the dominant motion direction an animal experiences when it moves forward. In mice with disrupted retinal direction selectivity, the over-representation of posterior-motion-preferring cortical cells disappeared, and their responses at higher stimulus speeds were reduced. This work reveals the existence of two functionally distinct, sensory-periphery-dependent and -independent computations of visual motion in the cortex.


Conflict of interest statement

Competing Financial Interest. The authors declare no competing financial interest.

Figures

Figure 1
Figure 1. FRMD7 mutation leads to spiking in all directions in posterior-direction-preferring retinal ON-OFF DS cells.
(a) Schematic of the experimental strategy throughout the paper. In the retina of control mice, ON-OFF DS cells prefer one of four cardinal directions (black arrows). The effect of disrupted retinal direction selectivity (red cross) is recorded in the retina, LGN, and V1. (b-g) Targeted patch clamp recordings in the retina. Control mice: Drd4-GFP, mutant mice: Drd4-GFP × FRMD7tm. (b) A two-photon image of a GFP-labeled ganglion cell (green) in control retina is overlaid with the infrared image of the ganglion cell layer and a patch pipette (grey). (c-d) Example responses from GFP-labeled ganglion cells in control (c) and mutant (d) retinas to a stimulus moving in eight directions (black arrows). P denotes posterior, D dorsal, A anterior, V ventral motion direction in the visual field. Polar plots show the normalized peak firing rates (Methods) in each stimulus direction. Spike raster plots around polar plots show single trial responses. Arrows at the top left corner of c and d indicate the preferred directions of direction selective retinal ganglion cells. Crossed arrows: missing direction selectivity in that direction. (e) Polar plot of the normalized mean of the peak firing rates (Methods) in control and mutant retinas. The width of the grey and orange bands corresponds to 2 × s.e.m. (f) The proportion of GFP-labeled ganglion cells (indicated on the y-axis) with DSI larger than a specified value (indicated on the x-axis) in control and mutant retinas (complementary cumulative distribution of DSI values). (g) Left, complementary cumulative distribution of peak firing rates across all stimulus directions recorded from GFP-labeled ganglion cells in control and mutant retinas. Right, the boxplot representation of the distributions. Bottom and top whiskers: minimum and maximum; bottom and top of the rectangle: first and third quartiles; central line: median.
Figure 2
Figure 2. Starburst cell ablation leads to spiking in all directions in dorsal-direction-preferring retinal ON-OFF DS cells.
(a-f) Control mice: Hb9-GFP injected with DT, starburst-ablated mice: Hb9-GFP × ChAT-Cre × LSL-DTR injected with DT. (a) A two-photon image of a GFP-labeled ganglion cell (green) in control retina is overlaid with the infrared image of the ganglion cell layer and a patch pipette (grey). (b-c) Example responses from GFP-labeled ganglion cells in control (b) and starburst-ablated (c) retinas to a stimulus moving in eight directions (black arrows). P denotes posterior, D dorsal, A anterior, V ventral motion direction in the visual field. Polar plots show the normalized peak firing rates in each stimulus direction. Spike raster plots around polar plots show single trial responses. Arrows at the top left corner of b and c indicate the preferred directions of direction selective retinal ganglion cells. Crossed arrows: missing direction selectivity in that direction. (d) Polar plot of the normalized mean of the peak firing rates of all the recorded cells in control and starburst-ablated retinas. The width of the grey and blue bands corresponds to 2 × s.e.m. (e) Complementary cumulative distributions of DSI values of recorded GFP-labeled ganglion cells in control and starburst-ablated retinas. (f) Left, complementary cumulative distributions of peak firing rates across all stimulus directions recorded from GFP-labeled ganglion cells in control and starburst-ablated retinas. Right, the boxplot representation of the distributions. Bottom and top whiskers: minimum and maximum; bottom and top of the rectangle: first and third quartiles; central line: median.
Figure 3
Figure 3. Direction selectivity is largely reduced in starburst-ablated retinas.
(a-g) Microelectrode array recordings of the retina. Uninjected control mice: wild type, control mice: wild type injected with DT, starburst-ablated mice: ChAT-Cre × LSL-DTR injected with DT. (a-c) Example responses from ten ON-OFF ganglion cells in uninjected control (a), control (b), and mutant (c) retinas to a flashed positive-contrast stimulus (timing is shown at the bottom) and a stimulus moving in eight directions (black thick arrows at the bottom). During motion stimulation, each block shows the response of a cell to motion in one of eight different directions. Each block has five rows representing five responses of the same cell to repeated stimulus presentations. Vertical lines mark spike occurrences. (d) Polar plot of the normalized mean of the peak firing rates of the recorded cells (a-c) in uninjected control, control, and mutant retinas. The width of the grey, blue and brown bands corresponds to 2 × s.e.m. (e) Top, the complementary cumulative distribution of DSI values of recorded ganglion cells in control and starburst-ablated mice. Bottom, the logarithm of p values comparing the pairs of conditions using Fisher’s exact test. Values above the magenta line are non-significant. (f) Left, complementary cumulative distributions of peak firing rates across all stimulus directions in control and starburst-ablated retinas. Right, the boxplot representation of the distributions. Bottom and top whiskers: minimum and maximum; bottom and top of the rectangle: first and third quartiles; central line: median. (g) Left, complementary cumulative distributions of peak firing rates across all stimulus directions in uninjected control and control retinas. Right, the boxplot representation of the distributions.
Figure 4
Figure 4. Starburst ablation reduces direction selectivity in retinal ON-OFF DS cells in vivo.
(a-f) Two-photon imaging of ganglion cell axon terminals in the LGN. Control mice: wild type injected with DT, starburst-ablated mice: ChAT-Cre × LSL-DTR injected with DT. (a) Schematic of the experiment in the LGN. The stimulus was a grating drifting in eight directions. Responses of ganglion cell terminals in the LGN were measured in control and starburst-ablated mice. Arrows at the top right corner indicate the preferred directions of direction selective retinal ganglion cells. Crossed arrows: missing direction selectivity in that direction. (b) Left, two-photon image of GCaMP6s-labeled retinal ganglion cell axons in the LGN. Middle, examples of responses measured from control ganglion cell axon terminals corresponding to the labeled regions on the image (magenta regions indicated by yellow arrows). Here and in subsequent panels, the black part of a grey trace shows the response during image motion in control mice and black arrows below the traces show the stimulus direction. Right: polar plots of response magnitudes normalized to the response in the preferred direction. (c) Responses to motion, and polar plots of responses of two retinal ganglion cell axon terminals recorded in the LGN of control (left) and starburst-ablated (right) mice. Blue part of the grey trace shows the response during image motion in starburst-ablated mice. Right of each curve: polar plots of response magnitudes normalized to the response in the preferred direction. (d) Top, complementary cumulative distributions of DSI values of recorded ganglion cell axon terminals in control and starburst-ablated mice. Bottom, the logarithm of p values comparing the pairs of conditions using Fisher’s exact test. Values above the magenta line are non-significant. (e) Left, complementary cumulative distributions of peak responses across all stimulus directions in ganglion cell axon terminals of control and starburst-ablated mice. Right, boxplot representation of the distributions. Bottom and top whiskers: minimum and maximum; bottom and top of the rectangle: first and third quartiles; central line: median. (f) Boxplot representation of the distributions of peak responses across all stimulus directions within vertically oriented orientation-selective responses in control (grey) and starburst-ablated (blue) mice.
Figure 5
Figure 5. Disrupting retinal direction selectivity decreases the proportion of posterior-motion-preferring cortical DS cells in FRMD7tm mice.
(a) Schematic of the experiment in the cortex. Two-photon imaging cells in layer 2/3 of V1 in control mice and in FRMD7tm mice with disrupted retinal direction selectivity along the horizontal axis. The stimulus was a grating drifting in eight directions. Arrows at the top right corner indicate the preferred directions of direction selective retinal ganglion cells. Crossed arrows: missing direction selectivity in that direction. (b-g) Control mice: wild type, mutant mice: FRMD7tm. (b-c) Example responses from cortical DS cells recorded in control (b) and FRMD7tm (c) mice. Black (b) or orange (c) part of a grey trace shows the response during image motion. Black arrows below the traces show the stimulus direction. Right: polar plots of response magnitudes normalized to the response in the preferred direction. (d) Polar plot showing the proportion of cortical DS cells preferring each of the stimulus directions in control and mutant mice. The proportions are normalized to the largest proportion across the two conditions. Cells with DSI > 0.5 are included in the plot. P denotes posterior, D dorsal, A anterior, V ventral motion direction in the visual field. (e) Top, proportion of posterior-motion-preferring cortical DS cells in control and mutant mice. Dark curves show mean values, shaded areas show ±s.e.m around the means. Bottom, the logarithm of p values comparing the conditions using Fisher’s exact test. Values above the magenta line are non-significant. The DSI values shown along the horizontal axis denote the DSI thresholds defining cells as direction selective. (f) Top, horizontal versus vertical direction selectivity index in control and mutant mice (Methods). Bottom, the logarithm of p values comparing the conditions using Fisher’s exact test. Values above the magenta line are non-significant. The DSI values shown along the horizontal axis denote the DSI thresholds defining cells as direction selective. (g) Top, complementary cumulative distributions of DSI values of recorded cells in control and mutant mice. Bottom, the logarithm of p values comparing the conditions using Fisher’s exact test. Values above the magenta line are non-significant.
Figure 6
Figure 6. Disrupting retinal direction selectivity decreases the proportion of posterior-motion-preferring cortical DS cells in starburst-ablated mice.
(a) Schematic of the experiment in the cortex. Two-photon imaging cells in layer 2/3 of V1 in control mice and in starburst-ablated mice with disrupted retinal direction selectivity along both the horizontal and the vertical axes. The stimulus was a grating drifting in eight directions. Arrows at the top right corner indicate the preferred directions of direction selective retinal ganglion cells. Crossed arrows: missing direction selectivity in that direction. (b-g) Control mice: wild type injected with DT, starburst-ablated mice: ChAT-Cre × LSL-DTR injected with DT. (b-c) Example responses from cortical DS cells recorded in control (b) and starburst-ablated (c) mice. Black (b) or blue (c) part of a grey trace shows the response during image motion. Black arrows below the traces show the stimulus direction. Right: polar plots of response magnitudes normalized to the response in the preferred direction. (d) Polar plot showing the proportion of cortical DS cells preferring each of the stimulus directions in control and starburst-ablated mice. The proportions are normalized to the largest proportion across the two conditions. Cells with DSI > 0.5 are included in the plot. P denotes posterior, D dorsal, A anterior, V ventral motion direction in the visual field. (e) Top, proportion of posterior-motion-preferring cortical DS cells in control and starburst-ablated mice. Dark curves show mean values, shaded areas show ±s.e.m around the means. Bottom, the logarithm of p values comparing the conditions using Fisher’s exact test. Values above the magenta line are non-significant. The DSI values shown along the horizontal axis denote the DSI thresholds defining cells as direction selective. (f) Top, horizontal versus vertical direction selectivity index in control and starburst-ablated mice. Bottom, the logarithm of p values comparing the conditions using Fisher’s exact test. Values above the magenta line are non-significant. The DSI values shown along the horizontal axis denote the DSI thresholds defining cells as direction selective. (g) Top, complementary cumulative distributions of DSI values of recorded cells in control and mutant mice. Bottom, the logarithm of p values comparing the conditions using Fisher’s exact test. Values above the magenta line are non-significant.
Figure 7
Figure 7. Posterior component of cortical DS cell responses is reduced at high stimulus speeds in FRMD7tm mice.
(a) Intravenous injection of AAV serotype PHP.B yields widespread expression of GCaMP6s in the cortex. Cortical slice stained with anti-GFP antibody (representing GCaMP6s expression) is shown. (b) Control mice: wild type, mutant mice: FRMD7tm. Top, posterior component of the responses of cortical DS cells (Methods). Dark curves show mean values, shaded areas show ±s.e.m around the means. Bottom, the logarithm of p values comparing the conditions using the Mann-Whitney U test. Values above the magenta line are non-significant. The horizontal axis denotes the speed of the stimulus. Cells with DSI > 0.5 are included in the plot.

Comment in

References

    1. Hubel DH, Wiesel TN. Receptive fields of single neurones in the cat’s striate cortex. J Physiol. 1959;148:574–591. - PMC - PubMed
    1. Hubel DH, Wiesel TN. Receptive fields, binocular interaction and functional architecture in the cat’s visual cortex. The Journal of physiology. 1962;160:106. - PMC - PubMed
    1. Priebe NJ, Ferster D. Direction selectivity of excitation and inhibition in simple cells of the cat primary visual cortex. Neuron. 2005;45:133–145. - PubMed
    1. Stanley GB, et al. Visual Orientation and Directional Selectivity through Thalamic Synchrony. J Neurosci. 2012;32:9073–9088. - PMC - PubMed
    1. Wei W, Feller MB. Organization and development of direction-selective circuits in the retina. Trends Neurosci. 2011;34:638–645. - PMC - PubMed