

Genome-wide association meta-analysis of 78,308 individuals identifies new loci and genes influencing human intelligence
- PMID: 28530673
- PMCID: PMC5665562
- DOI: 10.1038/ng.3869
Genome-wide association meta-analysis of 78,308 individuals identifies new loci and genes influencing human intelligence
Erratum in
-
Erratum: Genome-wide association meta-analysis of 78,308 individuals identifies new loci and genes influencing human intelligence.Nat Genet. 2017 Sep 27;49(10):1558. doi: 10.1038/ng1017-1558c. Nat Genet. 2017. PMID: 28951626 No abstract available.
Abstract
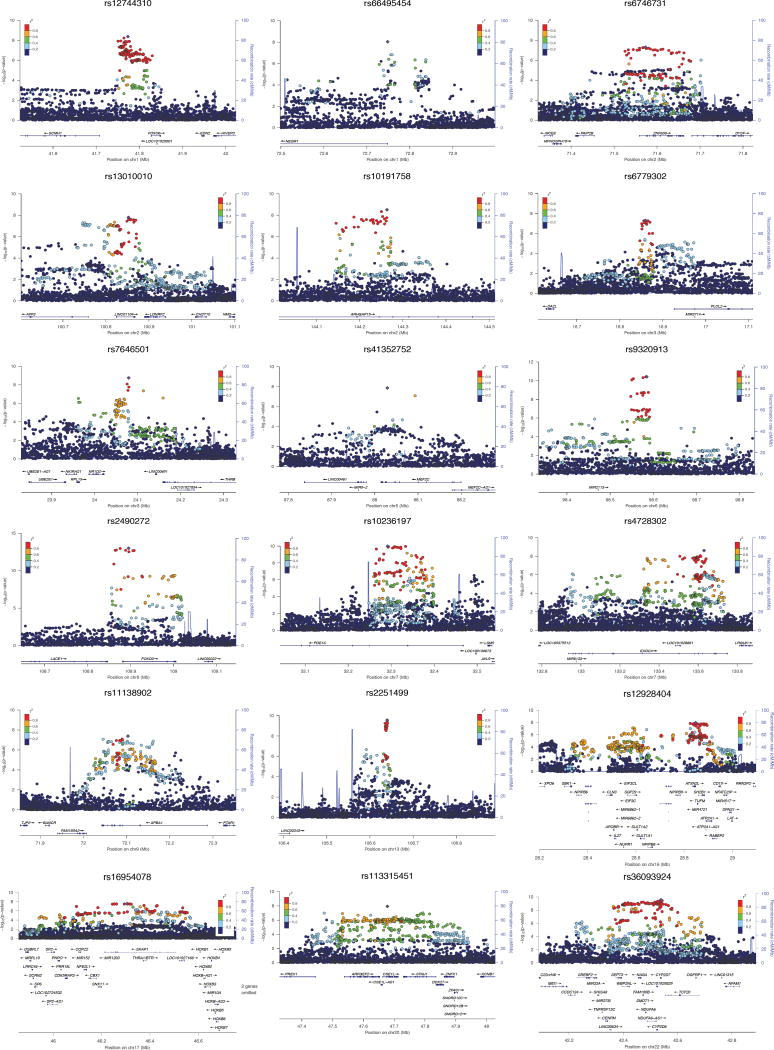
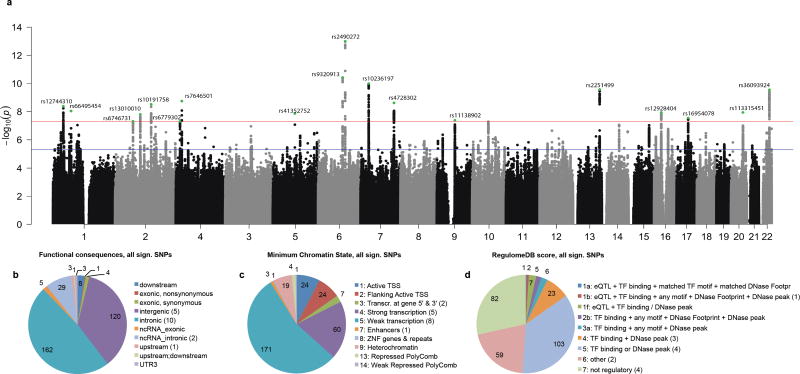
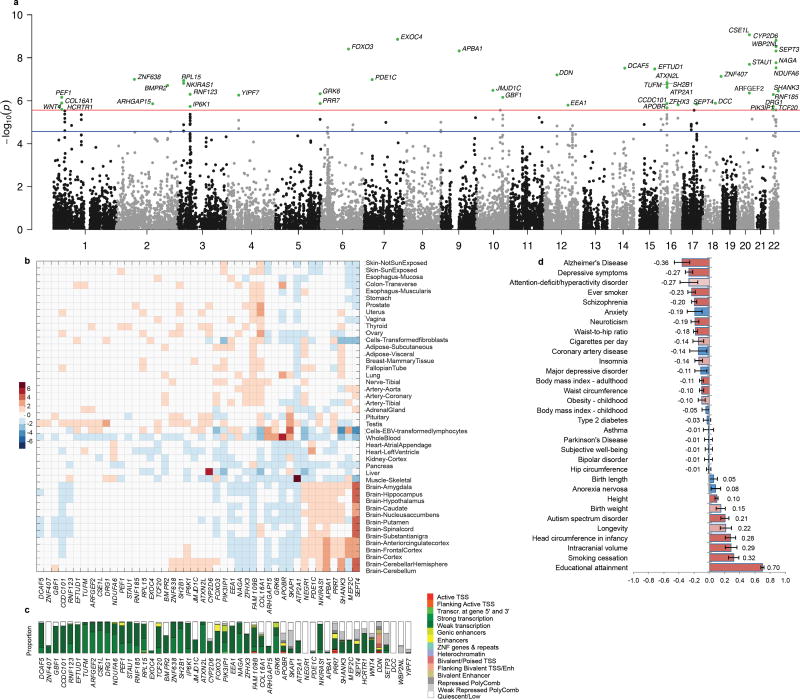
Intelligence is associated with important economic and health-related life outcomes. Despite intelligence having substantial heritability (0.54) and a confirmed polygenic nature, initial genetic studies were mostly underpowered. Here we report a meta-analysis for intelligence of 78,308 individuals. We identify 336 associated SNPs (METAL P < 5 × 10⁻⁸) in 18 genomic loci, of which 15 are new. Around half of the SNPs are located inside a gene, implicating 22 genes, of which 11 are new findings. Gene-based analyses identified an additional 30 genes (MAGMA P < 2.73 × 10⁻⁶), of which all but one had not been implicated previously. We show that the identified genes are predominantly expressed in brain tissue, and pathway analysis indicates the involvement of genes regulating cell development (MAGMA competitive P = 3.5 × 10⁻⁶). Despite the well-known difference in twin-based heritability for intelligence in childhood (0.45) and adulthood (0.80), we show substantial genetic correlation (rg = 0.89, LD score regression P = 5.4 × 10⁻²⁹). These findings provide new insight into the genetic architecture of intelligence.
Conflict of interest statement
The other authors declare no competing financial interests.
Figures
Comment in
-
Intelligence research should not be held back by its past.Nature. 2017 May 22;545(7655):385-386. doi: 10.1038/nature.2017.22021. Nature. 2017. PMID: 28541341 No abstract available.
References
Publication types
MeSH terms
Substances
Grants and funding
- R37 AA009367/AA/NIAAA NIH HHS/United States
- G0900753/MRC_/Medical Research Council/United Kingdom
- R01 AA009367/AA/NIAAA NIH HHS/United States
- MC_QA137853/MRC_/Medical Research Council/United Kingdom
- R01 AA011886/AA/NIAAA NIH HHS/United States
- G0901245/MRC_/Medical Research Council/United Kingdom
- R01 DA024417/DA/NIDA NIH HHS/United States
- G19/2/MRC_/Medical Research Council/United Kingdom
- MR/K002279/1/MRC_/Medical Research Council/United Kingdom
- T32 MH016880/MH/NIMH NIH HHS/United States
- G0500079/MRC_/Medical Research Council/United Kingdom
- F31 DA029377/DA/NIDA NIH HHS/United States
- R01 DA005147/DA/NIDA NIH HHS/United States
- R01 DA036216/DA/NIDA NIH HHS/United States
- EP-C-14-005/EPA/EPA/United States
- U01 DK066134/DK/NIDDK NIH HHS/United States
- MR/M021475/1/MRC_/Medical Research Council/United Kingdom
- R01 MH066140/MH/NIMH NIH HHS/United States
- R37 DA005147/DA/NIDA NIH HHS/United States
- G0600237/MRC_/Medical Research Council/United Kingdom
- G0100594/MRC_/Medical Research Council/United Kingdom
- T32 AG000186/AG/NIA NIH HHS/United States
- BB/F022441/1/BB_/Biotechnology and Biological Sciences Research Council/United Kingdom
- G0901461/MRC_/Medical Research Council/United Kingdom
- R01 DA013240/DA/NIDA NIH HHS/United States
- 647648/ERC_/European Research Council/International
LinkOut - more resources
Full Text Sources
Other Literature Sources
Research Materials
