. 2017 Jul;18(7):791-799.
doi: 10.1038/ni.3755. Epub 2017 May 22.

The microRNA miR-31 inhibits CD8+ T cell function in chronic viral infection

Affiliations

The microRNA miR-31 inhibits CD8+ T cell function in chronic viral infection

Howell F Moffett et al. Nat Immunol. 2017 Jul.

Erratum in

Abstract

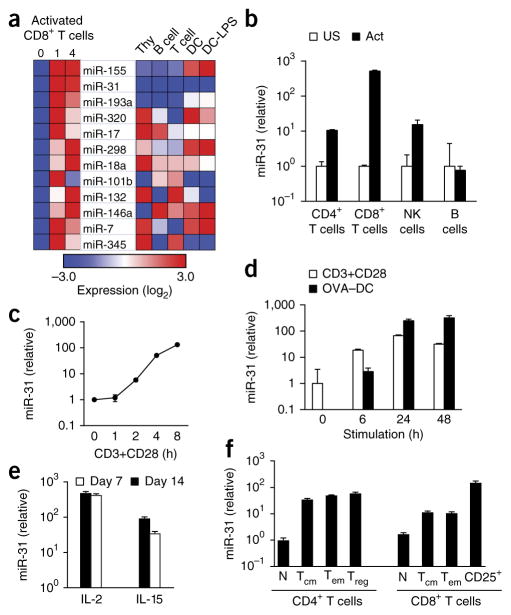
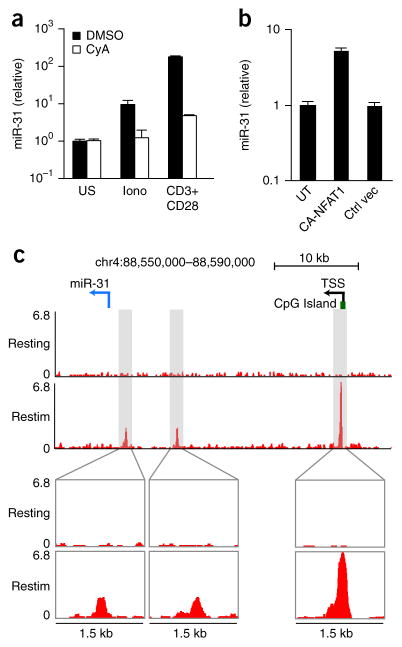
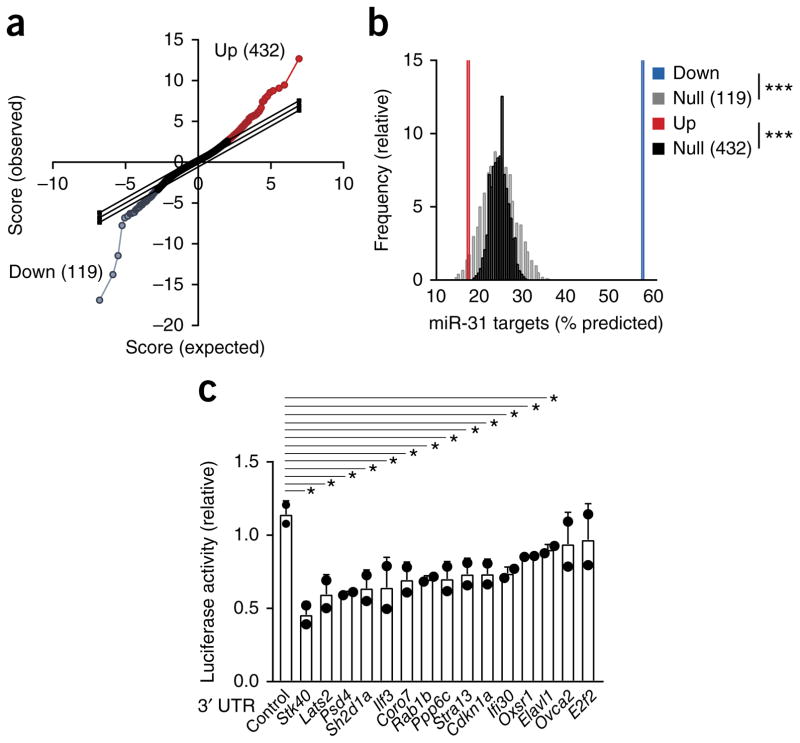
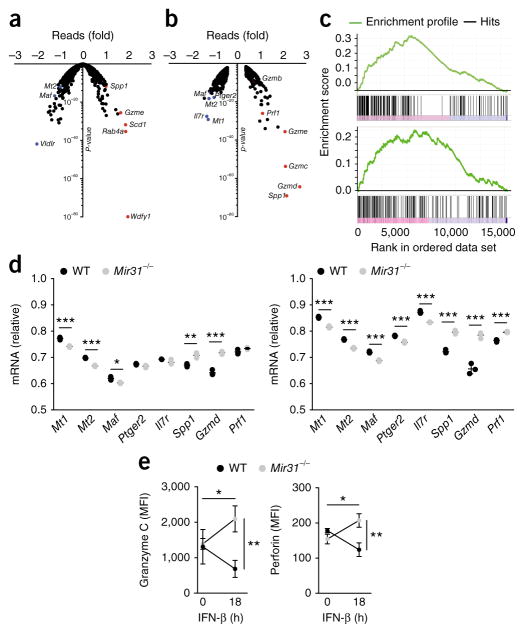
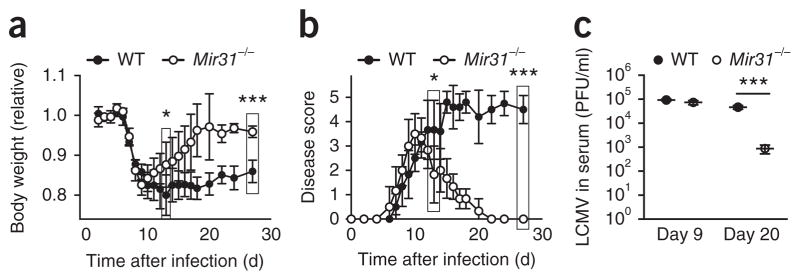
During infection, antigen-specific T cells undergo tightly regulated developmental transitions controlled by transcriptional and post-transcriptional regulation of gene expression. We found that the microRNA miR-31 was strongly induced by activation of the T cell antigen receptor (TCR) in a pathway involving calcium and activation of the transcription factor NFAT. During chronic infection with lymphocytic choriomeningitis virus (LCMV) clone 13, miR-31-deficent mice recovered from clinical disease, while wild-type mice continued to show signs of disease. This disease phenotype was explained by the presence of larger numbers of cytokine-secreting LCMV-specific CD8+ T cells in miR-31-deficent mice than in wild-type mice. Mechanistically, miR-31 increased the sensitivity of T cells to type I interferons, which interfered with effector T cell function and increased the expression of several proteins related to T cell dysfunction during chronic infection. These studies identify miR-31 as an important regulator of T cell exhaustion in chronic infection.


Conflict of interest statement

COMPETING FINANCIAL INTERESTS

The authors declare no competing financial interests.

Figures

Figure 1
Figure 1
miR-31 is induced during T cell activation. (a) miRNAs (middle) with an increase in expression of more than twofold following activation of CD8+ T cells for 1–4 d with anti-CD3 plus anti-CD28, relative to that of unstimulated cells (day 0) (left), and expression of those miRNAs in total thymocytes (Thy), B cells, T cells, bone-marrow-derived DCs (DC) and LPS-treated DCs (DC-LPS) (right), presented as row-normalized relative expression (log2). (b) qPCR analysis of miR-31 in CD4+ or CD8+ T cells activated (Act) for 24 h with anti-CD3 plus anti-CD28, NK cells activated for 24 h with PMA and ionomycin, and B cells activated for 24 h with an antibody to immunoglobulin M and CpG; results are presented relative to those of the unstimulated counterparts (US). (c) qPCR analysis of miR-31 in CD8+ T cells activated for 0–8 h (horizontal axis) with anti-CD3 plus anti-CD28 (CD3+CD28); results are presented relative to those at 0 h. (d) qPCR analysis of mir-31 in OT-I T cells activated for 0–48 h (horizontal axis) with anti-CD3 plus anti-CD28 (CD3+CD28) or by co-culture with OVA-peptide-pulsed DCs (OVA–DC) (T cell/DC ratio, 1:1) (key); results presented as in c. (e) qPCR analysis of mir-31 in OT-I CD8+ T cells activated for 48 h by OVA-peptide-pulsed splenocytes, then treated for 7 or 14 d (key) with IL-2 or IL-15 (horizontal axis); results are presented relative to those of untreated cells. (f) qPCR analysis of mir-31 in naive (CD44loCD62L+) T cells (N), effector memory (CD44hiCD62L) T cells (TEM), central memory (CD44hiCD62L+) T cells (TCM), regulatory (CD4+CD25+GITR+) T cells (Treg), and activated CD8+ (CD8+CD25+) T cells (CD25+), with all CD4+ or CD8+ subsets (horizontal axis) sorted ex vivo; results are presented relative to those of naive T cells. Data are representative of one experiment (a), three experiments (b; error bars, s.d.) or two experiments (cf; error bars (df), s.d.).
Figure 2
Figure 2
mir-31 is induced by signaling via calcium and NFAT. (a) qPCR analysis of miR-31 in CD8+ T cells stimulated for 24 h with ionomycin (Iono) or with anti-CD3 plus anti-CD28 (horizontal axis) and treated with vehicle (DMSO) or cyclosporin A (CyA) (key); results are presented relative to those of unstimulated cells. (b) qPCR analysis of mR-31 in T cells infected with a lentiviral vector driving expression of constitutively active NFAT1 (CA-NFAT1) or a control lentiviral vector (Ctrl vec); results are presented relative to those of untransduced CD8+ T cells (UT). (c) Chromatin-immunoprecipitation analysis of NFAT1 in CD8+ T cells activated with anti-CD3 plus anti-CD28, followed by population expansion for 6 d in medium containing IL-2, then left untreated (Resting) or re-stimulated for 1 h with PMA and ionomycin (Restim) (left margin). Below, enlargement of three areas of enrichment for NFAT-1 binding detected in re-stimulated cells by the HOMER suite of tools for motif discovery. Top, positions of the pre-miR-31 hairpin (blue arrow, location and direction of transcription), the CpG island, and the predicted transcription start site (TSS) of Mir31. Data are representative of two experiments (error bars (a,b), s.d.).
Figure 3
Figure 3
Microarray profiling reveals targets of miR-31 in primary CD8+ T cells. (a) Microarray analysis of gene expression in CD8+ T cells transduced with lenti-miR31 relative to that of cells transduced with lenti-eGFP (T scores): diagonal lines indicate expected null distribution (middle line) and significance cutoffs (top and bottom lines); colors indicate probes significantly downregulated (blue) or upregulated (red), as determined by the SAM (significance analysis of microarrays) technique; in parentheses, number of upregulated probes (Up; top right) or downregulated probes (Down; bottom left). (b) Frequency of predicted miR-31 target genes among the 119 downregulated probes and 432 upregulated probes in a (key), and matching null distributions generated from probes not expressed differentially (Null). ***P < 0.001, up- or downregulated probe versus the corresponding null distribution (one-sample t-test). (c) Luciferin bioluminescence assay of cells transduced with a luciferase reporter gene containing no 3′ UTR (Control) or the 3′ UTR of predicted miR-31 target genes (horizontal axis), in the presence of exogenous miR-31; results are presented relative to those obtained in the absence of exogenous miR-31. Each symbol represents an individual experiment. *P = 0.008, 0.02, 0.007, 0.02, 0.04, 0.03, 0.01, 0.03. 0.03, 0.03, 0.01, 0.02 or 0.04 (left to right), versus control reporter (unpaired one-tailed Student’s t-test). Data are representative of one experiment (a,b) or three experiments (c; mean + s.d.).
Figure 4
Figure 4
miR-31 limits CD8+ T cell effector programs and enhances exhaustion following stimulation with IFN-β. (a,b) RNA-seq analysis of wild-type and Mir31−/− CD8+ T cells activated with beads coated with anti-CD3 plus anti-CD28 and then cultured for 7 d in IL-2, then left unstimulated (a) or stimulated for 18 h with IFN-β (b); results for Mir31−/− cells are presented relative to those of wild-type cells (red and blue dots indicate relevant genes or genes with the most differential expression (labels adjacent)). (c) Gene-set–enrichment analysis of cells at 0 h (top) and 18 h (bottom) after stimulation with IFN-β, highlighting the ‘LCMV Armstrong versus clone 13’ program (top; normalized enrichment score = 5.728; FDR q value, <0.001) and ‘Effector versus Exhausted T cell’ program (bottom; normalized enrichment score = 3.509; FDR q value, <0.001). (d) qPCR analysis of genes encoding products associated with T cell dysfunction and effector-memory programs (horizontal axes), assessed in wild-type (WT) and Mir31−/− T cells (key) at 0 h (left) and 18 h (right) after stimulation with IFN-β; results are presented relative to those of the control gene Gapdh. (e) Flow-cytometry analysis of granzyme C (left) and perforin (right) in wild-type and Mir31−/− cells T cells (key) at 0 h and 18 h after stimulation with IFN-β (horizontal axes); results are presented as mean fluorescence intensity (MFI). *P < 0.05, **P < 0.01 and ***P < 0.001 (unpaired two-tailed Student’s t-test). Data are from one experiment (ac) or two independent experiments (d,e) with n = 3 cultures from three mice (mean ± s.d. in d,e).
Figure 5
Figure 5
Mir31−/− mice undergo a faster recovery and show better viral control in a chronic-LMCV-infection model. (a) Body weight of wild-type mice (n = 4) and Mir31−/− mice (n = 6) (key) infected intravenously with LCMV clone 13 (1 × 10⁶ plaque-forming units), assessed daily before (day 0) and after infection (time, horizontal axis); results are presented relative to original body weight (day 0). *P = 0.02 (day 13) and ***P = 0.003 (day 27) (unpaired two-tailed Student’s t-test). (b) Disease scores of wild-type mice (n = 4) and Mir31−/− mice (n = 6) as in a. * P = 0.024 (day 13) and ***P = 4.5 × 10⁻⁸ (day 27) (unpaired two-tailed Student’s t-test). (c) Viral load in the serum of mice as in a (n = 3 per group), assessed by plaque assay at days 9 and 20 after infection (horizontal axis) and presented as plaque-forming units (PFU) per ml serum. Each symbol represents an individual mouse; small horizontal lines indicate the mean (± s.d.). ***P = 0.0008 (unpaired two-tailed Student’s t-test). Data are representative of two experiments (mean ± s.d. in a,b).
Figure 6
Figure 6
Enhanced LCMV-specific CD8+ T cell responses in miR-31 deficient mice. (a) Flow cytometry of CD8+ T cells from the blood of wild-type and Mir31−/− mice (left margin) on day 20 after infection with LCMV clone 13 (left), and surface expression of KLRG1 and PD-1 on Tet+ CD8+ T cells gated as at left (right). Numbers adjacent to outlined areas (left) indicate percent CD44+Tet+ cells; numbers in quadrants (right) indicate percent cells in each. (b) Frequency of KLRG1+ and KLRG1 cells (key) among Tet+ CD8+ T cells in the blood of wild-type mice (n = 4) and Mir31−/− mice (n = 6) (horizontal axis) on days 9 and 20 (above plots) after infection as in a. **P = 0.002 (unpaired two-tailed Student’s t-test). (c) Frequency of PD-1+Tet+ CD8+ T cells in wild-type mice (n = 3) and Mir31−/− mice (n = 6) (key) on days 9 and 20 (horizontal axis) after infection as in a. *P = 0.02 (unpaired two-tailed Student’s t-test). (d) Flow cytometry of effector and effector-memory (CD44+CD62L) CD8+ T cells (E-EM), central memory (CD44+CD62L+) CD8+ T cells (CM) and naive (CD44 CD62L+) CD8+ T cells (N) (key) in the spleen of wild-type mice (n = 4) and Mir31−/− mice (n = 6) (horizontal axis) on day 30 after infection as in a. *P = 0.03 (unpaired two-tailed Student’s t-test). (e) Quantification of total KLRG1+, CD127KLRG1 and CD127+ cells (key) among Tet+ CD8+ T cells in the spleen of mice as in d. *P = 0.04 (unpaired two-tailed Student’s t-test). (f) Flow cytometry of CD4+ T cell populations, gated as in d (key), in the spleen mice as in d. (g) ELISA of LCMV-specific antibodies (LCMV Ab) in the serum of wild-type and Mir31−/− mice (horizontal axis) on day 20 after infection with LCMV clone 13. (h) Frequency of Foxp3+ CD4+ T cells in peripheral lymph nodes (PLN) and spleen (horizontal axis) of wild-type and Mir31−/− mice (key) on day 30 after infection with LCMV clone 13. Each symbol (c,g,h) represents an individual mouse; small horizontal lines (g) indicate the mean (± s.d.). Data are representative of two experiments (error bars (bf,h), s.d.).
Figure 7
Figure 7
T cell–intrinsic effect of miR-31 on anti-viral CD8+ T cell responses during chronic infection with LCMV. (a) Body weight (left) and disease scores (right) of wild-type and Mir31fl/flCd4Cre mice (n = 4 per group) infected intravenously with LCMV clone 13 (1 × 10⁶ plaque-forming units), assessed daily before (day 0) and following infection; weight is presented relative to starting body weight (day 0). **P = 0.003 (day 12) and **P = 0.001 (day 25), body weight; *P = 0.01 (day 12) and ***P = 0.0004 (day 25), disease score (unpaired two-tailed Student’s t-test). (b) Frequency of KLRG1+ and KLRG1 cells (key) among Tet+ CD8+ T cells in the blood of mice as in a (n = 4 per group), assessed by flow cytometry at days 8, 20 and 28 after infection. *P = 0.02 (day 20) and *P = 0.03 (day 28) (unpaired two-tailed Student’s t-test). (c) Frequency of PD-1+Tet+ CD8+ T cells in the blood of mice as in a (n = 4 per group), assessed by flow cytometry at day 20 after infection treated. *P = 0.04 (unpaired two-tailed Student’s t-test). (d) Quantification of KLRG1+, CD127KLRG1 and CD127+ cells (key) among Tet+ CD8+ T cells in the spleen of mice treated as in a (n = 4 per group), assessed by flow cytometry. Each symbol (c) represents an individual mouse. *P = 0.002 (unpaired two-tailed Student’s t-test). Data are representative of one experiment (error bars, s.d.).
Figure 8
Figure 8
Enhanced production of cytokines by LCMV-specific CD8+ T cells in the absence of miR-31. Quantification of IFN-γ+ CD8+ T cells (a,c) or IFN-γ+TNF+ CD8+ T cells (b,d) among splenocytes obtained from wild-type mice (n = 4) or Mir31−/− mice (n = 6) at day 30 after infection with LCMV clone 13 (a,b) or obtained from wild-type and Mir31fl/flCd4Cre mice (n = 4 per group) at day 28 after infection with LCMV clone 13 (c,d), then left unstimulated (US) or pulsed for 5 h with GP33, GP276 or NP396 peptide (10 μg/ml) (horizontal axes) in the presence of brefeldin A and assessed by intracellular staining; results are presented as total positive cells per spleen. Each symbol represents an individual mouse; small horizontal lines the mean (± s.d.). **P = 0.008 (GP33) and **P = 0.006 (GP276) (a); *P = 0.005 (GP33) or *P = 0.009 (GP276) (b); **P =0.002(GP33), ***P = 0.0007 (GP276) or **P = 0.008 (NP396) (c); and **P = 0.005 (GP33) or **P = 0.003 (GP276) (d) (unpaired two-tailed Student’s t-test). Data are representative of two experiments (a,b) or one experiment (c,d).

Comment in

Similar articles

Cited by

References

    1. Wherry EJ, et al. Molecular signature of CD8+ T cell exhaustion during chronic viral infection. Immunity. 2007;27:670–684. - PubMed
    1. Muljo SA, et al. Aberrant T cell differentiation in the absence of Dicer. J Exp Med. 2005;202:261–269. - PMC - PubMed
    1. Cobb BS, et al. T cell lineage choice and differentiation in the absence of the RNase III enzyme Dicer. J Exp Med. 2005;201:1367–1373. - PMC - PubMed
    1. Zhang N, Bevan MJ. Dicer controls CD8+ T-cell activation, migration, and survival. Proc Natl Acad Sci USA. 2010;107:21629–21634. - PMC - PubMed
    1. Wu T, et al. Temporal expression of microRNA cluster miR-17-92 regulates effector and memory CD8+ T-cell differentiation. Proc Natl Acad Sci USA. 2012;109:9965–9970. - PMC - PubMed

MeSH terms