. 2017 Jul;18(7):813-823.
doi: 10.1038/ni.3753. Epub 2017 May 22.

BACH2 immunodeficiency illustrates an association between super-enhancers and haploinsufficiency

Affiliations

BACH2 immunodeficiency illustrates an association between super-enhancers and haploinsufficiency

Behdad Afzali et al. Nat Immunol. 2017 Jul.

Abstract

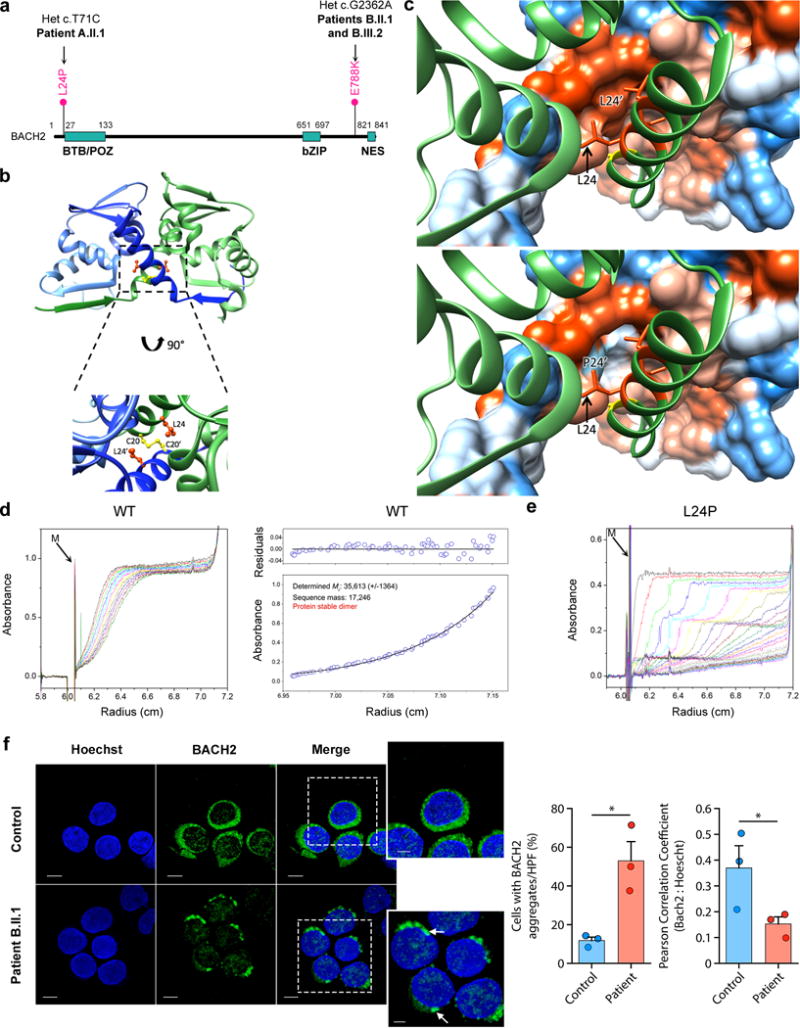
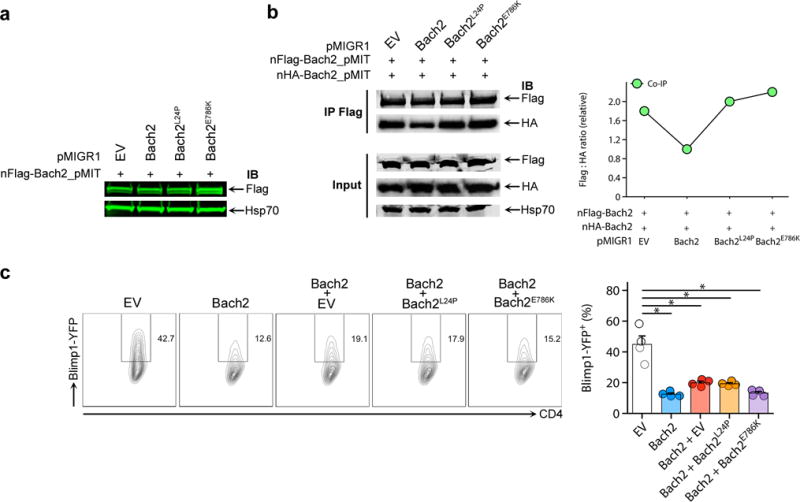
The transcriptional programs that guide lymphocyte differentiation depend on the precise expression and timing of transcription factors (TFs). The TF BACH2 is essential for T and B lymphocytes and is associated with an archetypal super-enhancer (SE). Single-nucleotide variants in the BACH2 locus are associated with several autoimmune diseases, but BACH2 mutations that cause Mendelian monogenic primary immunodeficiency have not previously been identified. Here we describe a syndrome of BACH2-related immunodeficiency and autoimmunity (BRIDA) that results from BACH2 haploinsufficiency. Affected subjects had lymphocyte-maturation defects that caused immunoglobulin deficiency and intestinal inflammation. The mutations disrupted protein stability by interfering with homodimerization or by causing aggregation. We observed analogous lymphocyte defects in Bach2-heterozygous mice. More generally, we observed that genes that cause monogenic haploinsufficient diseases were substantially enriched for TFs and SE architecture. These findings reveal a previously unrecognized feature of SE architecture in Mendelian diseases of immunity: heterozygous mutations in SE-regulated genes identified by whole-exome/genome sequencing may have greater significance than previously recognized.


Conflict of interest statement

Competing financial interests: The authors have no competing interests to declare. Unrelated to this project, H.H.U. declares industrial project collaboration with Lilly, UCB Pharma and Vertex Pharmaceuticals. Travel support was received from Actelion, and MSD.

Figures

Figure 1
Figure 1. Pedigrees and phenotype of patients with mutations in BACH2
(a) Pedigrees of two families with heterozygous missense coding mutations in BACH2, resulting in L24P (left) and E788K (right) amino acid substitutions. Shown are affected heterozygotes (filled symbols) and unaffected family members (open symbols). Arrows indicate probands; WT = wild-type allele; Mut = mutant allele. (b) Sanger sequencing chromatograms of the affected individuals in both families. For each individual, the two alleles of the sequenced region of BACH2 and base positions are shown above the chromatograms. Subject A.II.1 had a heterozygous T to C mutation at coding position 71 whereas patients B.II.1 and B.III.2 were heterozygous for G to A base substitutions at position 2362. (c) Computerized tomography scans showing splenomegaly (arrow in upper left) and pulmonary nodules (red circle in upper right) in patient A.II.1 and bronchiectasis (dilated airways; arrow in lower left) and fibrosis (“honeycombing” circled in lower right) in subject B.II.1. (d) Photomicrograph of a hematoxylin and eosin-stained section from a colonic biopsy from patient A.II.1 showing crypt branching and lymphocytic inflammatory infiltrate around the crypts. (e) Immunofluorescent staining of colonic biopsy from patient A.II.1, control IBD patient and healthy control for nuclear DNA (DAPI, blue), CD3 (green) and FoxP3 (orange). Shown are representative sections (left) and cumulative (mean ± sem) quantification (right) from four low power fields per patient (500–3000 CD3+ cells counted per low power field); white scale bar = 100 μm in main image and 2 μm in insets. *p<0.05, **p<0.01 by t-test.
Figure 2
Figure 2. Immunophenotype of patients with mutations in BACH2
(a–c) Treg cells (a), T cell (b) and B cell (c) immunophenotype of patient and healthy control peripheral blood cells. Shown are total FoxP3 expression (mean fluorescent intensity (MFI)) within CD4+CD25hiCD127lo cells (a), expression of the transcription factor T-bet and gut-homing receptors (CCR9 and β7-integrin) in bulk CD4+ T cells (b) and total memory (c, left) and class-switched memory B cells (c, right) in bulk B cells. (d-e) Plasmablast formation (d, left panels), IgG class switch recombination (d, right panels) and Ig secretion (e) in naïve patient and healthy control B cells activated in vitro as indicated. Shown are representative flow cytometry plots and cumulative data. N.D. = not detected; very low values are shown above the bars for clarity. In (a-d) representative flow cytometry plots are shown together with cumulative data from all patients and matched controls. Note that IgG secretion in (e) does not include patient B.III.2, who has normal IgG secretion. Bars show mean ± sem throughout. *p<0.05 **p<0.01 ***p<0.001 by t-test (a-c), one-way ANOVA (d) and Kruskal-Wallis test (e).
Figure 3
Figure 3. The cellular phenotype is attributable to reduced BACH2 protein expression
(a) BACH2 protein expression in primary immune cells of patients and controls. Shown are representative flow cytometry plots with MFIs indicated (left panels) and cumulative BACH2 protein expression (right panels) from patients relative to controls. (b) Cumulative BACH2 mRNA expression from naïve B cells of patients and controls. (c) Representative immunoblot for Flag and Hsp70 from lysates of HEK293T cells transfected with empty vector (EV), Flag-tagged WT or mutant murine Bach2 (L24P or E786K, the murine equivalent of E788K). Shown are a representative blot (left) and cumulative quantifications from n = 5 experiments (right). (d) PRDM1 mRNA expression in naïve B cells from patients and healthy controls: cumulative data. (e and f) PRDM1 mRNA expression in CD4+ T lymphocytes of healthy controls and patients transfected with either control or BACH2 (e) and healthy donor CD4+ T lymphocytes transfected with control or BACH2 RNAi (f). (g) Plasmablast formation, IgG class switch recombination and IgA secretion in naïve healthy control B cells transfected with control RNAi or RNAi specific for BACH2 and activated in vitro as shown. Shown are representative flow cytometry examples and cumulative data (n = 5, 5 and 4 experiments, respectively). Bars show mean ± sem; *p<0.05, **p<0.01, ***p<0.001, ****p<0.0001 by t-test (a, d), Wilcoxon test (f) and ANOVA (c, e and g).
Figure 4
Figure 4. BACH2 mutations produce unstable proteins
(a) Domain schematic of BACH2 protein and point substitutions in patients. BTB/POZ, BR-C, ttk and bab or Pox virus and Zinc finger domain; bZIP, basic leucine zipper; NES, nuclear export signal. (b), Ribbon representations of BACH2 POZ domain (crystal structure form II, PDB: 3OHV); wild-type protein (above) with expanded and rotated interface view (below); yellow, intermolecular disulfide at position 20; orange, leucine residues at position 24. (c), (top) WT POZ domain dimer interface (PDB: 3OHV); (bottom) homology model of BACH2L24P: WT POZ hetero-dimer, illustrating local changes. In each, one monomer is rendered as a partially transparent hydrophobicity surface (orange = hydrophobic, white = intermediate, blue = hydrophilic) and the other as a ribbon (green); selected side chains are shown as sticks. Cys20 (yellow) and Ile23, Leu24, and Leu27 (all orange) form a hydrophobic patch on α-helix-1; two of these patches are in close contact at the WT dimer interface. N.B. the lower diagram is not meant to represent the structure accurately but is shown merely to indicate regional changes. (d–e) Analytical ultracentrifugation of purified wild-type (WT) p.BACH2 (d) and mutant p.BACH2L24P (e) BTB/POZ domain; sedimentation direction is left to right; M = sample meniscus. WT protein is dimeric (35 kDa), as determined by sedimentation equilibrium measurements (shown in d, right), migrating with single boundary with sedimentation coefficient (S) of 2.6. The mutant exhibits several boundaries (S values from 4 to 18), indicating heterogeneous large protein aggregates (e). (f) Representative confocal microscopy of primary lymphocytes from healthy control and patient B.II.1 stained for BACH2 (green) and Hoechst (blue); arrows highlight cytoplasmic aggregates. Scale bars: 5μm in main, 2μm in inset. Bars show quantification (mean ± sem, n=3 experiments) of cells containing aggregates per high power field (HPF) and BACH2 nuclear localization. *p<0.05 by t-test.
Figure 5
Figure 5. Mutant forms of Bach2 do not exert dominant negative effects
(a) Immunoblot for Flag and Hsp70 in HEK293T cells co-transfected at 1:1 ratio with Flag-tagged WT murine BACH2 and untagged WT and mutant forms of murine BACH2. Shown is a representative from n = 3 independent experiments. (b) co-immunoprecipitation of Flag- and HA-tagged WT Bach2 transfected into HEK293T cells together with untagged WT and mutant forms of murine BACH2 at 1:1:1 vector ratio. Shown is a representative example from n = 3 independent experiments (left) and quantification of the co-immunoprecipitated Flag and HA signals (right). (c) Blimp1-YFP signal in Blimp1-YFP Tg mouse CD4+ T cells co-transduced at 1:1 ratio with retrovirus supernatants encoding WT and mutant forms of murine BACH2. Shown is a representative example (left) and cumulative data (mean ± sem) from n = 4 independent experiments (right). *p<0.0001 by ANOVA.
Figure 6
Figure 6. Bach2 haploinsufficient mice have abnormal B cell differentiation and Treg cell numbers
(a) Expression of Bach2 mRNA in B cells of Bach2+/+ and Bach2+/– mice. (b) Bach2 protein expression in splenic naïve B cells of Bach2+/+ and Bach2+/– mice. Shown is a representative example (left) and cumulative quantification (mean ± sem) (right) from n=3 independent experiments. (ce) Flow cytometry analysis of CD4+ splenocytes in Bach2+/+ and Bach2+/– mice showing percentage Foxp3+ (c), CCR9+ (d) and β7-integrin+ (e) cells. (f) IgM and IgG1 staining of B cells (upper panels) and plasma cells (lower panels) in splenocytes of Bach2+/+ and Bach2+/– mice 8 days following immunization with 4-Hydroxy-3-nitrophenylacetyl hapten-conjugated chicken gamma globulin (NP-CGG) in alum. (g) B220+Ki67+Bcl6+ germinal center B cells in splenocytes of Bach2+/+ and Bach2+/– mice 8 days after immunization with NP-CGG in alum. Shown in (c-f) are representative flow cytometry plots together with bar charts (mean ± sem). In vivo experiments were carried out twice. *p<0.05, **p<0.01, ***p<0.001 by t-test (a-b), one-way ANOVA (f) and Mann-Whitney U-test (all other panels).
Figure 7
Figure 7. Super-enhancer (SE)-regulated genes associate with haploinsufficiency
(a) The BACH2 locus has SE structures in multiple human immune cell types demarcated by H3K27Ac loading. Red fill denotes the presence of an SE in the BACH2 locus in a tissue. Source data are indicated. (b) Violin plots showing probability of loss of function intolerance scores in haplosufficient (HS), autosomal recessive (AR) and haploinsufficient (HI) gene sets. The white circles show median values. Source data: ExAc database. (c) Number of HS, AR or HI genes with and without associated SE architecture in humans (see also supplementary Fig. 8a and supplementary Table 3). (d) Pie charts indicating the frequency of SE (upper panels) and typical enhancer (TE; lower panels) structures in HS (left), HI (middle) and AR (right) genes. (e) Gene ontology (GO) functional annotation enrichment in HI genes. Shown are enrichment scores (blue bars) and Benjamini p-values (in orange) for the top 5 most significantly enriched terms. (f) Median probability of loss of function intolerance (black line) against SE signal size; the percentage of genes that are transcription factors (TF, red line) against SE signal size is shown in the inset. For reference, the red line asymptotes to the expected level (mean percentage of genes in the human genome that are TFs is 7.5%). Source data: ExAc and dbSuper databases. (g) Pie charts indicating the percentage of HS or HI genes that have GWAS disease associations. p-values in d and g are Fisher exact tests; NS = non-significant; GWAS = genome-wide association study.

References

    1. Bousfiha A, et al. The 2015 IUIS Phenotypic Classification for Primary Immunodeficiencies. J Clin Immunol. 2015;35:727–738. - PMC - PubMed
    1. Picard C, et al. Primary Immunodeficiency Diseases: an Update on the Classification from the International Union of Immunological Societies Expert Committee for Primary Immunodeficiency 2015. J Clin Immunol. 2015;35:696–726. - PMC - PubMed
    1. Arason GJ, Jorgensen GH, Ludviksson BR. Primary immunodeficiency and autoimmunity: lessons from human diseases. Scand J Immunol. 2010;71:317–328. - PubMed
    1. Notarangelo LD. Primary immunodeficiencies. J Allergy Clin Immunol. 2010;125:S182–94. - PubMed
    1. Conley ME, Casanova J-L. Discovery of single-gene inborn errors of immunity by next generation sequencing. Curr Opin Immunol. 2014;30:17–23. - PMC - PubMed

MeSH terms

Substances