. 2017 Jul;18(7):771-779.
doi: 10.1038/ni.3751. Epub 2017 May 22.

CD8αα intraepithelial lymphocytes arise from two main thymic precursors

Affiliations

CD8αα intraepithelial lymphocytes arise from two main thymic precursors

Roland Ruscher et al. Nat Immunol. 2017 Jul.

Abstract

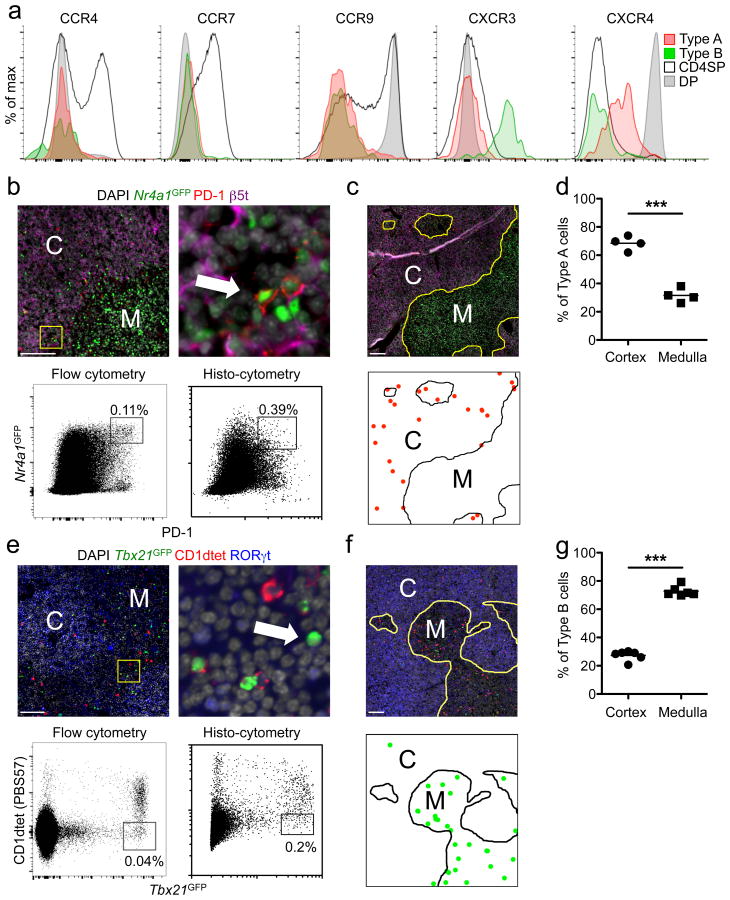
TCRαβ+CD4-CD8α+CD8β- intestinal intraepithelial lymphocytes (CD8αα IELs) are an abundant population of thymus-derived T cells that protect the gut barrier surface. We sought to better define the thymic IEL precursor (IELp) through analysis of its maturation, localization and emigration. We defined two precursor populations among TCRβ+CD4-CD8- thymocytes by dependence on the kinase TAK1 and rigorous lineage-exclusion criteria. Those IELp populations included a nascent PD-1+ population and a T-bet+ population that accumulated with age. Both gave rise to intestinal CD8αα IELs after adoptive transfer. The PD-1+ IELp population included more strongly self-reactive clones and was largely restricted by classical major histocompatibility complex (MHC) molecules. Those cells localized to the cortex and efficiently emigrated in a manner dependent on the receptor S1PR1. The T-bet+ IELp population localized to the medulla, included cells restricted by non-classical MHC molecules and expressed the receptor NK1.1, the integrin CD103 and the chemokine receptor CXCR3. The two IELp populations further differed in their use of the T cell antigen receptor (TCR) α-chain variable region (Vα) and β-chain variable region (Vβ). These data provide a foundation for understanding the biology of CD8αα IELs.


Figures

Figure 1
Figure 1. A Subset of TCRβ+DN Cells Is Phenotypically and Functionally Mature
(a) Flow cytometric identification of TCRβ+ DN cells in the thymus. (b) Within thymic TCRβ+ DN cells of Tak1fl/fl or Tak1fl/flCd4Cre mice, proportions and numbers of mature CD122+H-2Kb+ cells were determined. (c) Numbers of CD8αα and TCRγδ+ IELs were determined from Tak1fl/fl or Tak1fl/flCd4Cre small intestines by flow cytometry. (d) CD69 and CD122 expression on thymic wild-type TCRβ+ DN cells. Dot plots are representative of more than 10 experiments (a), 3 experiments with 6 (Tak1fl/fl) or 5 (Tak1fl/flCd4Cre) mice (b), or 2 experiments with 3 mice (d). Graphs show combined data from 3 (b, left graph and c) or 2 (b, right graph) independent experiments with each symbol representing an individual mouse. *P < 0.05, *** P < 0.001, Student's t test. Horizontal lines in graphs indicate the mean.
Figure 2
Figure 2. Mature TCRβ+DN Cells Divide into Two Major Subsets
(a) TCRβ+ DN thymoctyes were analyzed for GFP expression in Tbx21GFP (T-bet-GFP) mice. (b) PD-1 surface staining of Tbx21GFPhigh (green) or Tbx21GFP– (red) TCRβ+DN thymocytes, and Nur77-GFP expression of PD-1+ or PD-1 TCRβ+DN cells in Nr4a1GFP. Controls: CD4SP and DP. (c) Graphical representation of PD-1+ (red) and PD-1 or PD-1NK1.1+ (green) total cell numbers within the thymic TCRβ+ DN population of wild-type (WT) or Bim–/– mice. (d) Cumulative data of PD-1+ (red) and PD-1 (green) total cell numbers within the thymic TCRβ+DN population of WT or Cd28–/– mice. (e and f) Expression of α4β7 and CD103 (e), or NK1.1 (f) by Tbx21GFP+ (green) or Tbx21GFP– (red) TCRβ+ DN. (g) YFP expression by PD-1+ (red) and PD-1 (green) TCRβ+DN of IfngYFP or WT control mice. (hj) SPADE analysis of flow cytometric data, gated on CD5+TCRβ+ thymocytes as shown in Supplementary Fig. 1a. Individual bubbles in (h) show populations determined by expression of markers as shown in (j) and Supplementary Fig. 1. The color of individual nodes indicates median intensity of CD122, node size indicates cell number. CD122+H-2Kb+PD-1+ type A and CD122+H-2Kb+CD1dtetPD-1 type B IELp in (hj) are encircled and/or labeled in red or green, respectively. Percentages of type A (red) and type B (green) IELp relative to each other are shown in (i). Median intensities of markers in Supplementary Fig. 1 are represented as a heatmap (j). Dot plots and histograms shown in (ag) are representative for 3 experiments. Graphs are pooled from 4 experiments with (a), 4 experiments (c), or 1 experiment (d) with each symbol representing an individual mouse. * P < 0.05, ** P < 0.01, Student's t test. Horizontal lines in graphs indicate the mean.
Figure 3
Figure 3. Both PD-1+ “Type A” and PD-1 “Type B” Cells Give Rise to CD8αα IEL
(a): Purified type A (red) or B (green) IELp (sorted as described in the Methods section) were transferred alongside total DN control cells into Rag2–/– recipients. Transferred cells were recovered from the small intestinal IEL compartment 5-10 weeks after transfer. Graphs show recovered cells as the proportion of CD4+, CD8αβ+ or CD8αα+ cells within TCRβ+ IELs. (b) GFP expression in type A (PD-1+, open, solid red) or B (PD-1, open, dashed green) IELp, and in H-2Kb– (filled, solid) or H-2Kb+ (filled, dashed) CD4SP from Rag2GFP mice. (c) Type A (PD-1+, red) or B (PD-1T-bet+, green) IELp were stained for Ki-67. Graphs show the percent (left graph) and MFI minus the negative control's MFI (right graph). (d) Qa2 expression by type A (PD-1+, open, solid red) or B (PD-1, open, dashed green) IELp, and in H-2Kb– (filled, solid) or H-2Kb+ (filled, dashed) CD4SP. (e) Number of type A (PD-1+, red) or B (PD-1NK1.1+, green) IELp from mice within different age groups as indicated. Histograms are representative of 3 independent experiments. Graphs in (a) are combined from 3 experiments. (c) shows graphs pooled from 2 experiments (left) or 1 experiment representative for 2 experiments (right). Graphs in (e) are combined from 3 experiments. Each symbol in graphs represents an individual mouse. * P < 0.05, ** P < 0.01, *** P < 0.001, Student's t test (c) or ANOVA with Bonferroni post-test (a, e). Horizontal lines in graphs indicate the mean.
Figure 4
Figure 4. Thymic Localization of Type A and B IELp
(a) Type A (PD-1+, red) and B (PD-1, green) IELp as well as CD4SP and DP thymocytes were stained for the indicated chemokine receptors and analyzed by flow cytometry. Histograms are representative of 3 individual mice in 2 experiments. (bd) Thymic sections of Nr4a1GFP mice were stained with PD-1, β5t and DAPI (red, purple and grey, respectively, b, c). The arrow in (b) indicates a GFPhighPD-1+ type A IELp. Dot plots in (b) represent histo-cytometric analysis (right) of immunofluorescence images in comparison to flow cytometric analysis (left). (c, bottom) shows localization of type A IELp (red dots) as determined by histo-cytometry. (d) Cortical and medullary frequencies were analyzed and pooled from images of 3 mice with each symbol representing an individual image area. C, cortex; M, medulla. Scale bars 100 μm. (eg) Analysis of type B IELp like in (bd). Tbx21GFP thymic sections were stained with CD1dtet, RORγt and DAPI (red, blue and grey, respectively, e, f), type B IELp were determined as GFPhighCD1dtet cells (arrow, e). Type B IELp in (f, bottom) are indicated as green dots. (g) Cortical and medullary frequencies were analyzed and pooled from images of 3 mice with each symbol representing an individual image area. *** P < 0.001, Student's t test.
Figure 5
Figure 5. Emigration of Type A IELp Is Dominant over Type B
(a) IELp from Klf2GFP mice were further stained for S1PR1 (Supplementary Fig. 4a). Left: percent type A (PD-1+, red) or B (PD-1, green) cells within Klf2+S1PR1+ mature IELp. Right: Percent α4β7+ cells in the whole mature type A IELp population versus Klf2+S1PR1+ mature type A IELp. (b) Mice were intravenously labeled with anti-CD45.2 PE (Supplementary Fig. 4c). Shown are the proportions of type A (PD-1+, red) or B (PD-1, green) mature phenotype cells within the unlabeled (IV–) and labeled (IV+) thymic fractions. (c) Rag2GFP mice were intrathymically injected with NZ-Link Sulfo-NHS-Biotin and analyzed 24h later. Shown are type A (PD-1+, red) and B (PD-1, green) cells within mature IELp of the streptavidin-labeled fraction. Graphs in (a) and (b) are combined from 3 (a) or 5 (b) independent experiments. (c): plots are representative for and graph is combined from 3 mice in one experiment. Another two independent experiments with C57BL/6 mice showed similar results. All graphs indicate the mean and each symbol represents an individual mouse. ** P < 0.01, *** P < 0.001, Student's t test (a) or ANOVA with Bonferroni post-test (b, c).
Figure 6
Figure 6. No Immediate Precursor-Product Relationship Between Type A and B IELp
Cd4CreERT2 and Rosa26TdT mice were crossed and the offspring was injected with tamoxifen. Thymic populations were analyzed for tdTomato protein expression on day 2, 5 or 10 after tamoxifen exposure. Shown are representative plots (a) and cumulative data of indicated populations (b). Type A and B IELp were pre-gated on mature phenotype IELp and defined as PD-1+ or PD-1NK1.1+, respectively. Cumulative data of 3 experiments with 3 (2d, 4d) or 4 (10d) mice. * P < 0.05, ***p < 0.001, ANOVA with Bonferroni post-test. Graphs show mean (± s.d.).
Figure 7
Figure 7. Type A and B IELp Have Different Antigen-Receptor Specificities
(a) Absolute numbers of CD8αα IELs and type A (PD-1+) or B (PD-1) IELp and in classical MHC class-I and in β2m deficient models. Due to the lack of H-2Kb, mature IELp were defined by CD122 expression only. (b) PD-1+ type A and PD-1NK1.1+ type B IELp numbers were analyzed in WT versus CD1d-deficient thymi. (c) Graphs show absolute numbers of CD8αα IELs and type A (PD-1+) or B (PD-1) IELp in MHC class-II deficient mice. (d) TCR Vα analysis of type A (PD-1+, red) and B (PD-1, green) IELp, and CD8αα IELs. Graphs are combined from 6 experiments with 6 (WT, KbDb–/–) and 7 (B2m–/–) mice (a, IELs), 11 experiments with 27 (WT), 12 (KbDb–/–) and 20 (B2m–/–) mice (a, type A and B), 4 experiments with 5 (WT) and 9 (Cd1–/–) mice (b), 5 experiments with 5 (WT) and 7 (I-Ab–/–) mice (c, IELs), 10 experiments with 27 (WT) and 14 (I-Ab–/–) mice (c, type A and B), 11 experiments with 15 mice (d, IELs) or 7 experiments with 7 mice (d, type A and B). * P < 0.05, ** P < 0.01, *** P < 0.001, ANOVA with Bonferroni post-test (a) or Student's t test (b, c and d). All graphs show median (center lines) with 25th and 75th percentiles (box limits). The whiskers indicate the smallest and largest values.

Comment in

References

    1. Sheridan BS, Lefrançois L. Intraepithelial lymphocytes: to serve and protect. Curr Gastroenterol Rep. 2010;12:513–521. doi: 10.1007/s11894-010-0148-6. - DOI - PMC - PubMed
    1. Cheroutre H, Lambolez F, Mucida D. The light and dark sides of intestinal intraepithelial lymphocytes. Nat Rev Immunol. 2011;11:445–456. doi: 10.1038/nri3007. - DOI - PMC - PubMed
    1. Gangadharan D, et al. Identification of pre- and postselection TCRalphabeta+ intraepithelial lymphocyte precursors in the thymus. Immunity. 2006;25:631–641. doi: 10.1016/j.immuni.2006.08.018. - DOI - PubMed
    1. Mayans S, et al. αβT cell receptors expressed by CD4(-)CD8αβ(-) intraepithelial T cells drive their fate into a unique lineage with unusual MHC reactivities. Immunity. 2014;41:207–218. doi: 10.1016/j.immuni.2014.07.010. - DOI - PMC - PubMed
    1. McDonald BD, Bunker JJ, Ishizuka IE, Jabri B, Bendelac A. Elevated T cell receptor signaling identifies a thymic precursor to the TCRαβ(+)CD4(-)CD8β(-) intraepithelial lymphocyte lineage. Immunity. 2014;41:219–229. doi: 10.1016/j.immuni.2014.07.008. - DOI - PMC - PubMed

MeSH terms