. 2017 May 22;13(5):e1006799.
doi: 10.1371/journal.pgen.1006799. eCollection 2017 May.

Evolutionary forces affecting synonymous variations in plant genomes

Affiliations

Evolutionary forces affecting synonymous variations in plant genomes

Yves Clément et al. PLoS Genet. .

Abstract

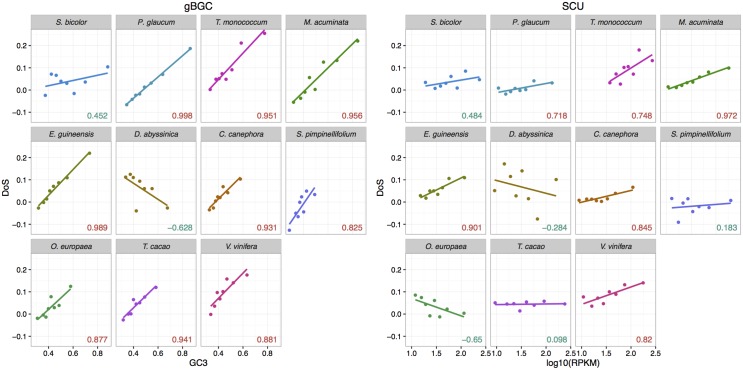
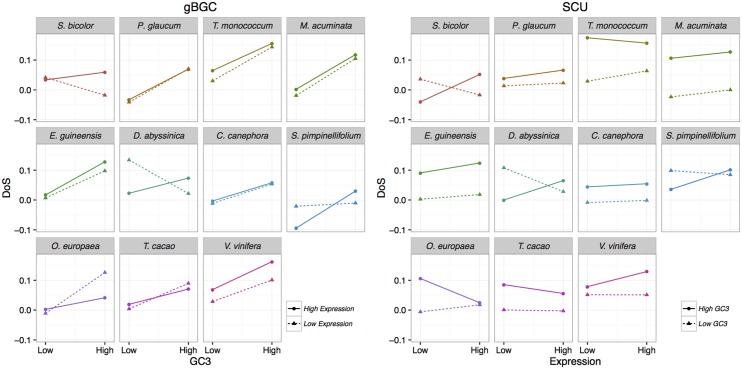
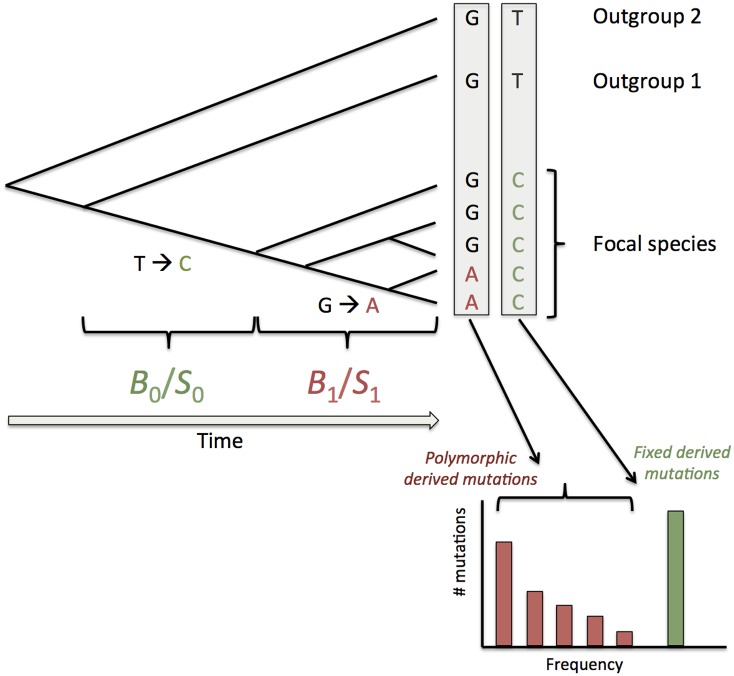
Base composition is highly variable among and within plant genomes, especially at third codon positions, ranging from GC-poor and homogeneous species to GC-rich and highly heterogeneous ones (particularly Monocots). Consequently, synonymous codon usage is biased in most species, even when base composition is relatively homogeneous. The causes of these variations are still under debate, with three main forces being possibly involved: mutational bias, selection and GC-biased gene conversion (gBGC). So far, both selection and gBGC have been detected in some species but how their relative strength varies among and within species remains unclear. Population genetics approaches allow to jointly estimating the intensity of selection, gBGC and mutational bias. We extended a recently developed method and applied it to a large population genomic dataset based on transcriptome sequencing of 11 angiosperm species spread across the phylogeny. We found that at synonymous positions, base composition is far from mutation-drift equilibrium in most genomes and that gBGC is a widespread and stronger process than selection. gBGC could strongly contribute to base composition variation among plant species, implying that it should be taken into account in plant genome analyses, especially for GC-rich ones.


Conflict of interest statement

The authors have declared that no competing interests exist.

Figures

Fig 1
Fig 1. Phylogeny of the species used in this study.
Phylogenetic relationship of the species used in this study. The phylogeny was computed with PhyML [75] on a set of 33 1–1 orthologous protein clusters obtained with SiLiX [76] and the resulting tree was made ultrametric (see untransformed trees in S5 and S6 Figs). Images for S. bicolor, T. monococcum, D. abyssinica and O. europaea come from the pixabay website. Images for S. pimpinellifolium and M. acuminata are provided by the authors. All other images come from the Wikimedia website.
Fig 2
Fig 2. Patterns of codon preference among the 11 studied species.
The colour scale indicates the magnitude of Δ RSCU, the difference in the Relative Synonymous Codon Usage between highly and lowly expressed genes. The greenest codons are the most preferred and the reddest the least preferred. Codons ending in G or C are in red and those ending in A or T in blue.
Fig 3
Fig 3. Relationship between the frequency of optimal codons (FOP) and expression in the 11 studied species.
For each species, genes have been split into eight categories of expression (based on RPKM) of same size and the mean FOP for each category is plotted with its 95% confidence interval.
Fig 4
Fig 4. DoS statistics as a function of GC3 and expression level.
Correlation between GC3 and DoS computed on WS changes (left panel) or between expression level (measured through RPKM) and DoS computed on UP changes (right). Pearson correlation coefficients are given for each species (red: significant at the 5% level, blue non-significant).
Fig 5
Fig 5. Combined effect of GC3 and expression level on DoS statistics.
The DoS statistics was computed on W/S (gBGC) or U/P (SCU) changes for four gene categories: GC-rich and highly expressed, GC-rich and lowly expressed, GC-poor and highly expressed, GC-poor and lowly expressed.
Fig 6
Fig 6. Schematic presentation of the method to estimate recent and ancestral gBGC or SCU.
In addition to polymorphic derived mutations used to infer recent gBGC or selection (B1/S1) as in [38] we also consider substitutions (i.e. fixed derived mutations) on the branch leading to the focal species. Each box corresponds to a site position in a sequence alignment. Both kinds of mutations are polarized with the two same outgroups and are thus sensitive to the same probability of polarization error. We assume that gBGC and selection may have change so that fixed mutations may have undergo a different intensity. Note that these two B or S values correspond to average of potentially more complex variations over the two periods.
Fig 7
Fig 7. GC3 and gBGC gradients along genes.
A: gBGC strength estimations (4Neb) for first exons (252 first bp of contigs) and rest of gene. Error bars indicate the 95% confidence intervals. With the exception of D. abyssinica and S. pimpinellifolium, all species exhibit stronger gBGC in the first exons compared to the rest of genes. B. Correlations between GC3 and gBGC strength in first exons (red) and rest of genes (blue). Each dot corresponds to one species. GC3 and 4Neb tend to be positively correlated in both regions: ρSpearman = 0.591, p-value = 0.061 for first exons and ρSpearman = 0.382, p-value = 0.248 for the rest of genes. C. Comparison of 4Neb estimates between first exons and rest of genes for Commelinids (all Monocots with the exception of D. abyssinica, left panel) and other species (right panel). 4Neb values are higher in first exons compared to rest of genes in Commelinids species, while other species exhibit no differences between first exons and rest of genes.

References

    1. Serres-Giardi L, Belkhir K, David J, Glémin S (2012) Patterns and evolution of nucleotide landscapes in seed plants. The Plant Cell 24: 1379–1397. 10.1105/tpc.111.093674 - DOI - PMC - PubMed
    1. Clement Y, Fustier MA, Nabholz B, Glémin S (2015) The bimodal distribution of genic GC content is ancestral to monocot species. Genome Biology and Evolution 7: 336–348. - PMC - PubMed
    1. Plotkin JB, Kudla G (2011) Synonymous but not the same: the causes and consequences of codon bias. Nature Review Genetics 12: 32–42. - PMC - PubMed
    1. Wright SI, Yau CB, Looseley M, Meyers BC (2004) Effects of gene expression on molecular evolution in Arabidopsis thaliana and Arabidopsis lyrata. Molecular Biology & Evolution 21: 1719–1726. - PubMed
    1. Chen SL, Lee W, Hottes AK, Shapiro L, McAdams HH (2004) Codon usage between genomes is constrained by genome-wide mutational processes. Proceeding of the National Academy of Science USA 101: 3480–3485. - PMC - PubMed

LinkOut - more resources