Review
. 2017 May 22:46:59-83.
doi: 10.1146/annurev-biophys-070816-033751.

Structural Insights into the Eukaryotic Transcription Initiation Machinery

Affiliations
Review

Structural Insights into the Eukaryotic Transcription Initiation Machinery

Eva Nogales et al. Annu Rev Biophys. .

Abstract

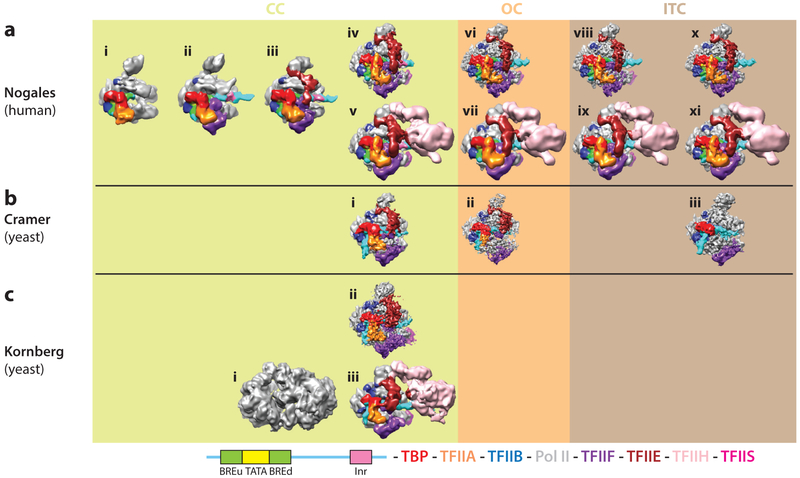
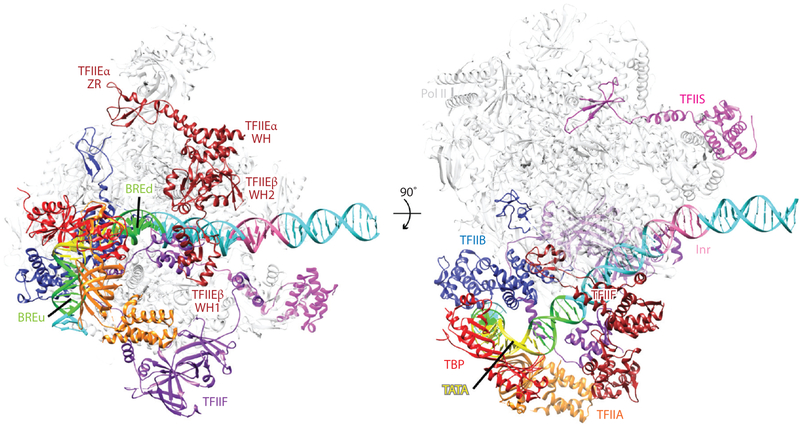
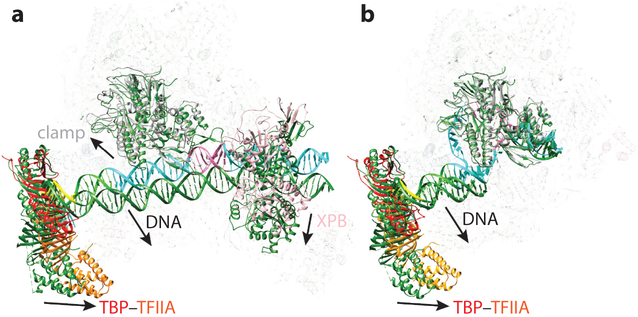
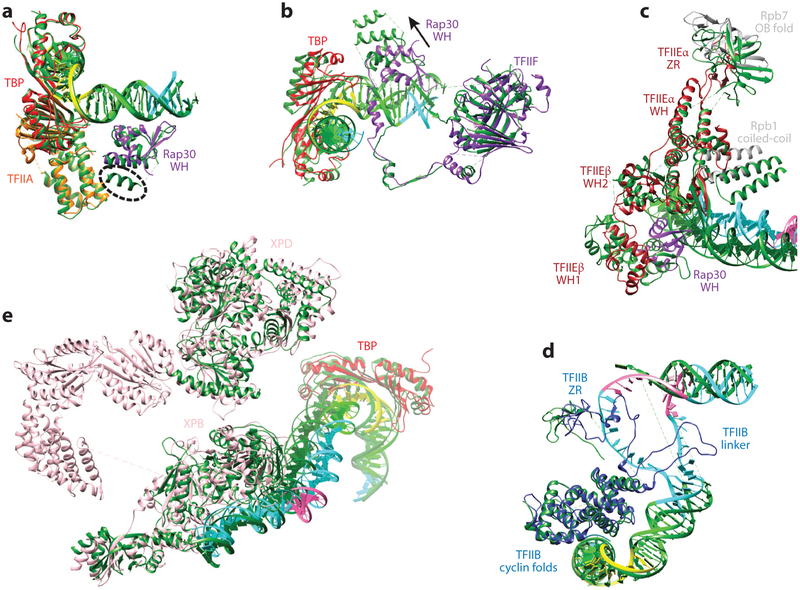
Eukaryotic gene transcription requires the assembly at the promoter of a large preinitiation complex (PIC) that includes RNA polymerase II (Pol II) and the general transcription factors TFIID, TFIIA, TFIIB, TFIIF, TFIIE, and TFIIH. The size and complexity of Pol II, TFIID, and TFIIH have precluded their reconstitution from heterologous systems, and purification relies on scarce endogenous sources. Together with their conformational flexibility and the transient nature of their interactions, these limitations had precluded structural characterization of the PIC. In the last few years, however, progress in cryo-electron microscopy (cryo-EM) has made possible the visualization, at increasingly better resolution, of large PIC assemblies in different functional states. These structures can now be interpreted in near-atomic detail and provide an exciting structural framework for past and future functional studies, giving us unique mechanistic insight into the complex process of transcription initiation.

Keywords: PIC; TFIID; TFIIE; TFIIF; TFIIH; cryo-EM; general transcription factors.


Figures

Figure 1
Figure 1
Domain architectures of the human general transcription factors. (a) Architecture of the super core promoter (SCP) DNA sequence used in the human TFIID and preinitiation complex (PIC) studies. The upstream promoter region contains a TATA box sequence that binds strongly to the TATA binding protein (TBP), flanked by upstream and downstream TFIIB-recognition elements (BREu and BREd). The TBP-associated factor (TAF) subunits of TFIID bind the initiator (Inr) motif, which surrounds the start site, as well as the motif ten element (MTE) and downstream promoter element (DPE) in the downstream region of the promoter. Numbering is relative to the transcription start site (+1), and the transcription direction is marked by an arrow. (b) Domain architectures for the subunits of TFIID and TFIIA, and (c) domain architectures for TFIIB, TFIIF, TFIIS, TFIIE, and TFIIH. Solid black outlines surround regions with experimentally determined atomic models of the human protein, whereas dotted lines indicate that only homologous structures exist. Gray backgrounds indicate regions that have been structurally modeled by cryo-electron microscopy within the context of the PIC. The length scale for the schematics in panel c is twice of that in panel b. Abbreviations: 1iD, TAF1-interacting domain; 2iD, TAF2-interacting domain; 2×Bromo, double bromodomain; 2×Cyclin, double cyclin folds; coiled-C, coiled-coil domain; CTD, C-terminal domain; DRD, DNA-damage recognition domain; Fe-S, iron-sulfur cluster domain; HFD, histone fold domain; HTH, helix-turn-helix; LisH, Lis homology domain; NLS, nuclear localization signal; NTD, N-terminal domain; PH, pleckstrin homology domain; PHD, plant homeodomain; TAFH, TAF homology domain; vWF, von Willebrand factor type A domain; WH, winged helix; ZnF, zinc finger; ZnK, zinc knuckle; ZnR, zinc ribbon.
Figure 2
Figure 2
The conformational landscape of human TFIID. (a) Following 2D classification of electron microscopy (EM) images of free TFIID into classes showing similar views of the complex (bottom), the position of lobe A within each class was measured along the long axis of the BC core, and the fraction of particles (vertical axis) with a given lobe A position (horizontal axis) was plotted as shown (green curve), revealing a bimodal distribution of lobe A positioning (18). Positions to the left of center represent the canonical conformation of TFIID, in which lobe A is near lobe C, whereas those to the right represent the rearranged state of TFIID, in which lobe A is near lobe B. The same analysis was done for TFIID in the presence of TFIIA and promoter DNA (red dashed curve), revealing a shift in the conformational equilibrium toward the rearranged state. (b) Cryo-EM 3D reconstructions of TFIID in the canonical (left, EMD 2287) and rearranged (right, EMD 2282) states were generated using a multi-model refinement strategy, with ab initio orthogonal tilt reconstructions as initial references (18). The density corresponding to the BC core (blue) stays relatively consistent between the two states, whereas the density for lobe A (yellow) is dramatically different. An additional density corresponding to the promoter DNA was observed only in the rearranged state reconstruction, indicating that DNA binds rearranged TFIID. A part of lobe A (lobe A1, orange) was later found to contain TFIIA and TATA binding protein. Figure modified from Reference with permission.
Figure 3
Figure 3
Cryo-electron microscopy (EM) analysis of promoter-bound TFIID. (a) Purification of promoter-bound TFIID-TFIIA complexes (52). Human TFIID complexes, previously affinity-purified from HeLa nuclear extract, are mixed with biotinylated (Bio) promoter DNA and recombinant human TFIIA (orange), and the DNA is then immobilized on magnetic streptavidin (SA) coated beads. Unbound DNA and proteins are washed away, and the purified DNA-bound complexes are then released by a restriction enzyme (RE) that cleaves the DNA at a restriction site placed between the promoter sequence and the biotinylated end. (b) 3 D classification of cryo-EM images of the TFIID-TFIIA-DNA complex reveals the flexibility of TFIID’s lobe A2 with respect to the more stable DNA-bound core composed of lobes A1, B, and C. The transparent isosurface is displayed at a lower threshold to enable visualization of weaker densities. (c) A strategy for local classification and refinement within masks around the DNA-bound core (dashed green line) or lobe C only (dashed red line) resulted in improved resolutions in these regions compared to the unmasked reconstruction (top) because of the exclusion of flexible parts of the complex. (Top, EMD 3304; middle, EMD 3305; bottom, EMD 3306.) Figure modified from References and with permission.
Figure 4
Figure 4
Details of promoter binding by TFIID. (a) Current model of promoter-bound TFIID-TFIIA (52). The TATA binding protein (TBP)-TFIIA module engages the upstream promoter (left), whereas TAF1 and TAF2 engage the downstream region of the promoter (middle and right), including the transcription start site (TSS) (+1). A homodimer of the TAF6 HEAT repeat domain bridges lobes C and B, whereas a helical segment of TAF8 bridges TAF2 with one copy of TAF6. The schematic on the bottom right depicts the super core promoter DNA and illustrates which parts of the promoter are contacted by subunits of TFIID. (b) The main promoter-interacting regions of TAF1 (left) and TAF2 (right), colored by amino acid conservation. Highly conserved positively charged residues within the TAF1 winged helix (WH) that appear to interact with the DNA are depicted as ball-and-stick models. (c, left) Surface electrostatics of the TAF1-TAF2 subcomplex, showing that a strongly positively charged patch demarcates the DNA-interacting surface (blue = positive, red = negative). On the right, a side view of the TAF1-TAF2 complex highlights the network of interactions between TAF1, TAF2, and the downstream DNA. (d) Current model for promoter binding by TFIID. On the left, TFIID is in the autoinhibitory canonical state, in which TBP is blocked from binding DNA by the TAND ofTAFl. Interactions with promoter DNA and TFIIA (noted with the brackets and asterisk) repress the inhibitory effect ofTAFl and drive TFIID into the rearranged state (middle), bringing TBP toward lobe B of TFIID. Interactions with the promoter are probably initiated by TAF1-TAF2 in the downstream promoter region, placing the upstream promoter DNA in position to be engaged by TBP (right). Abbreviations: DPE, downstream promoter element; MTE, motif ten element; TAF, TBP-associated factor. Panel a is adapted from Reference , and panels b-c are adapted from Reference .
Figure 5
Figure 5
Cryo-electron microscopy (cryo-EM) structures to date of core eukaryotic preinitiation complexes (PICs) in different states during transcription initiation. (a) Cryo-EM reconstructions of human PICs from the Nogales group, and of Saccharomyces cerevisiae PICs from (b) the Cramer and (c) the Kornberg groups. The cryo-EM density maps are grouped by states: closed complex (CC), open complex (OC), and initially transcribing complex (ITC). Human reconstructions for CC states include those of TATA binding protein (TBP)-TFIIA-TFIIB-DNA-Pol II (i, EMD 2304), plus TFIIF (ii, EMD 2305), and plus TFIIE (iii, EMD 2306) from Reference , as well as core CC (missing TFIIH) (iv, EMD 8135) and full CC (v, EMD 3307) from Reference . The rest of the human structures correspond to the core OC (vi, EMD 8136), full OC (vii, EMD 8132), core ITC (viii, EMD 8137), full ITC (ix, EMD 8133), core ITC (without TFIIS) (x, EMD 8138), and full ITC (with TFIIS) (xi, EMD 8134) from Reference . Reconstructions from the Cramer group correspond to core CC (i, EMD 3383), core OC (ii, EMD 3378) from Reference , and minimal ITC that included TBP-TFIIB-Pol II-TFIIE (iii, EMD 2785) from Reference . Reconstructions from the Kornberg group are labeled for full CC (i, EMD 2394) from Reference (where the density interpretation in terms of subunits was inconsistent with all other structures published), core CC (ii, EMD 3115), and full CC (iii, EMD 3114) from Reference . Color scheme for the core promoter elements within the human DNA construct and protein components of the PIC is shown at the bottom.
Figure 6
Figure 6
Architecture of the human preinitiation complex. Near-atomic model of the core, TATA binding protein (TBP)-based PIC in the closed complex state shown in two perpendicular views (PDB 5IYA). Key general transcription factor domains are labeled. Abbreviations: Pol II, RNA polymerase II; WH, winged helix; ZR, zinc ribbon.
Figure 7
Figure 7
Comparison of human and yeast preinitiation complex (PIC) models. The structures are aligned using the rigid part of RNA polymerase II (Pol II) (excluding the clamp and the stalk domains) in both (a) full closed complex (CC) [human, PDB 5IY6 (37); yeast, PDB 5FMF (58)] and (b) core open complex (OC) states [human, PDB 5IYB (37); yeast, PDB 5FYW (63)]. The human models are colored following the same scheme as in the rest of the figures. The yeast models are colored in dark green. In the CC, the yeast TATA binding protein (TBP)-TFIIA module, the Pol II clamp domain, TFIIH as exemplified by XPB, and the path of the downstream DNA are in different relative positions. In the OC (TFIIH not shown, as it was not present in the yeast structure for this stage of initiation), the same differences persist for the TBP-TFIIA module and the DNA path between the yeast and human structures. The Pol II clamp domain is in the same closed position in both structures.
Figure 8
Figure 8
Comparison of human and yeast general transcription factor structure models. (a) Alignment of the TATA binding protein (TBP) TFIIA modules of the human and yeast (dark green) open complex (OC) states shows that the DNA path and the Rap30 winged helix (WH) domain are practically superimposable, except for the presence of an additional short helix at the C-terminal end of Tfg2 [human, PDB 5IYB (37); yeast, PDB 5FYW (63)]. (b) When both subunits of TFIIF are aligned for the human and yeast OC states, the dimerization domain and the overall path of the linker within Rap30 (Tfg2 in yeast) are in similar positions. In contrast, the C-terminal end of the linker and the WH domain of Rap30 deviate significantly between the two structures, as does the DNA path [human, PDB 5IYB (37); yeast, PDB 5FYW (63)]. (c) When both subunits of TFIIE are aligned between human and yeast CC states, the TFIIEα helix-turn-helix and WH are superimposable. The clamp coiled-coil domain of Pol II interacts with TFIIE using different interfaces for the yeast and human systems. The beta hairpin in the TFIIEα WH domain interacts with the duplex DNA in the yeast structure, whereas it is partially disordered (and thus lacking interaction with the DNA) in the human structure [human, PDB 5IYA (37); yeast, PDB 5FZ5 (63)]. (d) Alignment of TFIIB between the human and yeast OC states shows that the two cyclin folds are superimposable, but the TFIIB linker region is stabilized only in the human structure, where it directly interacts with the nontemplate DNA strand [human, PDB 5IYB (37); yeast, PDB 5FYW (63)]. (e) Modeled regions of TFIIH are aligned between the human and yeast CC states. TBP is in a very similar position, indicating that the distance between the XPB-DNA interacting site and the TATA box is the same between the yeast and human structures [human, PDB 5IY6 (37); yeast, PDB 5FMF (58)].
Figure 9
Figure 9
Structural transitions during promoter opening. (a) Human closed complex (CC) and open complex (OC) structures are aligned by superposition of the rigid part of RNA polymerase II. The DNA near the XPB binding site is in the same position. However, (b) the fork loop 2 and (c) the clamp-TFIIE regions undergo significant changes. (d) TFIIH becomes closer to the rest of the preinitiation complex in the OC, as it pivots around the point of XPB-DNA contact [CC, PDB 5IY6; OC, PDB 5IY7 (37)]. The OC model is colored following the same scheme as in the rest of the figures, and the CC model is colored in dark green.
Figure 10
Figure 10
Model of the human TFIID-based preinitiation complex (PIC). (a) Superposition of the common elements in the human TATA-binding protein (TBP)-based PIC (upper left, EMD 3307) and human TFIID-TFIIA-DNA complex (lower left, EMD 3305), including TBP, TFIIA, and the promoter DNA (ribbon representation), results in a synthetic structural model for the human TFIID-based PIC (52). The model suggests that minor rearrangements are required within the TFIID-TFIIA-DNA complex to accommodate RNA polymerase II (Pol II) into the PIC and supports previous findings that subunits of TFIID can interact with other general transcription factors (GTFs), including TFIIF and TFIIE. On the bottom right, a depiction of the super core promoter DNA illustrates which parts of the promoter are contacted by GTFs. (b) Putative mechanism for Pol II recruitment to the TFIID-TFIIA-promoter complex. Following the loading of TBP onto the upstream promoter DNA (see Figure 4d), interactions between Pol II-bound TFIIB and the TBP-DNA complex likely mediate the recruitment of Pol II to the complex. Following the engagement of promoter DNA by TFIIF and Pol II (middle), at least some of the downstream promoter contacts with TFIID are released. TFIIE and TFIIH are then recruited to the PIC (right). It is yet unclear whether TAFs remain bound to the PIC in the final stages of PIC assembly or through transcription initiation. (c) Superposition of current cryo-electron microscopy structures from both human and yeast systems yields a model of an ~3 MDa transcription initiation supracomplex including TFIID, TFIIA, TFIIB, TFIIF, TFIIE, TFIIH, Pol II, and the Mediator coactivator complex (79). The flexible lobe A of TFIID (yellow) is depicted at two different isosurface thresholds, with lower threshold in transparency approximating its range of positioning. Figure modified from Reference with permission.

References

    1. Akoulitchev S, Mäkelä TP, Weinberg RA, Reinberg D. 1995. Requirement for TFIIH kinase activity in transcription by RNA polymerase II. Nature 377:557–60 - PubMed
    1. Albright SR, Tjian R. 2000. TAPs revisited: More data reveal new twists and confirm old ideas. Gene 242:1–13 - PubMed
    1. Andel F III, Ladurner AG, Inouye C, Tjian R, Nogales E. 1999. Three-dimensional structure of the human TFIID-IIA-IIB complex. Science 286:2153–56 - PubMed
    1. Bernecky C, Grob P, Ebmeier CC, Nogales E, Taatjes DJ. 2011. Molecular architecture of the human Mediator-RNA polymerase II-TFIIF assembly. PLOS Biol. 9:e1000603. - PMC - PubMed
    1. Bieniossek C, Papai G, Schaffitzel C, Garzoni F, Chaillet M, et al. 2013. The architecture of human general transcription factor TFIID core complex. Nature 493:699–702 - PubMed

MeSH terms

Substances

LinkOut - more resources