Diagnostic performance of isolated-check visual evoked potential versus retinal ganglion cell-inner plexiform layer analysis in early primary open-angle glaucoma
- PMID: 28532392
- PMCID: PMC5440894
- DOI: 10.1186/s12886-017-0472-9
Diagnostic performance of isolated-check visual evoked potential versus retinal ganglion cell-inner plexiform layer analysis in early primary open-angle glaucoma
Abstract
Background: The purpose of this study was to compare the diagnostic performance of isolated-check visual evoked potential (icVEP) with that of retinal ganglion cell-inner plexiform layer (GCILP) analysis using optical coherence tomography (OCT).
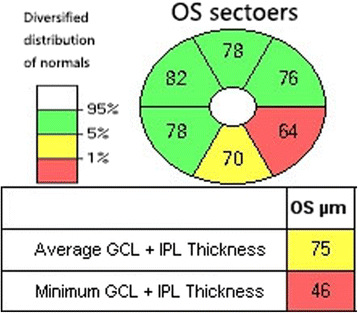
Methods: A total of 45 patients were enrolled: 25 patients with open-angle glaucoma and 20 healthy patients. All patients underwent a complete ophthalmological examination. Moreover, the OCT examination was used to analyze the structures of the GCIPL. The icVEP technique was used to detect the transmission function of the magnocellular pathway, which is mainly managed by the retinal ganglion cells. The quantitative and qualitative comparisons between the diagnostic power of GCIPL analysis and that of icVEP were performed. The areas under the receiver operating characteristic curves (AUC) of GCIPL analysis and icVEP were compared using the Clarke-Pearson method. The sensitivity and specificity of the two techniques were analyzed and compared using the McNemar test.
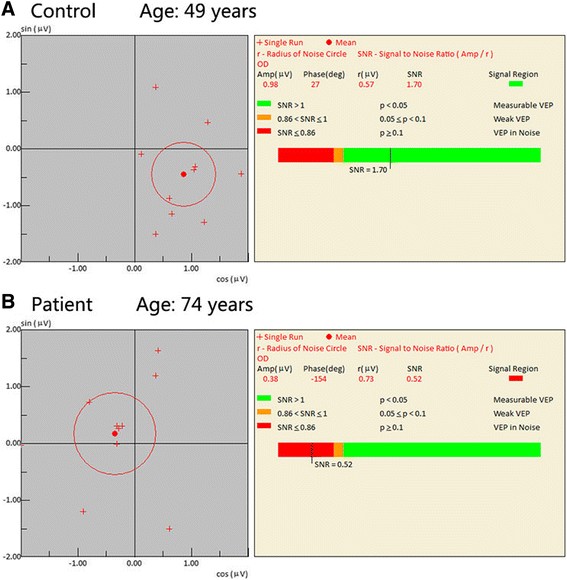
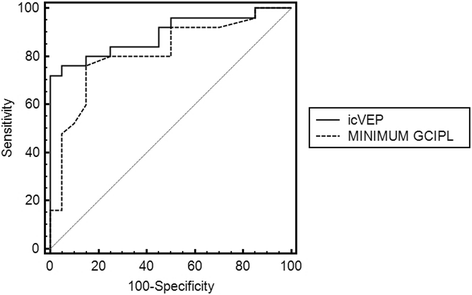
Results: With the quantitative comparison, the AUC of icVEP (AUC = 0.892) was higher than that of GCIPL analysis (AUC = 0.814). However, there was no statistical significance between the AUCs of icVEP and GCIPL (P > 0.05). With the qualitative comparison, the sensitivity of icVEP was 80%, and its specificity was 90%. The sensitivity of GCIPL analysis was 72%, and its specificity was 85%. There was no significant difference between the sensitivitiesor specificities of icVEP and GCIPL analysis (P > 0.05). Moreover, 30 (66.67%) eyeshad similar resultsbetween icVEP and GCIPL analysis, and 15 (33.33%) eyes had different results (7 eyes had abnormal results with GCIPL analysisbut normal results with icVEP, and8 eyes had normal results with GCIPL analysisbut abnormal results with icVEP).
Conclusions: The diagnostic power of icVEP was close to that of GCIPL analysis whether the comparison was based on the qualitative or quantitative data.
Keywords: Glaucomatous optic neuropathy; Isolated-check visual evoked potential; Optical coherence tomography; Signal-to-noise ratios.
Figures


Similar articles
-
Trend-based Analysis of Ganglion Cell-Inner Plexiform Layer Thickness Changes on Optical Coherence Tomography in Glaucoma Progression.Ophthalmology. 2017 Sep;124(9):1383-1391. doi: 10.1016/j.ophtha.2017.03.013. Epub 2017 Apr 12. Ophthalmology. 2017. PMID: 28412067
-
Ganglion Cell-Inner Plexiform Layer Change Detected by Optical Coherence Tomography Indicates Progression in Advanced Glaucoma.Ophthalmology. 2017 Oct;124(10):1466-1474. doi: 10.1016/j.ophtha.2017.04.023. Epub 2017 May 23. Ophthalmology. 2017. PMID: 28549518
-
Comparison of glaucoma diagnostic ability of ganglion cell-inner plexiform layer according to the range around the fovea.BMC Ophthalmol. 2019 Dec 30;19(1):270. doi: 10.1186/s12886-019-1283-y. BMC Ophthalmol. 2019. PMID: 31888556 Free PMC article.
-
Topographic profiles of retinal nerve fiber layer defects affect the diagnostic performance of macular scans in preperimetric glaucoma.Invest Ophthalmol Vis Sci. 2014 Apr 3;55(4):2079-87. doi: 10.1167/iovs.13-13506. Invest Ophthalmol Vis Sci. 2014. PMID: 24576877 Clinical Trial.
-
Diagnostic ability of macular ganglion cell asymmetry for glaucoma.Clin Exp Ophthalmol. 2015 Nov;43(8):720-6. doi: 10.1111/ceo.12545. Epub 2015 Jul 1. Clin Exp Ophthalmol. 2015. PMID: 25939316
Cited by
-
The neuroprotective role of citicoline treatment in glaucoma - 6 months results of a prospective therapeutic trial.Rom J Ophthalmol. 2019 Jul-Sep;63(3):222-230. Rom J Ophthalmol. 2019. PMID: 31687623 Free PMC article.
-
Treatment of glaucomatous optic nerve damage using ginsenoside Rg1 mediated by ultrasound targeted microbubble destruction.Exp Ther Med. 2018 Jan;15(1):300-304. doi: 10.3892/etm.2017.5386. Epub 2017 Oct 27. Exp Ther Med. 2018. PMID: 29375689 Free PMC article.
-
Isolated-check visual evoked potential: a more sensitive tool to detect traumatic optic neuropathy after orbital fracture.Graefes Arch Clin Exp Ophthalmol. 2021 Feb;259(2):547-555. doi: 10.1007/s00417-020-04895-2. Epub 2020 Sep 9. Graefes Arch Clin Exp Ophthalmol. 2021. PMID: 32902756
-
Utility of isolated-check visual evoked potential technique in dysthyroid optic neuropathy.Graefes Arch Clin Exp Ophthalmol. 2023 Jul;261(7):2031-2040. doi: 10.1007/s00417-023-05975-9. Epub 2023 Jan 16. Graefes Arch Clin Exp Ophthalmol. 2023. PMID: 36642765 Free PMC article.
-
Preferential Loss of Contrast Decrement Responses in Human Glaucoma.Invest Ophthalmol Vis Sci. 2022 Oct 3;63(11):16. doi: 10.1167/iovs.63.11.16. Invest Ophthalmol Vis Sci. 2022. PMID: 36264656 Free PMC article.
References
-
- Larrosa JM, Moreno-Montañés J, Martinez-de-la-Casa JM, et al. A diagnostic calculator for detecting glaucoma on the basis of retinal nerve fiber layer, optic disc, and retinal ganglion cell analysis by optical coherence tomography. Invest Ophthalmol Vis Sci. 2015;56(11):6788–6795. doi: 10.1167/iovs.15-17176. - DOI - PubMed
MeSH terms
LinkOut - more resources
Full Text Sources
Other Literature Sources

