. 2017 Nov;92(5):1206-1216.
doi: 10.1016/j.kint.2017.03.026. Epub 2017 May 20.

Image texture features predict renal function decline in patients with autosomal dominant polycystic kidney disease

Affiliations

Image texture features predict renal function decline in patients with autosomal dominant polycystic kidney disease

Timothy L Kline et al. Kidney Int. 2017 Nov.

Abstract

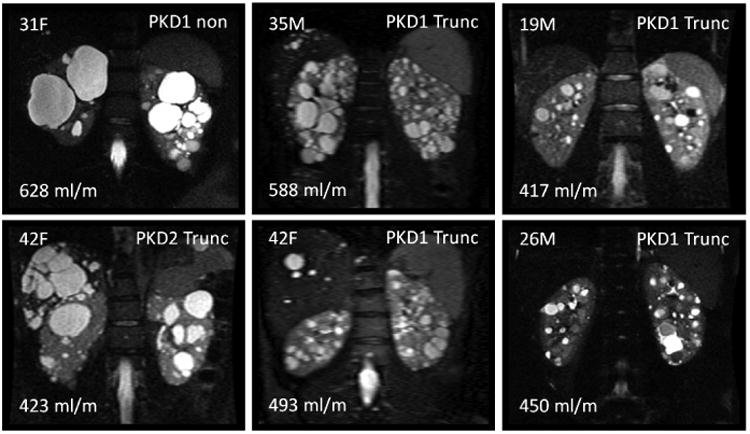
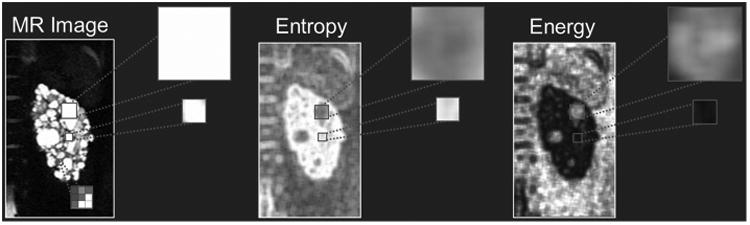
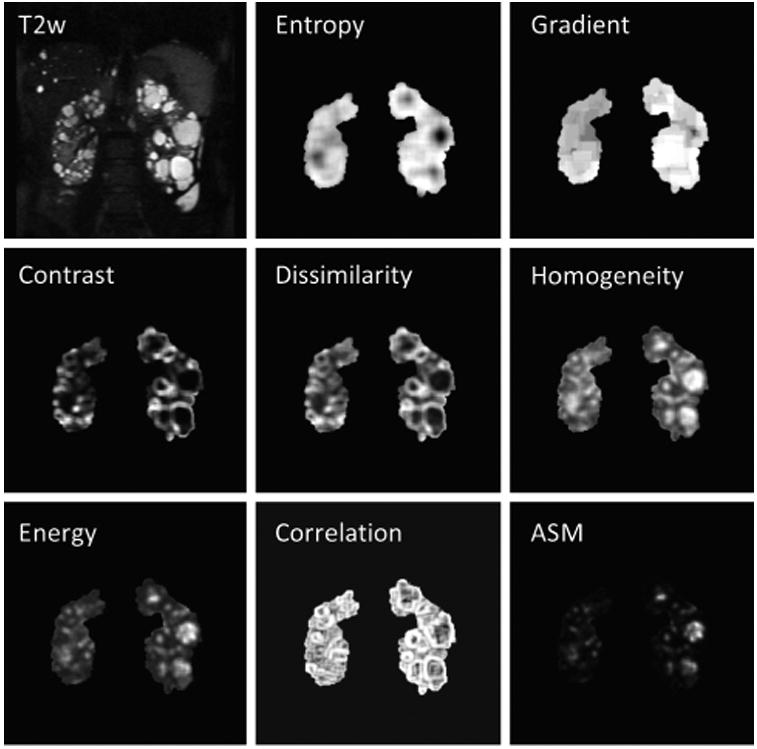
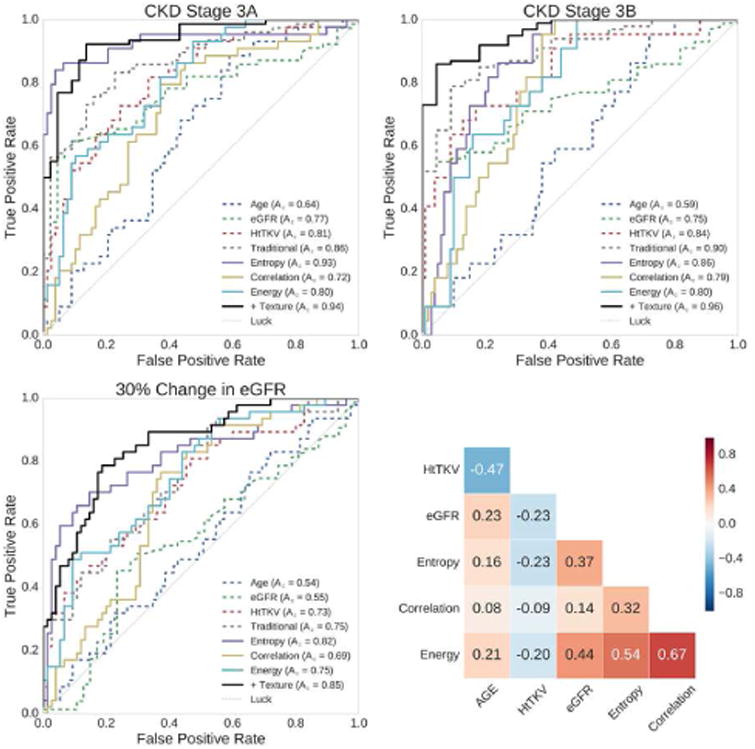
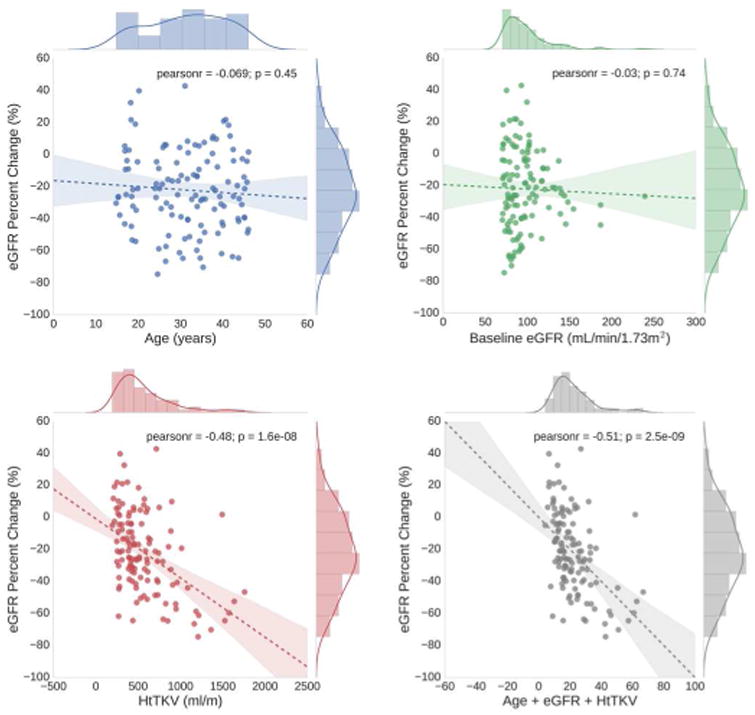
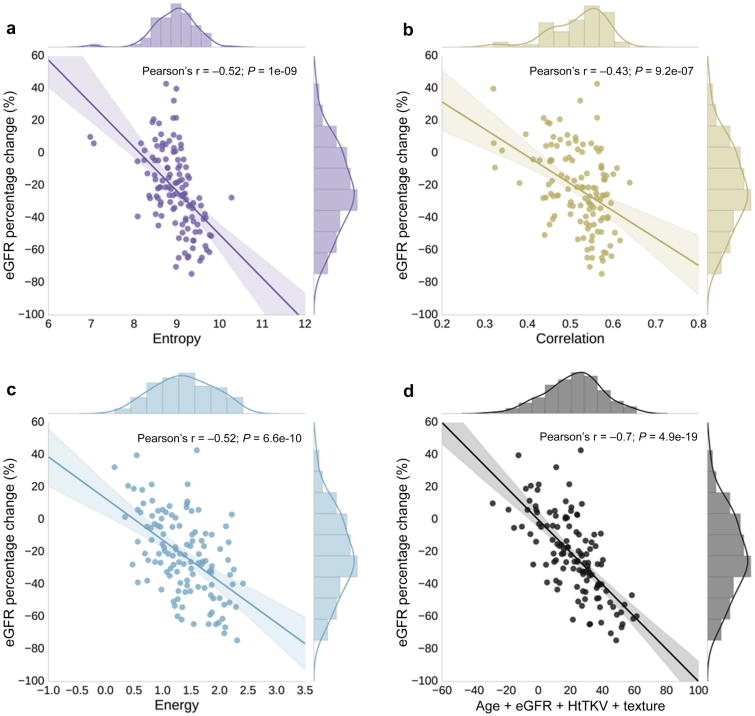
Magnetic resonance imaging (MRI) examinations provide high-resolution information about the anatomic structure of the kidneys and are used to measure total kidney volume (TKV) in patients with Autosomal Dominant Polycystic Kidney Disease (ADPKD). Height-adjusted TKV (HtTKV) has become the gold-standard imaging biomarker for ADPKD progression at early stages of the disease when estimated glomerular filtration rate (eGFR) is still normal. However, HtTKV does not take advantage of the wealth of information provided by MRI. Here we tested whether image texture features provide additional insights into the ADPKD kidney that may be used as complementary information to existing biomarkers. A retrospective cohort of 122 patients from the Consortium for Radiologic Imaging Studies of Polycystic Kidney Disease (CRISP) study was identified who had T2-weighted MRIs and eGFR values over 70 mL/min/1.73m2 at the time of their baseline scan. We computed nine distinct image texture features for each patient. The ability of each feature to predict subsequent progression to CKD stage 3A, 3B, and 30% reduction in eGFR at eight-year follow-up was assessed. A multiple linear regression model was developed incorporating age, baseline eGFR, HtTKV, and three image texture features identified by stability feature selection (Entropy, Correlation, and Energy). Including texture in a multiple linear regression model (predicting percent change in eGFR) improved Pearson correlation coefficient from -0.51 (using age, eGFR, and HtTKV) to -0.70 (adding texture). Thus, texture analysis offers an approach to refine ADPKD prognosis and should be further explored for its utility in individualized clinical decision making and outcome prediction.

Keywords: gray-level co-occurrence matrix; magnetic resonance imaging; multiple linear regression; polycystic kidney disease; total kidney volume.


Figures

Figure 1
Figure 1
Examples highlighting phenotypic differences of 6 different ADPKD patients from this study. Shown in each panel is the age and sex of the patient in the upper left, the genetic mutation in the upper right, and the HtTKV measurement in the bottom left. Although visually many differences are apparent, no quantifiable image-based morphological parameters have yet been utilized beyond TKV and cystic burden of the kidneys to characterize ADPKD phenotypes.
Figure 2
Figure 2
Texture feature analysis is an image processing technique that can inform on phenotypic differences of the kidneys. Shown in the left panel is a T2-weighted MRI of the left kidney of one of the patients in this study. If we consider two different cystic regions (zoomed-in panels), the information (in terms of image intensity) is similar. However, in the two example texture images of Entropy (middle panel) and Energy (right panel), information regarding size and position is ingrained in the image. Notice how the two cyst regions look very different in the texture images, and thus quantifiable values can be extracted which convey tissue structural information such as cyst size and number. Other structural tissue changes (e.g., fibrotic tissue or cyst classification) could likely be conveyed within the texture images.
Figure 3
Figure 3
Examples of the nine derived imaging texture features for a single patient. From top left, by row then column: T2-weighted MR image from which gray scale values are extracted and texture analysis is performed, 1st order Entropy, 1st order Gradient, 2nd order GLCM Contrast, 2nd order GLCM Dissimilarity, 2nd order Homogeneity, 2nd order GLCM Energy, 2nd order GLCM Correlation, and 2nd order GLCM angular second moment (ASM). Entropy - Measures the degree of disorder within the kidney. Kidneys with seemingly random cyst distributions will have a higher Entropy measurement. Note how large cystic regions appear dark, whereas in regions of many small cysts a high Entropy value is calculated. Gradient – is a measure of gray scale changes. Kidneys with many small cysts will have more detectable edges and larger local changes in gray scale. Contrast - Measures the local variations in the gray-level cooccurrence matrix. Low values mean that the gray levels are similar throughout the kidneys. Dissimilarity – Measures differences in GLCM elements, which relates to a measure of renal tissue heterogeneity. Homogeneity – Measures the closeness of the distribution of elements in the GLCM to the GLCM diagonal. Note how both large cystic regions as well as regions with no cystic burden appear bright. Energy – Provides the sum of squared elements in the GLCM and is a measure of tissue uniformity. It is closely related to the inverse of Entropy. Correlation - Measures gray scale value dependence of kidney voxels (the joint probability occurrence of specified pixel pairs). Angular Second Moment (ASM) – Is also a measure of tissue homogeneity.
Figure 4
Figure 4
Individual biomarkers show strong predictive power for progression to CKD stage 3A, CKD stage 3B, and 30% change in eGFR in 8-year follow-up exams. Shown in the top left panel are the ROC curves for prediction to progression of CKD stage 3A, in the top right are the ROC curves for prediction of progression to CKD stage 3B, and in the bottom left are the ROC curves for prediction of a 30% or more decrease in eGFR. The individual biomarkers include age, eGFR, HtTKV, Entropy, Correlation, and Energy. In the bottom right is the correlation matrix showing how the individual features relate to one another. These biomarkers were included in a multiple linear regression model in order to ascertain the added value over traditional image derived modeling. The traditional model (‘Traditional’) used age, eGFR, and HtTKV, while the texture model (‘+ Texture’) also included Entropy, Correlation, and Energy. Compared with the traditional model, the addition of texture improved the predictive power to CKD stage 3A from an Az of 0.86 to an Az of 0.94, to CKD stage 3B from an Az of 0.90 to an Az of 0.96, and for a 30% or more change in eGFR from an Az of 0.75 to an Az of 0.85. Coloring in ROC curves corresponds to colors in Figures 5 and 6, and dashed biomarkers are ‘Traditional’, whereas solid lines are texture based.
Figure 5
Figure 5
Shown here are the regression analyses results, comparing baseline traditional biomarkers (age, baseline eGFR, and HtTKV) to percent change in eGFR at 8 year follow up. Age (top left) and baseline eGFR (top right) have very low correlation, whereas HtTKV (bottom left) has a fairly high correlation, with subsequent percent change in eGFR. A multiple linear regression model incorporating these biomarkers obtained a Pearson's r = -0.51 (bottom right panel). Coloring corresponds to those used for each feature in Figure 4.
Figure 6
Figure 6
Individual texture biomarkers showed strong correlation with subsequent percent change in eGFR. Shown here are the regression analyses results, comparing texture biomarkers (Entropy, Correlation, and Energy) to percent change in eGFR at 8 year follow up. Shown in the bottom right panel is the multiple linear regression model incorporating traditional biomarkers and texture features. This multiple linear regression model incorporating image texture features helped further refine prediction of subsequent renal function decline improving Pearson's r from -0.51 (traditional biomarkers alone, bottom right panel of Figure 5) to -0.70 (addition of image texture features). Coloring corresponds to those used for each feature in Figure 4.

Comment in

References

    1. Chapman AB, Devuyst O, Eckardt KU, et al. Autosomal-dominant polycystic kidney disease (ADPKD): executive summary from a Kidney Disease: Improving Global Outcomes (KDIGO) Controversies Conference. Kidney Int. 2015;88:17–27. - PMC - PubMed
    1. Grantham JJ, Torres VE, Chapman AB, et al. Volume progression in polycystic kidney disease. N Engl J Med. 2016;354:2122–2130. - PubMed
    1. Chapman AB, Bost JE, Torres VE, et al. Kidney volume and functional outcomes in autosomal dominant polycystic kidney disease. Clin J Am Soc Nephrol. 2012;7:479–486. - PMC - PubMed
    1. Bhutani H, Smith V, Rahbari-Oskoui F, et al. A comparison of ultrasound and magnetic resonance imaging shows that kidney length predicts chronic kidney disease in autosomal dominant polycystic kidney disease. Kidney Int. 2015;88:146–151. - PMC - PubMed
    1. Torres VE, Chapman AB, Devuyst O, et al. Tolvaptan in patients with autosomal dominant polycystic kidney disease. N Engl J Med. 2012;367:2407–2418. - PMC - PubMed

Publication types

MeSH terms