Review
. 2017 Jun;137(6):e131-e138.
doi: 10.1016/j.jid.2017.04.001.

Research Techniques Made Simple: High-Throughput Sequencing of the T-Cell Receptor

Affiliations
Review

Research Techniques Made Simple: High-Throughput Sequencing of the T-Cell Receptor

Tiago R Matos et al. J Invest Dermatol. 2017 Jun.

Abstract

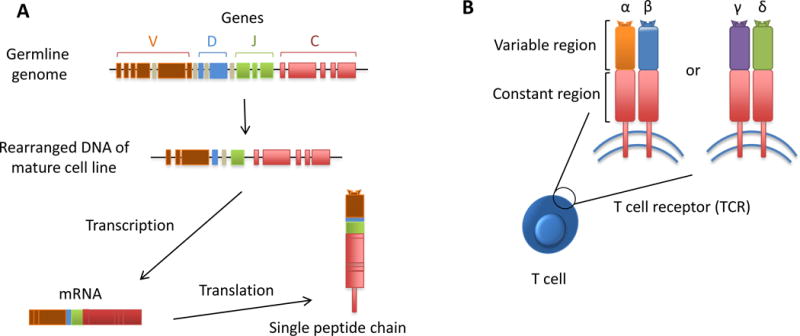
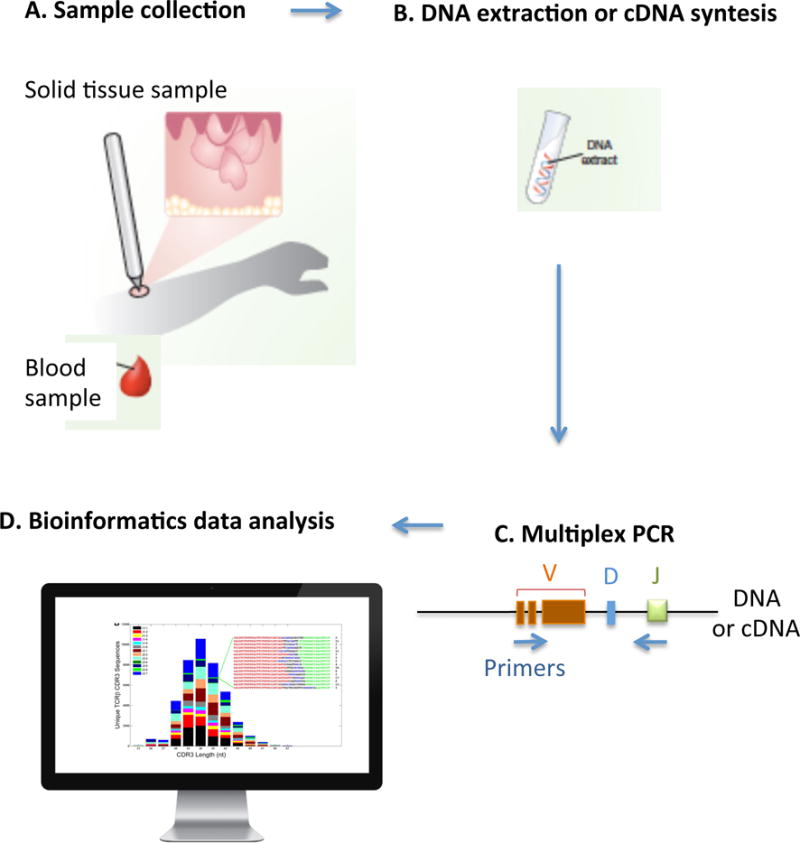
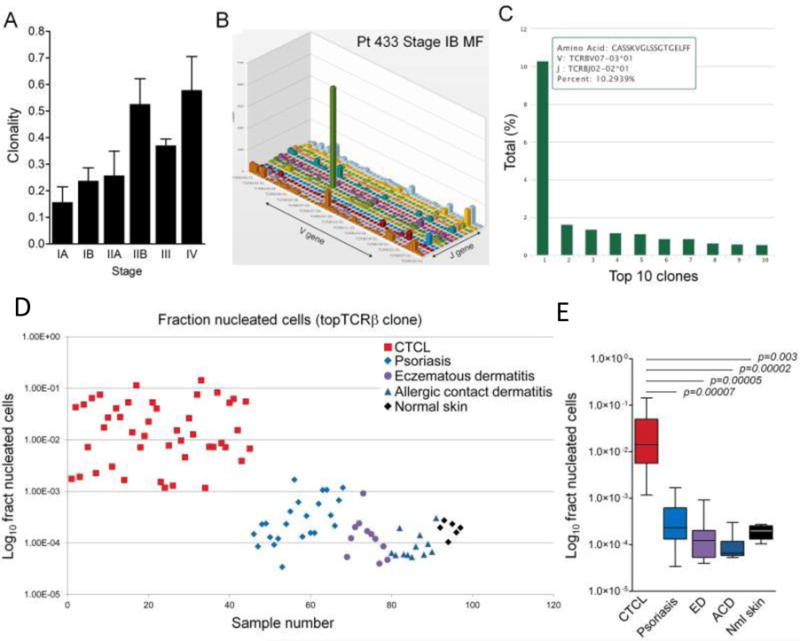
High-throughput sequencing (HTS) of the T-cell receptor (TCR) is a rapidly advancing technique that allows sensitive and accurate identification and quantification of every distinct T-cell clone present within any biological sample. The relative frequency of each individual clone within the full T-cell repertoire can also be studied. HTS is essential to expand our knowledge on the diversity of the TCR repertoire in homeostasis or under pathologic conditions, as well as to understand the kinetics of antigen-specific T-cell responses that lead to protective immunity (i.e., vaccination) or immune-related disorders (i.e., autoimmunity and cancer). HTS can be tailored for personalized medicine, having the potential to monitor individual responses to therapeutic interventions and show prognostic and diagnostic biomarkers. In this article, we briefly review the methodology, advances, and limitations of HTS of the TCR and describe emerging applications of this technique in the field of investigative dermatology. We highlight studying the pathogenesis of T cells in allergic dermatitis and the application of HTS of the TCR in diagnosing, detecting recurrence early, and monitoring responses to therapy in cutaneous T-cell lymphoma.


Conflict of interest statement

Conflict of interests: The authors report no conflicts of interest.

Figures

Figure 1
Figure 1. T-cell receptor can function as a unique identifying bar code of T cells
A) In the germline genome, the multiple gene segments are not being expressed and therefore have not been rearranged. The specificity and diversity occurs during lymphocyte development by combining the distinct V, D and J (Variable, Diversity, Joining) gene segments, and by deletion and/or insertion of nucleotides at the junctions of those segments. This randomized process makes it highly improbable to generate two separate T-cell receptors with the same nucleotide CDR3 sequence. Thus, the TCR nucleotide sequence of each T cell is the equivalent of having an inbuilt bar code that enables us to recognize and track each specific T-cell clone. The mRNAs are then translated into the peptide chains of the TCR. B) TCR are heterodimer molecules that can be either a combination of either α and β chains or γ and δ chains.
Figure 2
Figure 2. High-throughput TCR sequencing
A) The biologic sample of interest is collected. B) DNA is extracted or complementary DNA (cDNA) is synthetized. C) Bias-controlled multiplexed PCR amplifies and sequences the CDR3 from the DNA or cDNA. Then, bias-controlled V and J gene primers are used to amplify the rearranged V(D)J segments. D) Bioinformatics can then be used to identify, quantify and track each individual lymphocyte as well as the entire repertoire within any sample of interest. It is possible to identify and quantify the unique CD3 segments and the V, D, and J genes within each rearrangement, based on previously described sequences incorporated in data banks.
Figure 3
Figure 3. High-throughput TCR CDR3 sequencing captures entire T-cell diversity
(A) Comparison of standard TCRβ spectratype data and calculated TCRβ CDR3 length distributions for sequences using representative TCR Vβ gene segments. CDR3 length is plotted along the x-axis and the number of unique CDR3 sequences with that length or the relative intensity of the corresponding peak in the spectratype is plotted along the y-axis. The length of the differently colored segments within each bar of the histograms indicates the fraction of unique CDR3 sequences that were observed 1 to 5 times (black), 6 to 10 times (blue), 11 to 100 times (green), or more than 100 times (red). (B) A representative spectratype of TCRβ CDR3 cells that use the Vβ10 gene segment. The CDR3 sequences were sorted by CDR3 length into a frequency histogram, and the sequences within each length were then color-coded on the basis of their Jβ use. The inset represents CDR3 sequences having a length of 39 nucleotides (nt), as well as the number of times that each of these sequences was observed in the data. The origin of the nucleotides in each sequence is color-coded as follows: Vβ gene segment, red; template-independent N nucleotide, black; Dβ gene segment, blue; Jβ gene segment, green. Reprinted from Robins et al. 2009.
Figure 4
Figure 4. High throughput TCRβ CDR3 region sequencing identifies expanded T-cell clones and discriminates CTCL from benign inflammatory skin disorders
(A) Clonality of lesional skin T cells increased with advanced stage of CTCL. (B, C) TCR sequencing identified expanded populations of clonal malignant T cells in CTCL skin lesions. The V versus J gene usages of T cells from a lesional skin sample are shown (B). The green peak includes the clonal malignant T-cell population. (C) The individual T-cell clone sequence is shown with detailed information on the CDR3 amino acid sequence and V and J gene usage. The nine most frequent TCR sequences of benign infiltrating T cells are also shown. In this patient, the malignant T-cell clone made up 10.3% of the total T-cell population in lesional skin. (D, E) The most frequent T-cell clone expressed as the fraction of total nucleated cells successfully discriminates CTCL from benign inflammatory skin diseases. The most frequent TCR sequence expressed as a fraction of total nucleated cells is shown for individual samples (D) and aggregate data (E). This analysis allowed discrimination of CTCL from benign inflammatory skin diseases and healthy skin. Reprinted from Kirsch et al. 2015.

References

    1. Chitgopeker P, Sahni D. T-Cell Receptor Gene Rearrangement Detection in Suspected Cases of Cutaneous T-Cell Lymphoma. J Invest Dermatol. 2014;134:e19. - PubMed
    1. Chung WH, Pan RY, Chu MT, Chin SW, Huang YL, Wang WC, et al. Oxypurinol-Specific T Cells Possess Preferential TCR Clonotypes and Express Granulysin in Allopurinol-Induced Severe Cutaneous Adverse Reactions. J Invest Dermatol. 2015 Sep;135(9):2237–48. - PubMed
    1. Gaide O, Emerson RO, Jiang X, Gulati N, Nizza S, Desmarais C, et al. Common clonal origin of central and resident memory T cells following skin immunization. Nat Med. 2015;21:647–653. - PMC - PubMed
    1. Howie B, Sherwood AM, Berkebile AD, Berka J, Emerson RO, Williamson DW, et al. High-throughput pairing of T cell receptor α and β sequences. Sci Transl Med. 2015 Aug 19;7(301):301ra131. - PubMed
    1. Kirsch IR, Watanabe R, O’Malley JT, Williamson DW, Scott LL, Elco CP, et al. TCR sequencing facilitates diagnosis and identifies mature T cells as the cell of origin in CTCL. Sci Transl Med. 2015 Oct 7;7(308):308ra158. - PMC - PubMed

Publication types

MeSH terms

Substances