. 2017 Sep;31(9):3950-3965.
doi: 10.1096/fj.201600857RRR. Epub 2017 May 22.

Serum amyloid A: an ozone-induced circulating factor with potentially important functions in the lung-brain axis

Affiliations

Serum amyloid A: an ozone-induced circulating factor with potentially important functions in the lung-brain axis

Michelle A Erickson et al. FASEB J. 2017 Sep.

Erratum in

  • Erratum.
    Erickson MA, Jude J, Zhao H, Rhea EM, Salameh TS, Jester W, Pu S, Harowitz J, Nguyen N, Banks WA, Panettieri RA Jr, Jordan-Sciutto KL. Erickson MA, et al. FASEB J. 2018 Jan;32(1):535. doi: 10.1096/fj.201600857RRRERR. FASEB J. 2018. PMID: 29295887 Free PMC article. No abstract available.

Abstract

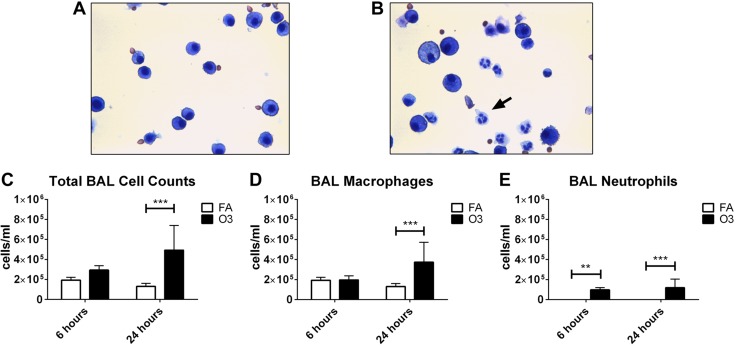
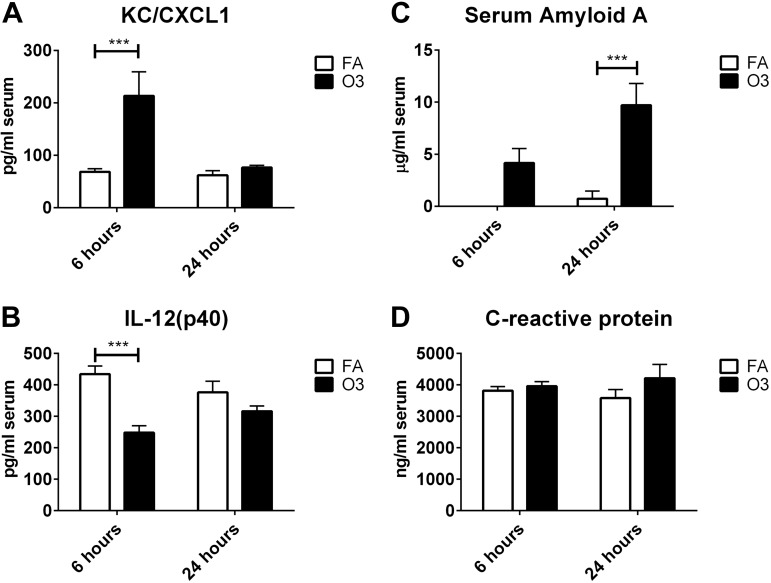
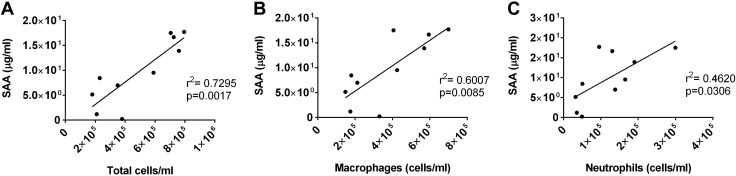
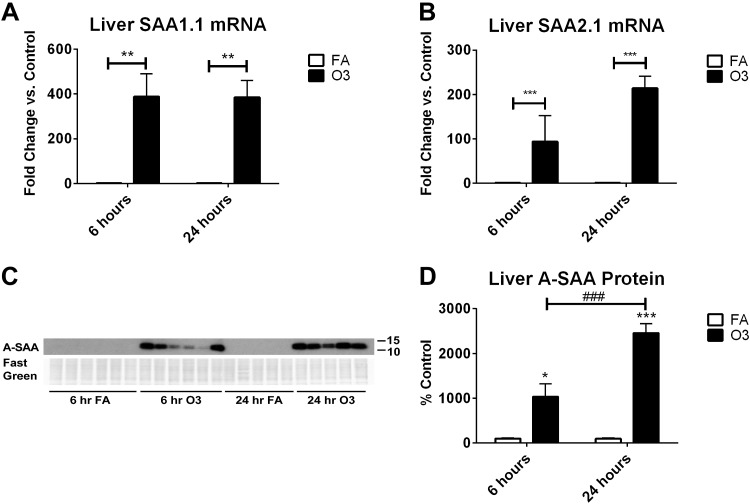
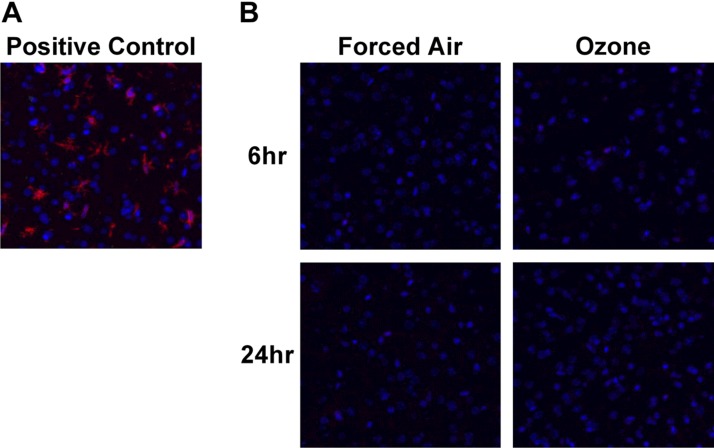
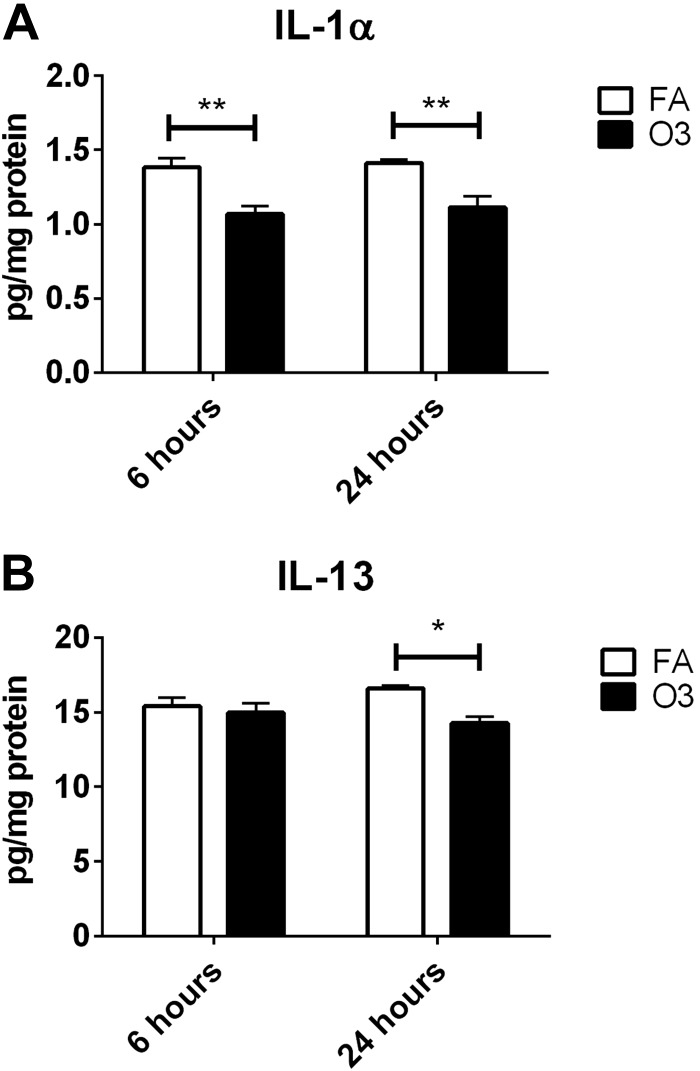
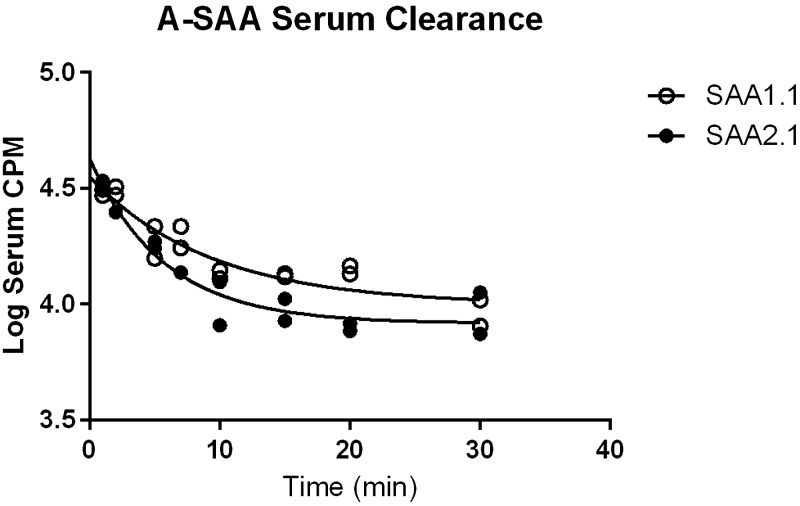
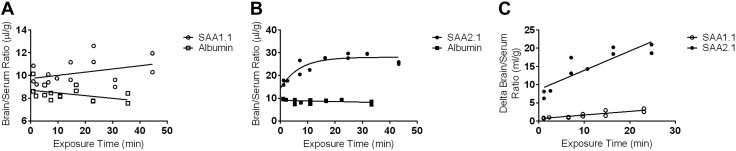
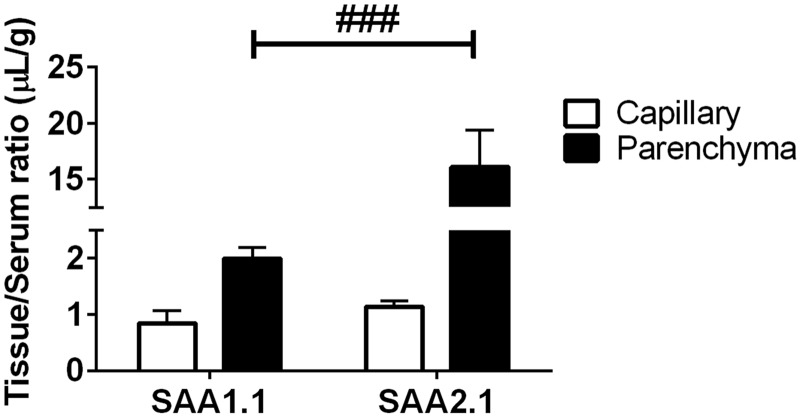
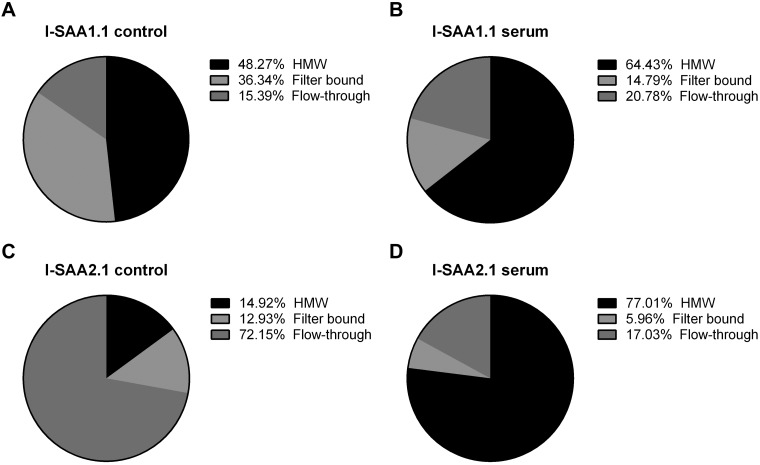
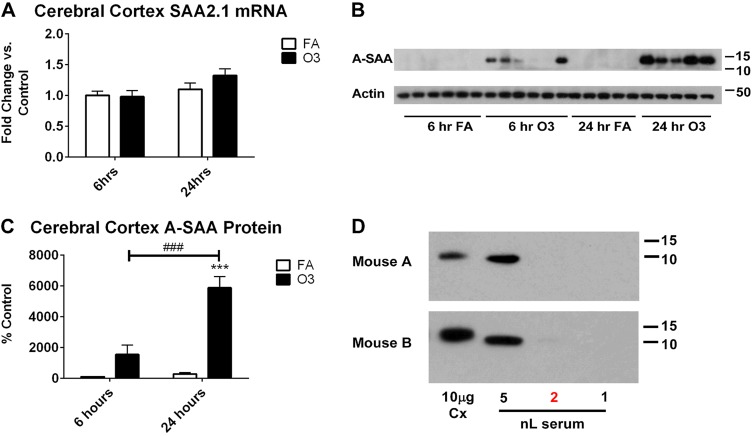
Accumulating evidence suggests that O3 exposure may contribute to CNS dysfunction. Here, we posit that inflammatory and acute-phase proteins in the circulation increase after O3 exposure and systemically convey signals of O3 exposure to the CNS. To model acute O3 exposure, female Balb/c mice were exposed to 3 ppm O3 or forced air for 2 h and were studied after 6 or 24 h. Of 23 cytokines and chemokines, only KC/CXCL1 was increased in blood 6 h after O3 exposure. The acute-phase protein serum amyloid A (A-SAA) was significantly increased by 24 h, whereas C-reactive protein was unchanged. A-SAA in blood correlated with total leukocytes, macrophages, and neutrophils in bronchoalveolar lavage from O3-exposed mice. A-SAA mRNA and protein were increased in the liver. We found that both isoforms of A-SAA completely crossed the intact blood-brain barrier, although the rate of SAA2.1 influx was approximately 5 times faster than that of SAA1.1. Finally, A-SAA protein, but not mRNA, was increased in the CNS 24 h post-O3 exposure. Our findings suggest that A-SAA is functionally linked to pulmonary inflammation in our O3 exposure model and that A-SAA could be an important systemic signal of O3 exposure to the CNS.-Erickson, M. A., Jude, J., Zhao, H., Rhea, E. M., Salameh, T. S., Jester, W., Pu, S., Harrowitz, J., Nguyen, N., Banks, W. A., Panettieri, R. A., Jr., Jordan-Sciutto, K. L. Serum amyloid A: an ozone-induced circulating factor with potentially important functions in the lung-brain axis.

Keywords: acute-phase proteins; air pollution; blood-brain barrier; cytokines; microglia.


Conflict of interest statement

This work was supported by the U. S. National Institutes of Health (NIH) National Institute of Environmental Health Sciences (Grants T32ES019851 to M.A.E. and J.J., and F32ES025076 to M.A.E.), NIH National Institute of Neurological Disorders and Stroke (Grant R21NS093368 to W.A.B. and T.S.S.), NIH National Institute on Aging (Grant T32AG000057 to E.M.R.); and NIH National Institute of Mental Health (Grants R01MH106967 to K.L.J.-S. and P30ES013508 to R.A.P.).

Figures

Figure 1.
Figure 1.
Pulmonary inflammation after O3 exposure. A, B) Representative images of cells in BAL 24 h after FA (FA; A) or O3 (B) exposure are shown in the upper panel. Images were captured with a ×40 objective. The arrow in panel B indicates a neutrophil. CE) Measurements of total cells (C), macrophages (D), and neutrophils (E) in BAL are shown in the lower panel (n = 6–10 animals per group). **P < 0.01, ***P < 0.001.
Figure 2.
Figure 2.
O3-induced changes in inflammatory and acute-phase proteins in serum. A, B) Analytes on a multiplex panel that were found to be significantly changed with O3 treatment include the chemokine CXCL1 (A) and the p40 subunit of IL-12 (B; n = 6/group). C, D) Measurements of A-SAA (C) and CRP (D) in serum were performed by using ELISA (n = 6–10/group). ***P < 0.001.
Figure 3.
Figure 3.
Correlation of SAA levels in serum with cellular components of BAL. Serum SAA concentrations were correlated with BAL total cells (A), macrophages (B), and neutrophils (C) in mice 24 h post-O3 exposure (n = 10/group).
Figure 4.
Figure 4.
O3-induced changes in SAA in the liver. A, B) Relative changes in mRNA expression of A-SAA isoforms, SAA1.1 (A) and SAA2.1 (B) were measured by quantitative PCR (n = 6/group). C, D) Western blot of A-SAA in liver homogenates (10 µg protein/well; C) and quantification of relative changes in protein expression (D) are shown (n = 5–6/group). *P < 0.05, **P < 0.01, ***P < 0.001 vs. FA control; ###P < 0.001 vs. group indicated (D).
Figure 5.
Figure 5.
Absence of gliosis after O3 exposure. A) Iba-1–positive microglia (red) and DAPI (blue) observed in the frontal cortex of an MHV-infected mouse, a positive control for microgliosis. B) Representative images of Iba-1–stained frontal cortex of mice 6 or 24 h after FA or O3 exposure. A total of 4 mouse brains were assessed for each group. Images were captured with a ×20 objective.
Figure 6.
Figure 6.
Significant changes in cytokines in the cortex. Changes in IL-1α (A) and IL-13 (B) were detected by using a bead-based multiplex assay (n = 6/group). *P < 0.05, **P < 0.01.
Figure 7.
Figure 7.
Serum clearance of SAA1.1 and SAA2.1. Data from these plots were used to calculate exposure time.
Figure 8.
Figure 8.
Brain uptake of A-SAA isoforms. Thirty-minute uptake curves are plotted for SAA1.1 (open circles; A) and SAA2.1 (filled circles; B). Open and filled squares in panels A and B, respectively, represent data points from albumin uptake curves, which indicate vascular space. Uptake within the first 15 min is plotted in panel C, where the SAA1.1 and SAA2.1 data points were corrected for vascular space by subtracting the albumin brain/serum ratio (δ). Unidirectional influx constants that were calculated from these curves were as follows: 0.1003 ± 0.01677 μl/g/min (r2 = 0.7817; df = 10) and 0.5308 ± 0.1004 μl/g/min (r2 = 0.7773; df = 8) for SAA1.1 and SAA2.1, respectively. Both slopes were significantly nonzero and significantly different from each other. P < 0.001.
Figure 9.
Figure 9.
SAA partitioning into capillary and parenchyma. Tissue/serum (T/S) ratios of SAA1.1 and SAA2.1 in the capillary and parenchymal brain fractions after 15 min of circulation time are shown. T/S ratios were corrected for vascular space by subtracting albumin T/S ratios. Percentage of SAA in the capillary fractions were 29.8 and 6.6% for SAA1.1 and SAA2.1, respectively. Percentage of SAA in the parenchymal fractions were 70.2 and 93.4% for SAA1.1 and SAA2.1, respectively. Statistical differences in SAA1.1 and SAA2.1 partitioning were determined. ###P < 0.001 vs. group indicated (n = 3/group).
Figure 10.
Figure 10.
Detection of high-MW (HMW) species of SAA1.1 and SAA2.1. The proportions of I-SAA1.1 (A, B) and I-SAA2.1 (C, D) that are >100 kDa (high MW), <100 kDa (flow-through), or that remained stuck to the filter (filter bound) before (A, C; n = 1/group) or 15 min after (B, D; n = 4/group) intravenous injection in CD1 mice. For the postinjection group, data are the average of 4 biologic replicates.
Figure 11.
Figure 11.
O3-induced changes in SAA in the brain. A) Relative changes in mRNA expression of acute phase SAA2.1 isoform were determined by quantitative PCR (n = 6/group). SAA1.1 mRNA was undetectable in the brain (data not shown). B, C) Protein levels of A-SAA in protein extracts from the cerebral cortex were determined by Western blot (B), and protein expression was quantified (C; n = 5–6 samples per group). ***P < 0.001 vs. FA; ###P < 0.001 vs. group indicated. D) Verification that A-SAA levels in brain exceed that which would be predicted by vascular space (threshold, 2 nl; shown in red) were determined by Western blot.

References

    1. Lelieveld J., Evans J. S., Fnais M., Giannadaki D., and Pozzer A. (2015) The contribution of outdoor air pollution sources to premature mortality on a global scale. Nature 525, 367–371 - PubMed
    1. Chen J. C., and Schwartz J. (2009) Neurobehavioral effects of ambient air pollution on cognitive performance in US adults. Neurotoxicology 30, 231–239 - PubMed
    1. Jung C. R., Lin Y. T., and Hwang B. F. (2015) Ozone, particulate matter, and newly diagnosed Alzheimer’s disease: a population-based cohort study in Taiwan. J. Alzheimers Dis. 44, 573–584 - PubMed
    1. Wu Y. C., Lin Y. C., Yu H. L., Chen J. H., Chen T. F., Sun Y., Wen L. L., Yip P. K., Chu Y. M., and Chen Y. C. (2015) Association between air pollutants and dementia risk in the elderly. Alzheimers Dement. (Amst.) 1, 220–228 - PMC - PubMed
    1. Montresor-López J. A., Yanosky J. D., Mittleman M. A., Sapkota A., He X., Hibbert J. D., Wirth M. D., and Puett R. C. (2016) Short-term exposure to ambient ozone and stroke hospital admission: a case-crossover analysis. J. Expo. Sci. Environ. Epidemiol. 26, 162–166 - PubMed

Publication types