. 2017 Jun 6;114(23):6098-6103.
doi: 10.1073/pnas.1705823114. Epub 2017 May 22.

Visualization and characterization of individual type III protein secretion machines in live bacteria

Affiliations

Visualization and characterization of individual type III protein secretion machines in live bacteria

Yongdeng Zhang et al. Proc Natl Acad Sci U S A. .

Abstract

Type III protein secretion machines have evolved to deliver bacterially encoded effector proteins into eukaryotic cells. Although electron microscopy has provided a detailed view of these machines in isolation or fixed samples, little is known about their organization in live bacteria. Here we report the visualization and characterization of the Salmonella type III secretion machine in live bacteria by 2D and 3D single-molecule switching superresolution microscopy. This approach provided access to transient components of this machine, which previously could not be analyzed. We determined the subcellular distribution of individual machines, the stoichiometry of the different components of this machine in situ, and the spatial distribution of the substrates of this machine before secretion. Furthermore, by visualizing this machine in Salmonella mutants we obtained major insights into the machine's assembly. This study bridges a major resolution gap in the visualization of this nanomachine and may serve as a paradigm for the examination of other bacterially encoded molecular machines.

Keywords: Salmonella virulence; bacterial nanomachines; bacterial pathogenesis; protein secretion; superresolution microscopy.


Conflict of interest statement

Conflict of interest statement: J.B. discloses significant financial interest in Bruker Corp. and Hamamatsu Photonics.

Figures

Fig. 1.
Fig. 1.
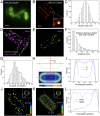
Visualization of the S. Typhimurium type III secretion needle complex by superresolution microscopy. (A) Schematic representation of the S. Typhimurium type III secretion injectisome. (B), Wide-field (imaging mEos3.2 without photoactivation) (B) and superresolution (2D) (C) images of live S. Typhimurium expressing mEos3.2-PrgH. [Scale bar: 1 µm (B); 500 nm (C); 50 nm (Inset, C).] (D) Distribution of the cluster sizes (mean size 45.98 ± 0.05 nm; 7,295 clusters examined). (E) Two-color superresolution image (2D) of fixed S. Typhimurium expressing mEos3.2-PrgH stained with an AF647-labeled antibody directed to an epitope tag present in the needle tip protein SipD. (Scale bar: 500 nm.) (F) Nearest neighbor distance between the fluorescent clusters associated with PrgH and SipD (mean distance 101 ± 1 nm; 3,976 clusters measured). (G) A 2D histogram of all clusters from all bacteria. The position of each cluster was normalized to the cell dimensions (see diagram), and clusters were placed on the first quadrant of the cell and mirrored to the other quadrants. (H) Normalized cluster density along the x and y axes. Only localizations within the dashed region in G were used for the calculation of the density along the y axis to eliminate the effect of the reduced radius at the bacterial poles. (I) 4Pi-SMSN image (3D) of mEos3.2-PrgH. (J) The 3D distribution of PrgH clusters accumulated from 58 bacteria cells. Each dot represents the center position of a cluster. Inset images (3D) in I and J show the yz view of the clusters within the center half of the cell. (Scale bar: 500 nm.) (K) Normalized cluster density along the axial (x) and radial (yz plane) directions of the clusters shown in J. Only clusters within the center half of the cells were used for the calculations of the cluster density along the radial direction. (L) Number of mEos3.2-PrgH clusters observed in live bacteria (mean number per bacteria 12.5 ± 0.7; 585 bacterial cells analyzed).
Fig. 2.
Fig. 2.
Visualization of the type III secretion sorting platform by superresolution microscopy. (A and B) Wide-field (A) and superresolution (2D) (B) images of live S. Typhimurium expressing mEos3.2-SpaO. [Scale bar: 1 µm (A); 500 nm (B); 50 nm (Inset, B)]. (C) Distribution of the cluster sizes (measured as full width at half-maxima) (mean size 47.58 ± 0.04 nm of 12,710 clusters examined). (D and E) Two-color superresolution image (2D) of fixed S. Typhimurium expressing mEos3.2-SpaO stained with an AF647-labeled antibody directed to an epitope tag present in the type III secretion needle tip protein SipD. An image (2D) of an identically processed control sample of S. Typhimurium expressing a nontagged SipD protein is shown in E. (Scale bar: 500 nm.) (F) Distance between the fluorescent clusters associated with SpaO and SipD (mean distance 106 ± 2 nm; 2,952 clusters measured). (G) Number of mEos3.2-SpaO clusters observed in live bacteria (mean number per bacteria 21.4 ± 0.3; 595 bacterial cells analyzed). (H) A 2D histogram of clusters (bin cluster positions from all bacteria as described for PrgH). (I) Normalized cluster density along the x and y axes. Only localizations within the dashed region in H (half length of the cell) were used for the calculation of the density along the y axis to exclude the localizations from the bacterial poles. (J) 4Pi-SMSN image (3D) of S. Typhimurium expressing mEos3.2-SpaO. (K) The 3D distribution of SpaO clusters from 65 bacteria cells. Each dot represents the center position of a cluster. Inset images in J and K show the yz view of the clusters within the center half of the cell. (Scale bar: 500 nm.) (L) Normalized cluster density along the axial (x) and radial (yz plane) direction of the clusters shown in K. Only clusters within the center half of the cell were used for the calculation of the cluster density along the radial direction.
Fig. 3.
Fig. 3.
Visualization and stoichiometry of type III secretion sorting platform and export apparatus components by superresolution microscopy. (A) Superresolution images (2D) of live S. Typhimurium expressing the mEos3.2-tagged sorting platform components OrgA, OrgB, InvC, or InvI and the export apparatus component InvA. All images are adjusted for optimal contrast. Numbers above the white boxes indicate the number of localizations within the indicated areas in each image. InvI contains primarily individual localizations. (Scale bar: 500 nm.) (B) Number of fluorescent clusters observed in the indicated live bacterial strains. (C) Size of the fluorescent clusters associated with the indicated proteins. (D) Normalized cluster density along the y axis in the indicated bacteria. (E) Estimated number of molecules per cluster in the indicated bacterial strains. Numbers represent the mean ± SE (B and C) or the mean ± SD (E) and are derived from the analysis of between 237 and 642 cells per bacterial strain (SI Appendix, Table S1).
Fig. 4.
Fig. 4.
Examination of the sorting-platform assembly and effector protein localization by superresolution microscopy. (A) Effect of the absence of sorting platform, export apparatus, or needle complex components on the localization of the sorting-platform core component SpaO. Shown are superresolution images (2D) of wild-type S. Typhimurium or the indicated deletion mutant strains expressing mEos3.2-SpaO. (Scale bar: 500 nm.) (B) Number of fluorescent clusters observed in the indicated live bacterial strains. Numbers represent the mean ± SE (mean numbers: wild type, 21.4 ± 0.3; ∆invC, 3.1 ± 0.1; ∆invI, 11.8 ± 0.2). (C) Normalized SpaO-mEos3.2 fluorescent cluster density along y axis in the indicated live bacterial strains. Clusters were not detected in the other strains. When clusters were present, at least 595 bacterial cells were analyzed (SI Appendix, Table S1).
Fig. 5.
Fig. 5.
Localization of effector proteins in live bacteria. (A) Localization of the effector protein SopB in live bacteria. Shown are superresolution images (2D) of wild-type S. Typhimurium or the indicated deletion mutant strains expressing SopB-mEos3.2. (Scale bar: 500 nm.) (B) Normalized SopB-mEos3.2 fluorescent cluster density along the y axis in the indicated live bacterial strains. At least 543 bacteria per indicated strain were analyzed (SI Appendix, Table S1). (C) Number of SopB-mEos3.2 fluorescent clusters observed in the indicated live bacterial strains. Numbers represent the mean ± SE of a minimum of 543 cells analyzed per bacterial strains (SI Appendix, Table S1). (D) Ratio of total SopB-mEos3.2–associated fluorescence visualized in clusters. Numbers are the mean ± SE of the indicated strains. In each case, at least 543 bacteria were analyzed.

References

    1. Galán JE, Lara-Tejero M, Marlovits TC, Wagner S. Bacterial type III secretion systems: Specialized nanomachines for protein delivery into target cells. Annu Rev Microbiol. 2014;68:415–438. - PMC - PubMed
    1. Cornelis GR. The type III secretion injectisome, a complex nanomachine for intracellular ‘toxin’ delivery. Biol Chem. 2010;391:745–751. - PubMed
    1. Gu L, Zhou S, Zhu L, Liang C, Chen X. Small-molecule inhibitors of the type III secretion system. Molecules. 2015;20:17659–17674. - PMC - PubMed
    1. Charro N, Mota LJ. Approaches targeting the type III secretion system to treat or prevent bacterial infections. Expert Opin Drug Discov. 2015;10:373–387. - PubMed
    1. Tsou LK, et al. Antibacterial flavonoids from medicinal plants covalently inactivate type III protein secretion substrates. J Am Chem Soc. 2016;138:2209–2218. - PMC - PubMed

Publication types

MeSH terms

Substances