. 2017 Jun 6;114(23):5906-5911.
doi: 10.1073/pnas.1703255114. Epub 2017 May 22.

Mechanosensing of shear by Pseudomonas aeruginosa leads to increased levels of the cyclic-di-GMP signal initiating biofilm development

Affiliations

Mechanosensing of shear by Pseudomonas aeruginosa leads to increased levels of the cyclic-di-GMP signal initiating biofilm development

Christopher A Rodesney et al. Proc Natl Acad Sci U S A. .

Erratum in

Abstract

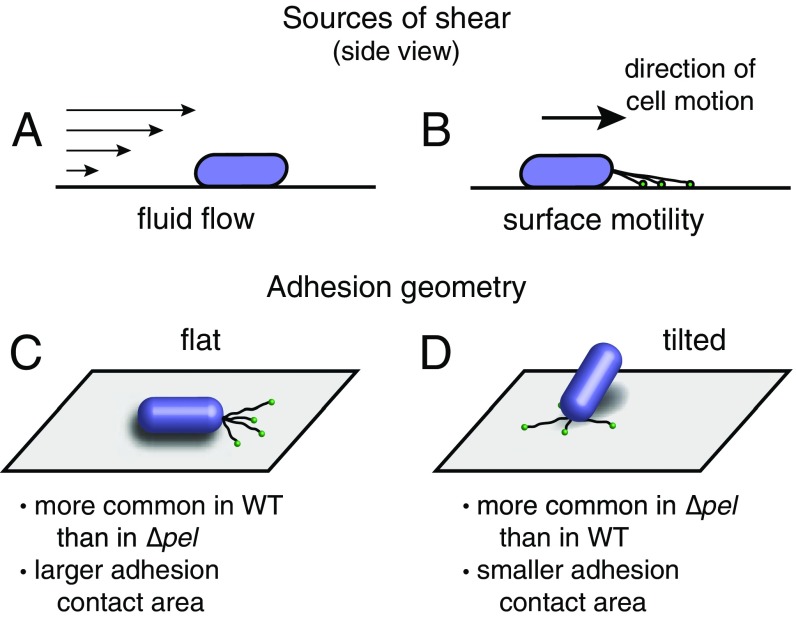
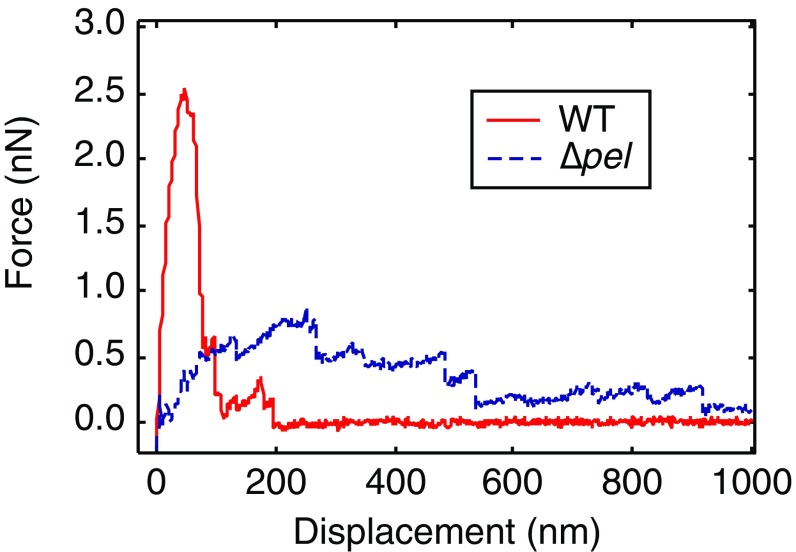
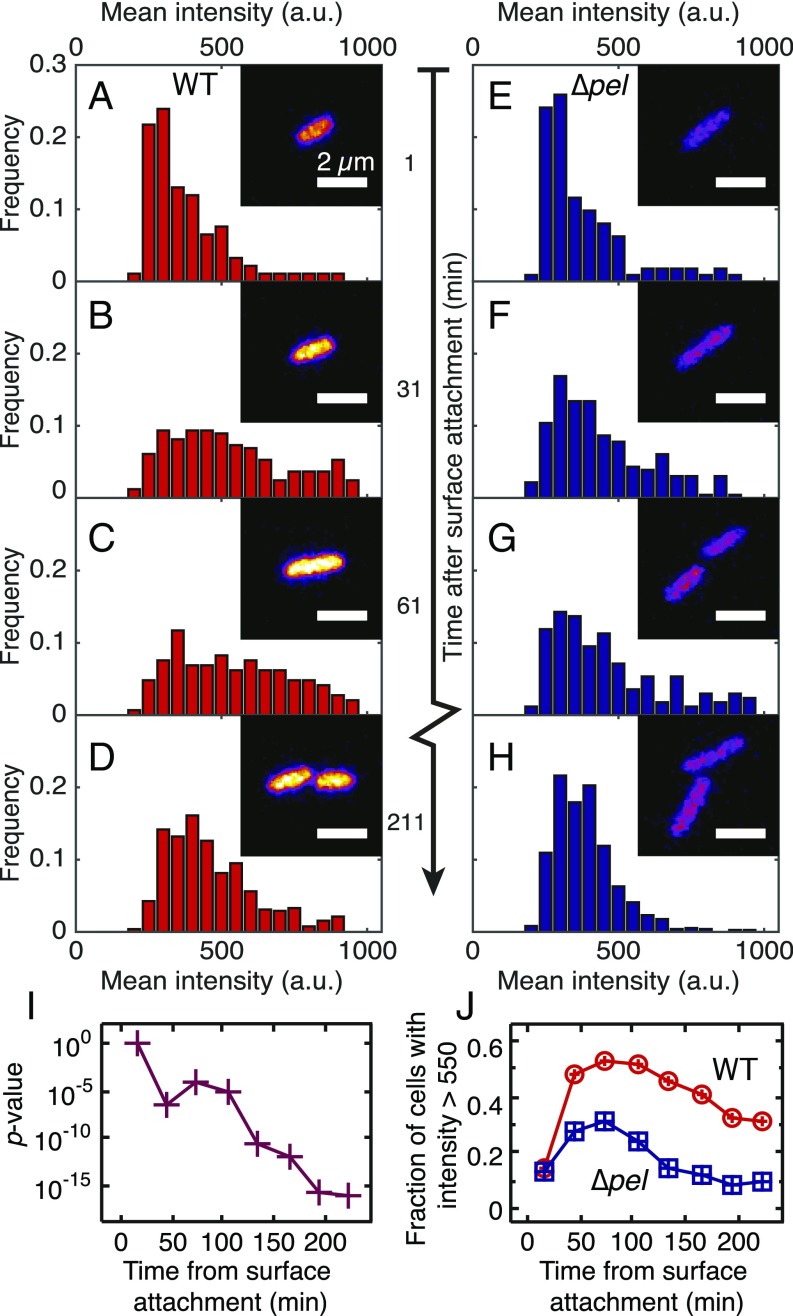
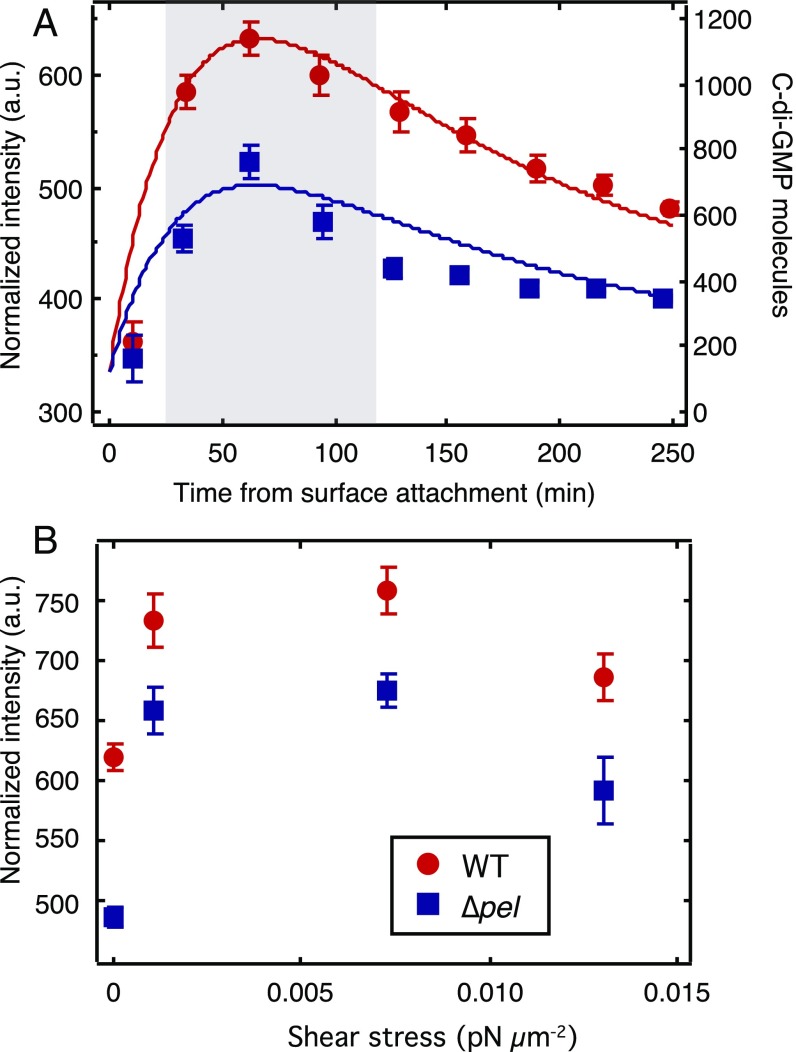
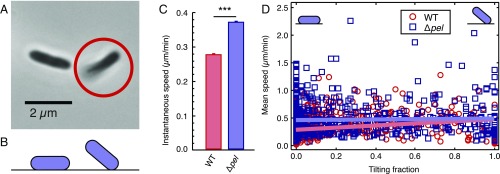
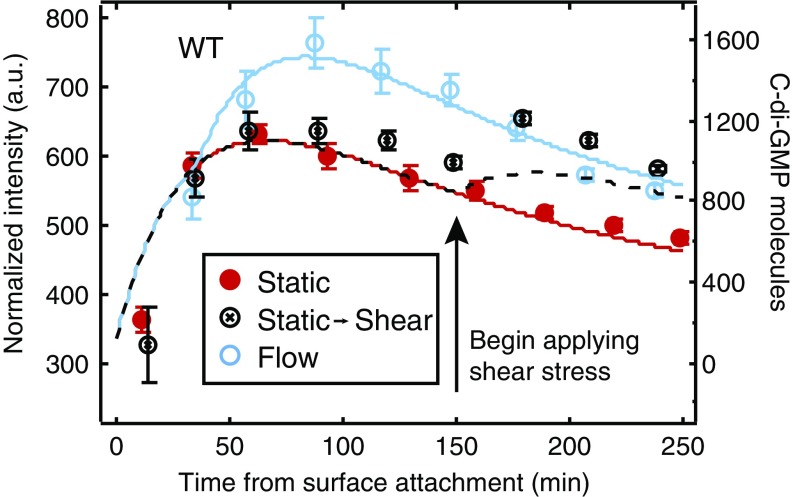
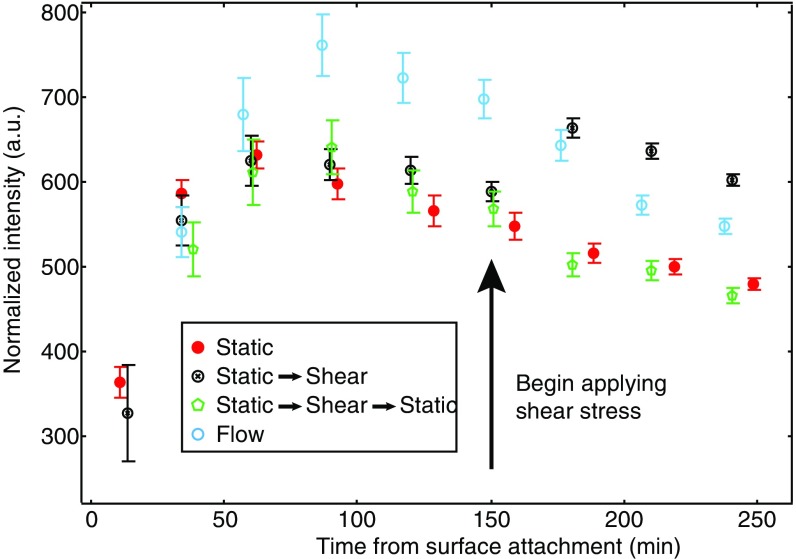
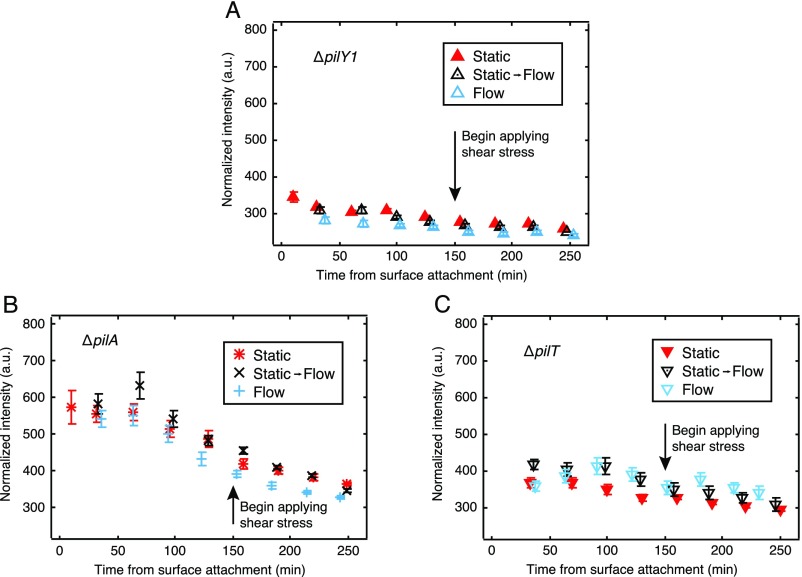
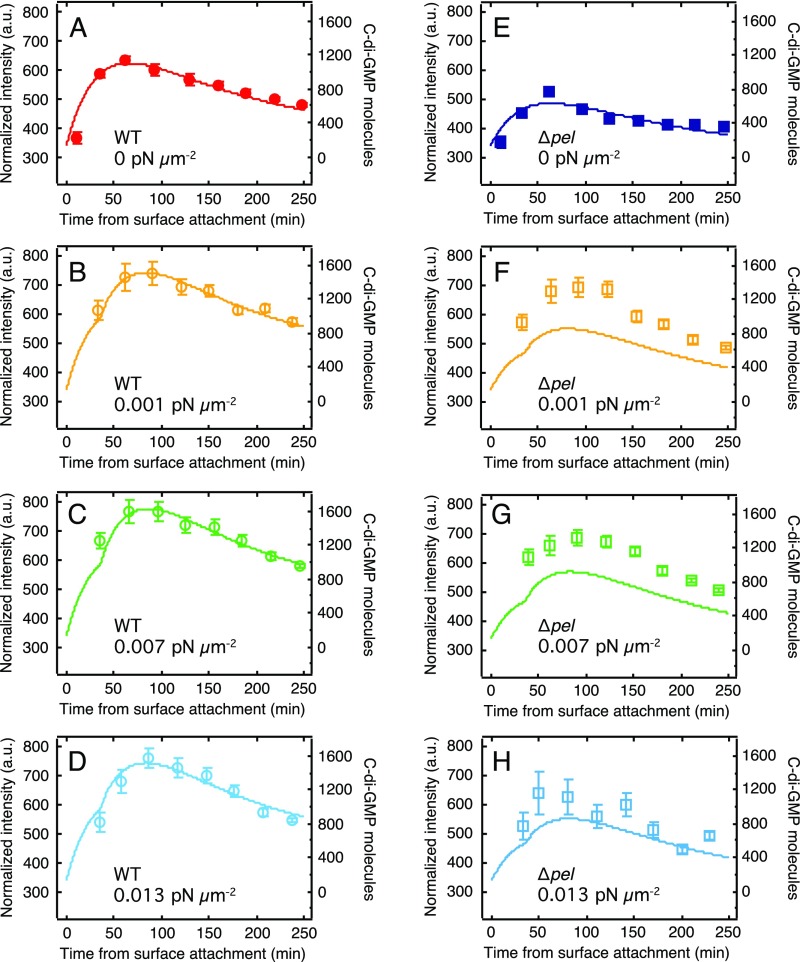
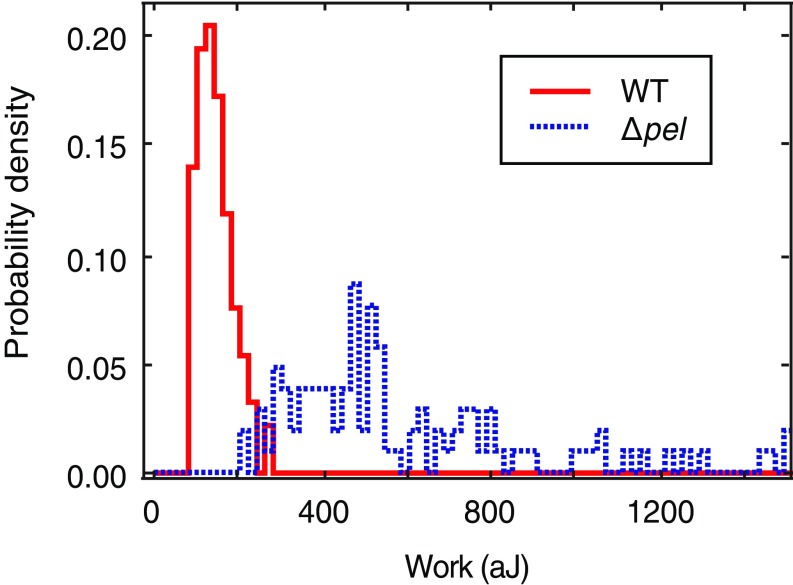
Biofilms are communities of sessile microbes that are phenotypically distinct from their genetically identical, free-swimming counterparts. Biofilms initiate when bacteria attach to a solid surface. Attachment triggers intracellular signaling to change gene expression from the planktonic to the biofilm phenotype. For Pseudomonas aeruginosa, it has long been known that intracellular levels of the signal cyclic-di-GMP increase upon surface adhesion and that this is required to begin biofilm development. However, what cue is sensed to notify bacteria that they are attached to the surface has not been known. Here, we show that mechanical shear acts as a cue for surface adhesion and activates cyclic-di-GMP signaling. The magnitude of the shear force, and thereby the corresponding activation of cyclic-di-GMP signaling, can be adjusted both by varying the strength of the adhesion that binds bacteria to the surface and by varying the rate of fluid flow over surface-bound bacteria. We show that the envelope protein PilY1 and functional type IV pili are required mechanosensory elements. An analytic model that accounts for the feedback between mechanosensors, cyclic-di-GMP signaling, and production of adhesive polysaccharides describes our data well.

Keywords: Pseudomonas aeruginosa; biofilm; cyclic-di-GMP; mechanobiology; mechanosensing.


Conflict of interest statement

The authors declare no conflict of interest.

Figures

Fig. S1.
Fig. S1.
Physical interactions between P. aeruginosa and surfaces. Sources of shear stress on adhered cells include (A) external fluid flow and (B) pili-driven twitching motility. Among surface motile cells, two distinct adhesion geometries emerge, with (C) cells lying flat on the surface have a larger area in contact with the substrate and (D) cells tilted up off of the surface have a smaller area in contact with the substrate.
Fig. S2.
Fig. S2.
AFM measurements of force during retraction from a glass surface for WT and ∆pel. Individual force curves show representative features of each type. The ∆pel curve has a shallower slope near the surface than does the WT.
Fig. 1.
Fig. 1.
Histograms of average fluorescence intensity per cell for WT (A–D) and ∆pel (E–H) populations during 30-min intervals that begin at the times indicated. For each histogram, n ≥ 100 cells from at least five independent experiments. Less than 30 min after surface attachment, WT (A) and ∆pel (E) histograms are indistinguishable (two-sample Kolmogorov–Smirnov test, P = 0.87). After 30 min, both WT and ∆pel populations have broadened toward higher intensities, with the WT showing a larger change. (Insets) Sample confocal micrographs taken during each time window. This time series of micrographs tracks the brightness of one WT bacterium and one Δpel bacterium and their daughter cells. Purple, lower intensity; yellow, higher intensity. (I) P values from comparing WT and ∆pel populations using a two-sample Kolmogorov–Smirnov test. (J) The percentage of cells in each population that have a mean intensity brighter than 550 a.u.
Fig. 2.
Fig. 2.
Pel production and mechanical shear both increase intracellular c-di-GMP levels. (A) Average intensity vs. time for the first 250 min after surface attachment. Both WT and ∆pel (data points, left axis) start at the same level, sharply increase during the first hour, and then decrease. Corresponding curves are from our model (solid lines, right axis). (B) Peak intensity vs. applied shear stress. Each data point is the average of all cells imaged in the interval 30–120 min after surface attachment, corresponding to the peaks in A (gray shaded region). n ≥ 100 cells, from at least two independent experiments. Error bars are SEM.
Fig. 3.
Fig. 3.
Without Pel, cells move more quickly on surfaces. (A) Phase-contrast micrograph of PAO1 ∆pel cells. The cell on the Left is fully in focus, lying flat on the surface. The circled cell on the Right is partially out of focus, tilting up off of the surface. (B) Schematic showing a side view of flat-lying and tilting cells. (C) Average instantaneous speed of WT and ∆pel cells. n ≥ 80,000 data points, from three experiments. ***P < 0.001 from two-sample t test; error bars are SEM. (D) Scatter plot showing the mean speed of cells during an entire trajectory as a function of the fraction of the cell’s tracked lifetime that was spent tilting. Linear fits are shown. Below a lifetime tilting fraction of 0.67, the fits lie outside of the 95% confidence intervals of each other, and ∆pel are faster than WT. Detail for fit lines is shown in Fig. S3.
Fig. S3.
Fig. S3.
Zoomed-in view of the fit lines in Fig. 3D. The 95% confidence intervals do not overlap for tilting fractions lower than 0.68. Linear fits (y = m*x + b) to each dataset yield: for WT, m = 0.1825 ± 0.025, b = 0.2963 ± 0.0068; for ∆pel, m = 0.020 ± 0.034, b = 0.468 ± 0.014.
Fig. S4.
Fig. S4.
Shear flow does not disproportionately remove ∆pel cells from the surface. Cell counts for WT (solid lines) and ∆pel (dashed lines) populations in time. For a given shear stress, WT and ∆pel populations follow the same trend. Initial downturns correspond to an initial decrease of surface cells, with comparable decreases for both WT and ∆pel.
Fig. 4.
Fig. 4.
Shear stress can “restart” c-di-GMP response in surface-sensitive cells. c-di-GMP response for WT PAO1 as a function of time. Cells in static (filled red) and constant shear stress (hollow blue) conditions show a characteristic rise and monotonic decrease in time. Cells in semifilled black circles were grown in static culture for 150 min, after which point a constant shear stress was applied and fluorescence sharply increases. n ≥ 300 cells, from at least three independent experiments. Error bars are SEM. Corresponding curves are from our model (solid and dashed lines, right axis). The c-di-GMP increase is not due to the influx of fresh media, as refreshment of media without a sustained shear stress does not elicit a response (Fig. S5).
Fig. S5.
Fig. S5.
Normalized intensity for WT PAO1 cells under static (filled red circles), step-up (partially filled black circles), spike (green hexagons), and constant-flow (hollow blue circles) conditions. For the spike case, flow was turned on after 150 min and turned back off 10 min later (160 min after surface attachment). These cells do not show a response at this time. This indicates that the secondary increase in fluorescence (c-di-GMP level) from applied shear stress at 150 min (partially filled black circles) is not an artifact of media refreshment.
Fig. S6.
Fig. S6.
Companion plots of PAO1 knockouts for (A) pilY1, (B) pilA, and (C) pilT, showing the lack of a c-di-GMP response to both surface adhesion and shear stress for cells either lacking pili (B) or missing key pilus-associated proteins (A and C).
Fig. S7.
Fig. S7.
c-di-GMP levels increase in response to a range of magnitudes of external shear stress. Curves for WT (A–D) and ∆pel (E–H) knockout strains in response to varying amounts of external shear stress. Data points are experimental results (left axis), and solid curves are from our model (right axis). Model stress levels (α1 parameter) were fitted to the WT data and then applied to the ∆pel model.
Fig. S8.
Fig. S8.
The EPS Pel decreases the work of detachment. Bacteria were attached to the tip of an AFM cantilever, brought into contact with a surface, and then pulled off. Measuring the deflection of the cantilever tip yielded the force of retraction as a function of distance from the surface. Integration of force over distance gives the mechanical work needed to detach the bacterium from the surface.
Fig. S9.
Fig. S9.
Image processing faithfully measures intensity data. Histograms of cell length for WT and ∆pel data. We measure both populations to have identical length distributions with our image-processing techniques. This ensures that brighter cells are not artificially measured to be longer by setting an intensity threshold.

References

    1. Jaalouk DE, Lammerding J. Mechanotransduction gone awry. Nat Rev Mol Cell Biol. 2009;10:63–73. - PMC - PubMed
    1. Iskratsch T, Wolfenson H, Sheetz MP. Appreciating force and shape—the rise of mechanotransduction in cell biology. Nat Rev Mol Cell Biol. 2014;15:825–833. - PMC - PubMed
    1. Persat A, et al. The mechanical world of bacteria. Cell. 2015;161:988–997. - PMC - PubMed
    1. Alsharif G, et al. Host attachment and fluid shear are integrated into a mechanical signal regulating virulence in Escherichia coli O157:H7. Proc Natl Acad Sci USA. 2015;112:5503–5508. - PMC - PubMed
    1. Wolcott R, Dowd S. The role of biofilms: Are we hitting the right target? Plast Reconstr Surg. 2011;127:28S–35S. - PubMed

Publication types

MeSH terms

Substances

LinkOut - more resources