. 2017 Jun 20;114(25):6569-6574.
doi: 10.1073/pnas.1620780114. Epub 2017 May 22.

Solitary bees reduce investment in communication compared with their social relatives

Affiliations

Solitary bees reduce investment in communication compared with their social relatives

Bernadette Wittwer et al. Proc Natl Acad Sci U S A. .

Abstract

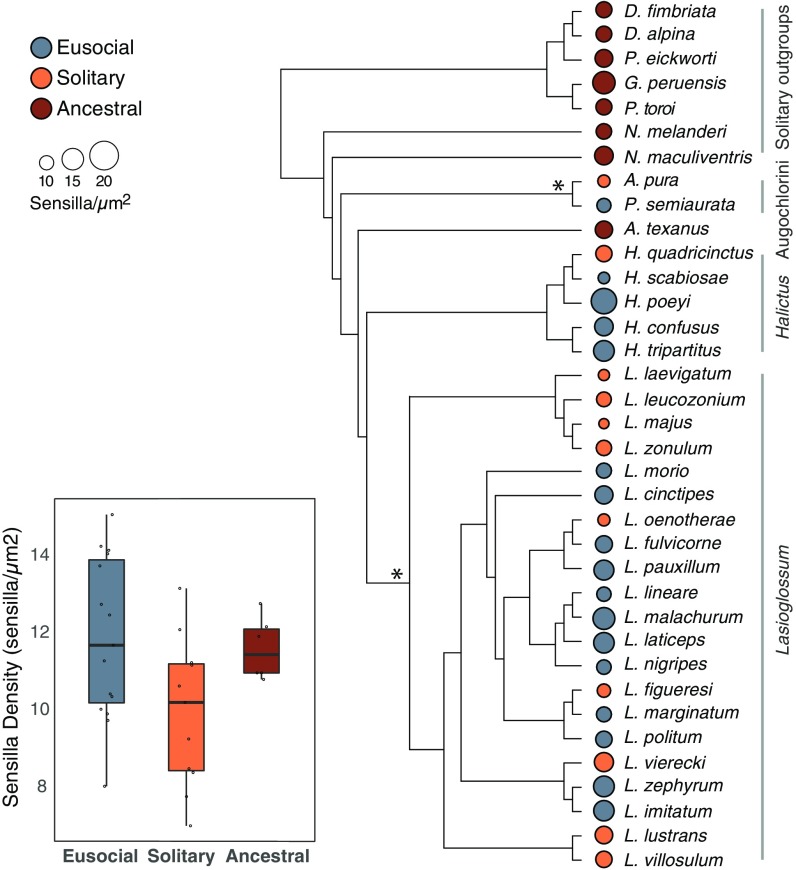
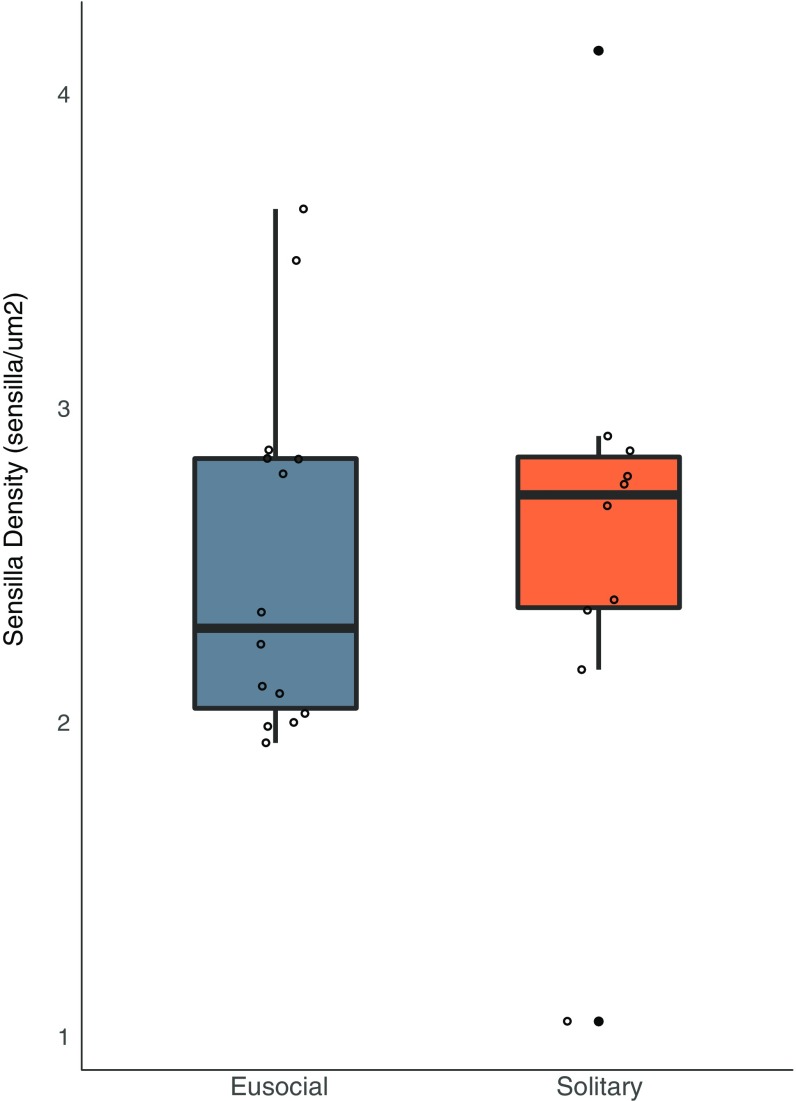
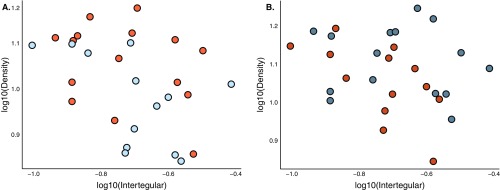
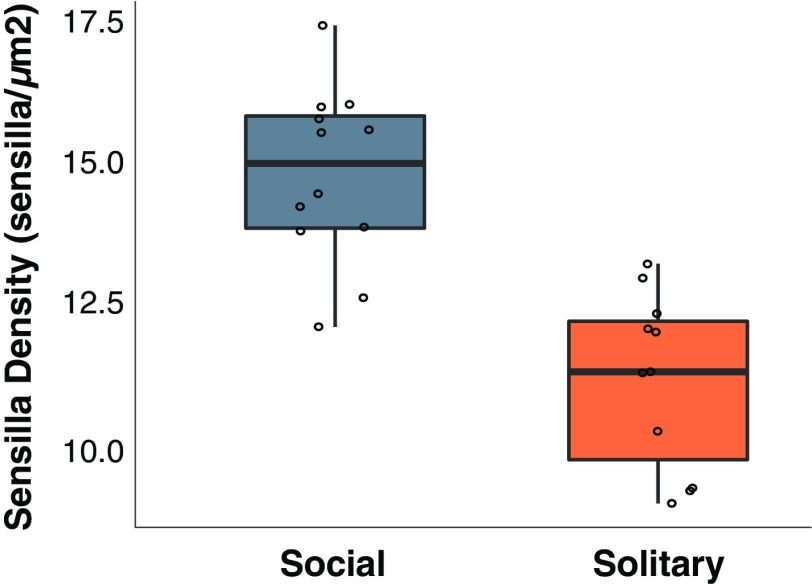
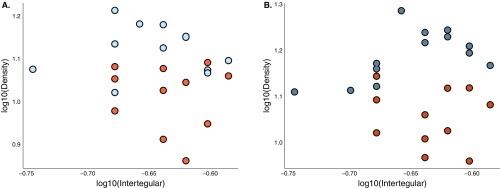
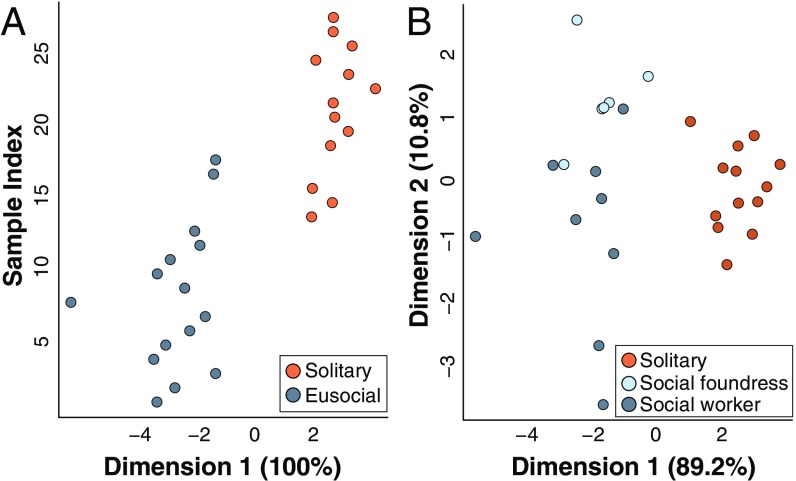
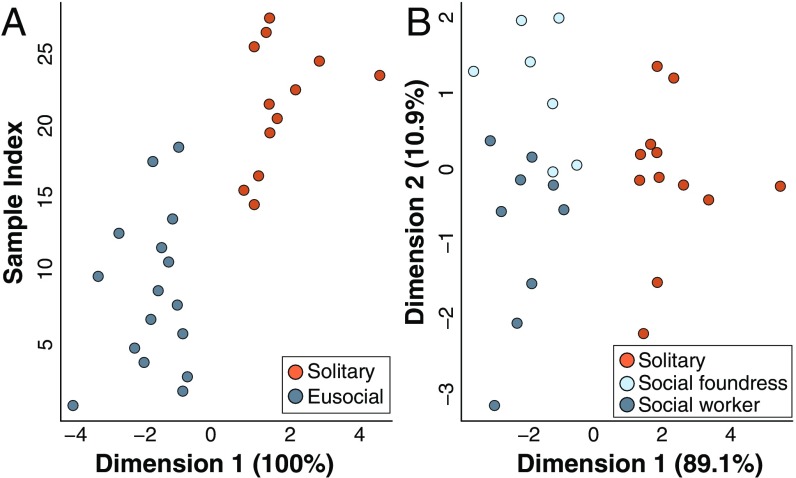
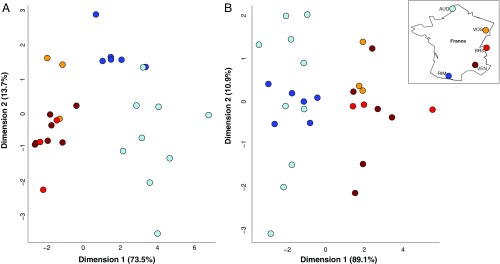
Social animals must communicate to define group membership and coordinate social organization. For social insects, communication is predominantly mediated through chemical signals, and as social complexity increases, so does the requirement for a greater diversity of signals. This relationship is particularly true for advanced eusocial insects, including ants, bees, and wasps, whose chemical communication systems have been well-characterized. However, we know surprisingly little about how these communication systems evolve during the transition between solitary and group living. Here, we demonstrate that the sensory systems associated with signal perception are evolutionarily labile. In particular, we show that differences in signal production and perception are tightly associated with changes in social behavior in halictid bees. Our results suggest that social species require a greater investment in communication than their solitary counterparts and that species that have reverted from eusociality to solitary living have repeatedly reduced investment in these potentially costly sensory perception systems.

Keywords: communication; comparative methods; halictid bees; social behavior.


Conflict of interest statement

The authors declare no conflict of interest.

Figures

Fig. 1.
Fig. 1.
Phylogeny of halictid bees used in this study. Halictids encompass the full range of social behavior, from solitary to eusocial. Social behavior in this group has originated at least twice independently (indicated with asterisks). Solitary species are depicted in orange, social species in blue; and the size of the circle is relative to the mean sensilla density for each species. PGLS analysis revealed a strong trend of correlated evolution in antennal traits, independent of the species’ shared phylogenetic history (R2 = 0.2125), F(2, 33) = 4.45, P = 0.019. This difference is driven primarily by the decrease in sensilla density in secondarily solitary species that have reverted to a solitary life history compared with their eusocial ancestors (P = 0.0096). Ancestrally solitary species have densities intermediate to eusocial and secondarily solitary forms, which is perhaps driven by oligolecty in the ancestral, solitary lineages.
Fig. S1.
Fig. S1.
The density of pore-plate sensilla does not vary with social behavior. There was no correlation between the density of pore-plate sensilla and social behavior: PGLS, R2 = 0.001; F(1, 23) = 0.003, P = 0.956.
Fig. S2.
Fig. S2.
Body size and sensilla density are not correlated across halictid species. (A) There was no correlation between body size (as measured by intertegular distance) on segment 9 (r = 0.36, n = 28, P ≥ 0.05) or (B) segment 10 (r = 0.22, n = 28, P ≥ 0.25) of antennae across halictid species.
Fig. 2.
Fig. 2.
Differential investment in antennal sensilla in social and solitary populations of L. albipes. Boxplot of antennal sensilla density across social and solitary populations of L. albipes. There is a significant difference of mean sensilla density among the two behavioral morphs (F1,21 = 29.9, P = 2.00e-05).
Fig. S3.
Fig. S3.
Body size and sensilla density are not correlated in L. albipes. (A) There was no correlation between body size (as measured by intertegular distance) and sensilla density on segment 9 (r = 0.14, n = 23, P ≥ 0.54) or (B) segment 10 (r = 0.0497, n = 24, P ≥ 0.82) of antennae among social forms of L. albipes. Social forms in blue, solitary in orange.
Fig. 3.
Fig. 3.
L. albipes females have distinguishable cuticular chemical profiles as exhibited both by behavior (solitary versus social) and by caste (workers, social foundresses, and solitary reproductives). (A) The LDA accurately differentiated social vs. solitary forms of L. albipes: dimension 1, 100%; Wilk’s lambda, P = 1.901e−05. Cross-validation was able to correctly classify 100% of the samples. (B) The LDA was able to accurately discriminate individuals by caste (dimension 1, 89.2%; dimension 2, 10.8%; Wilk’s lambda, P = 0.001), and cross-validation correctly classified 93.8% of the samples.
Fig. 4.
Fig. 4.
L. albipes females have distinguishable Dufour’s gland chemical profiles as exhibited both by behavior (solitary versus social) and by caste (workers, social foundresses, and solitary reproductives). (A) The LDA accurately differentiated social vs. solitary forms of L. albipes: canonical 1, 100%; Wilk’s lambda, P = 2.169e-05. Cross-validation was able to correctly classify 100% of the samples. (B) The LDA was able to accurately place individuals by caste (dimension 1, 89.1%; dimension 2, 10.9%; Wilk’s lambda, P = 0.0074), and cross-validation correctly classified samples 96.4% of the time.
Fig. S4.
Fig. S4.
LDA by population. Solitary populations are shades of red, and social populations are shades of blue. All populations are approximately equally geographically and genetically divergent from each other regardless of social behavior, suggesting that the observed chemical differences between social forms cannot be due to population-level variation alone. (A) The LDA was moderately successful at differentiating populations of L. albipes based on cuticular hydrocarbons (dimension 1, 75.8%; dimension 2, 12.8%; Wilk’s lambda, P = 0.024). (B) However, the LDA did not successfully differentiate populations of L. albipes based on Dufour’s glands: dimension 1, 74.9%; dimension 2, 16.0%; Wilk’s lambda, P = 0.082.

Comment in

References

    1. Blum MS. Semiochemical parsimony in the Arthropoda. Annu Rev Entomol. 1996;41:353–374. - PubMed
    1. Smith AA, Millar JG, Suarez AV. A social insect fertility signal is dependent on chemical context. Biol Lett. 2015;11:20140947. - PMC - PubMed
    1. Blum MS, Brand JM. Social insect pheromones: Their chemistry and function. Am Zool. 1972;12:553–576.
    1. Blum M. Pheromonal sociality in the Hymenoptera. In: Birch M, editor. Pheromones. Vol 32. North-Holland; Amsterdam: 1974. pp. 222–249.
    1. Le Conte Y, Hefetz A. Primer pheromones in social hymenoptera. Annu Rev Entomol. 2008;53:523–542. - PubMed

Publication types

LinkOut - more resources