. 2017 Jun 6;114(23):E4648-E4657.
doi: 10.1073/pnas.1704698114. Epub 2017 May 22.

Selective lowering of synapsins induced by oligomeric α-synuclein exacerbates memory deficits

Affiliations

Selective lowering of synapsins induced by oligomeric α-synuclein exacerbates memory deficits

Megan E Larson et al. Proc Natl Acad Sci U S A. .

Abstract

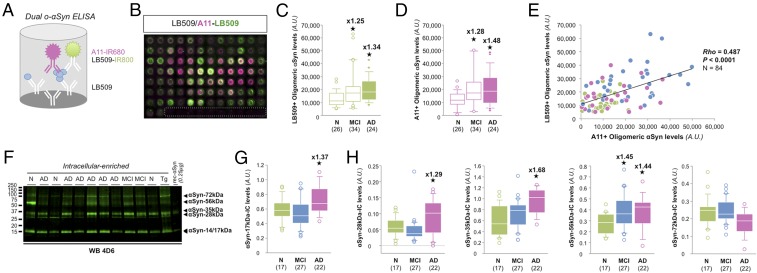
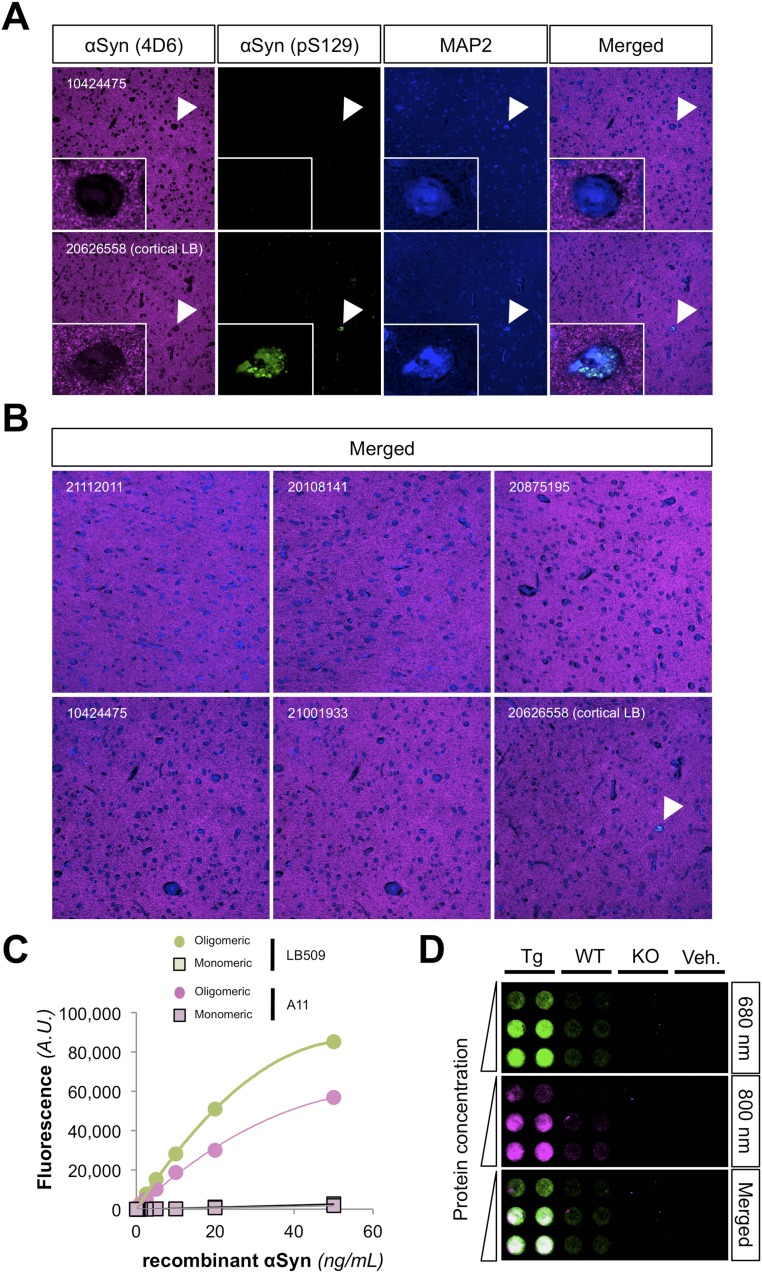
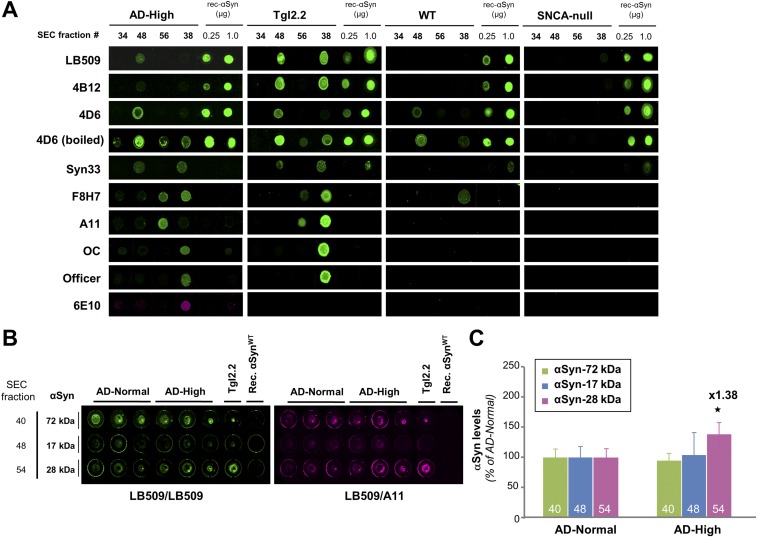
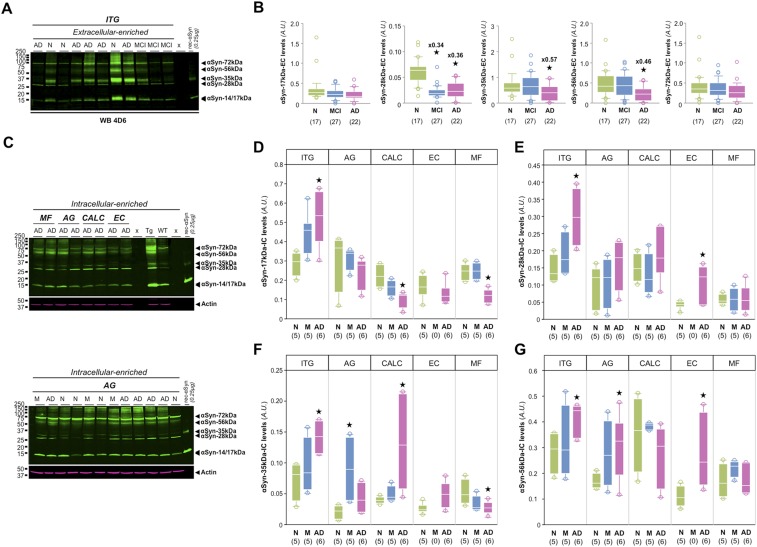
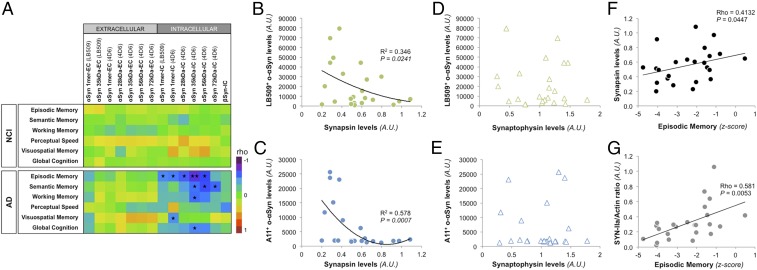
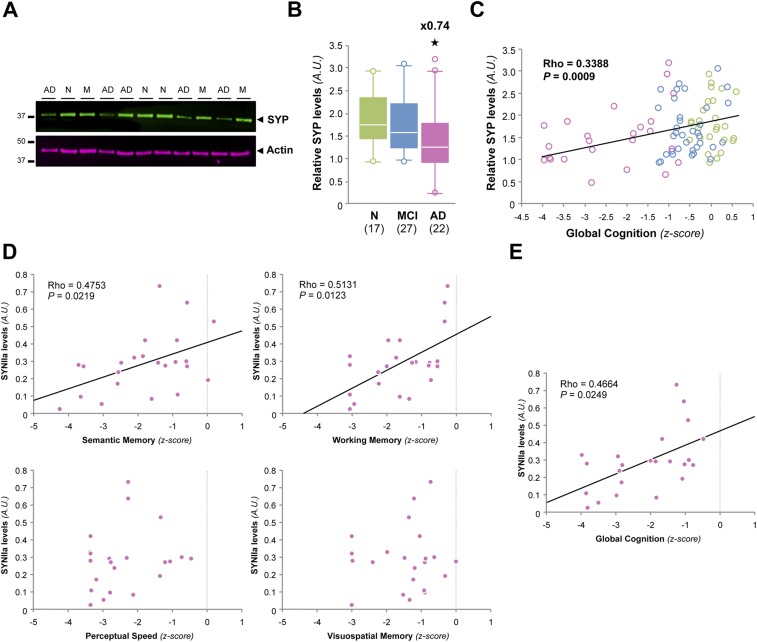
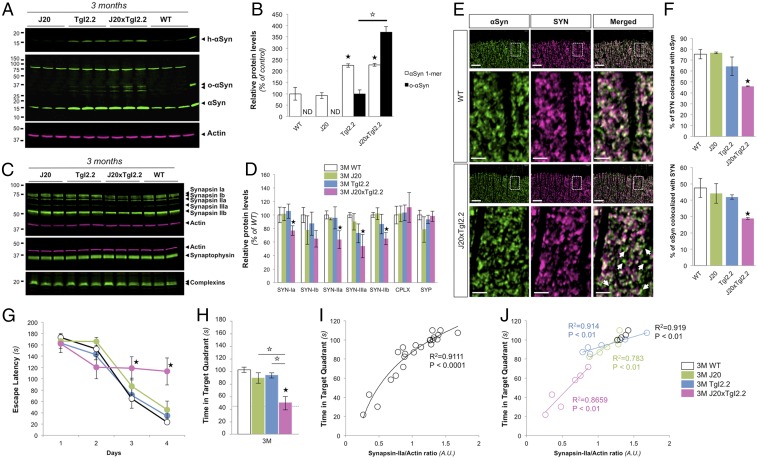
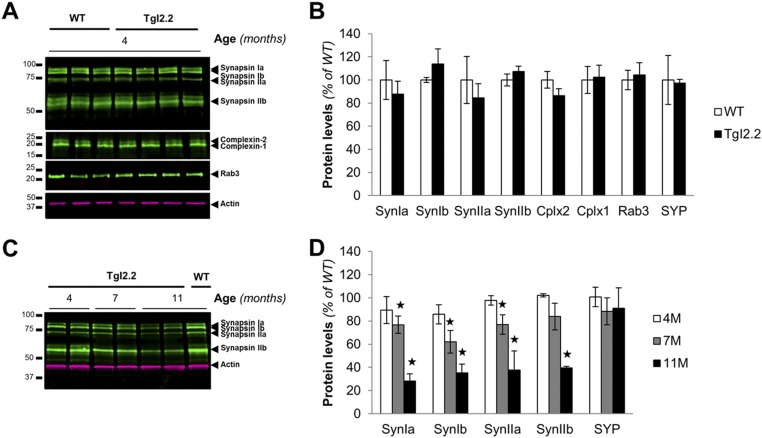
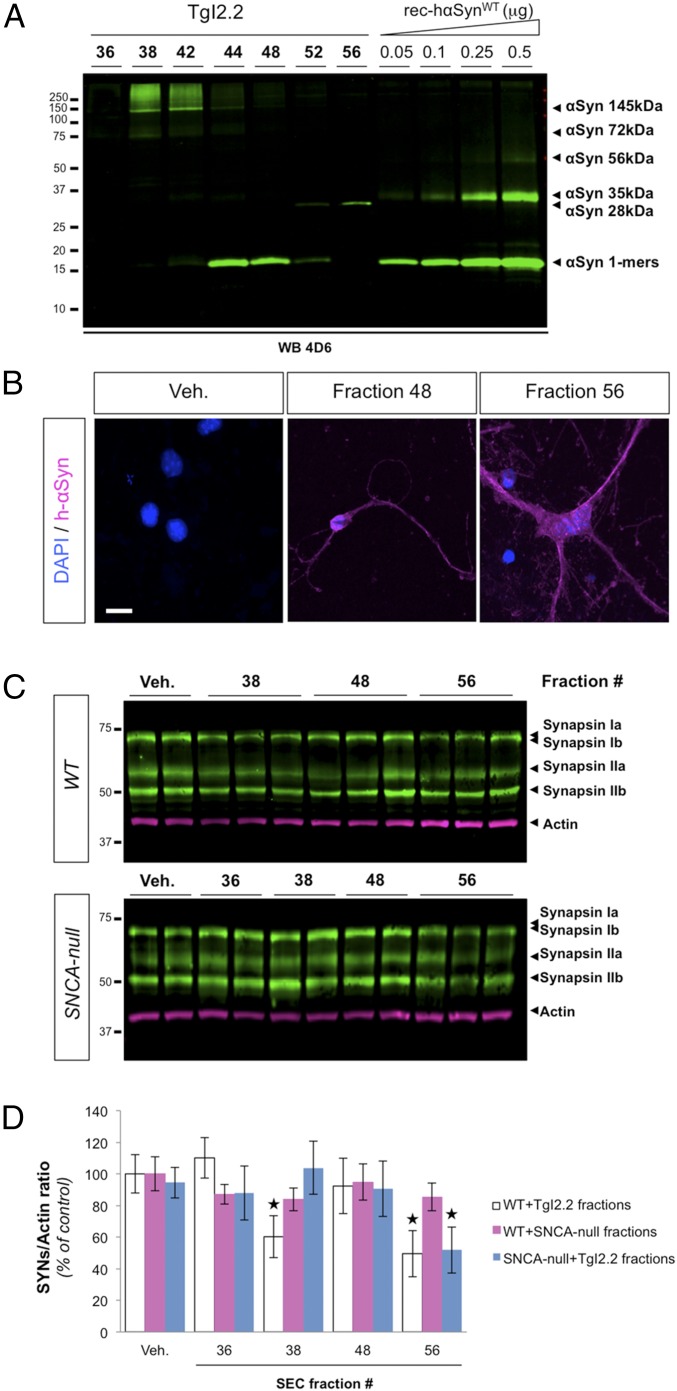
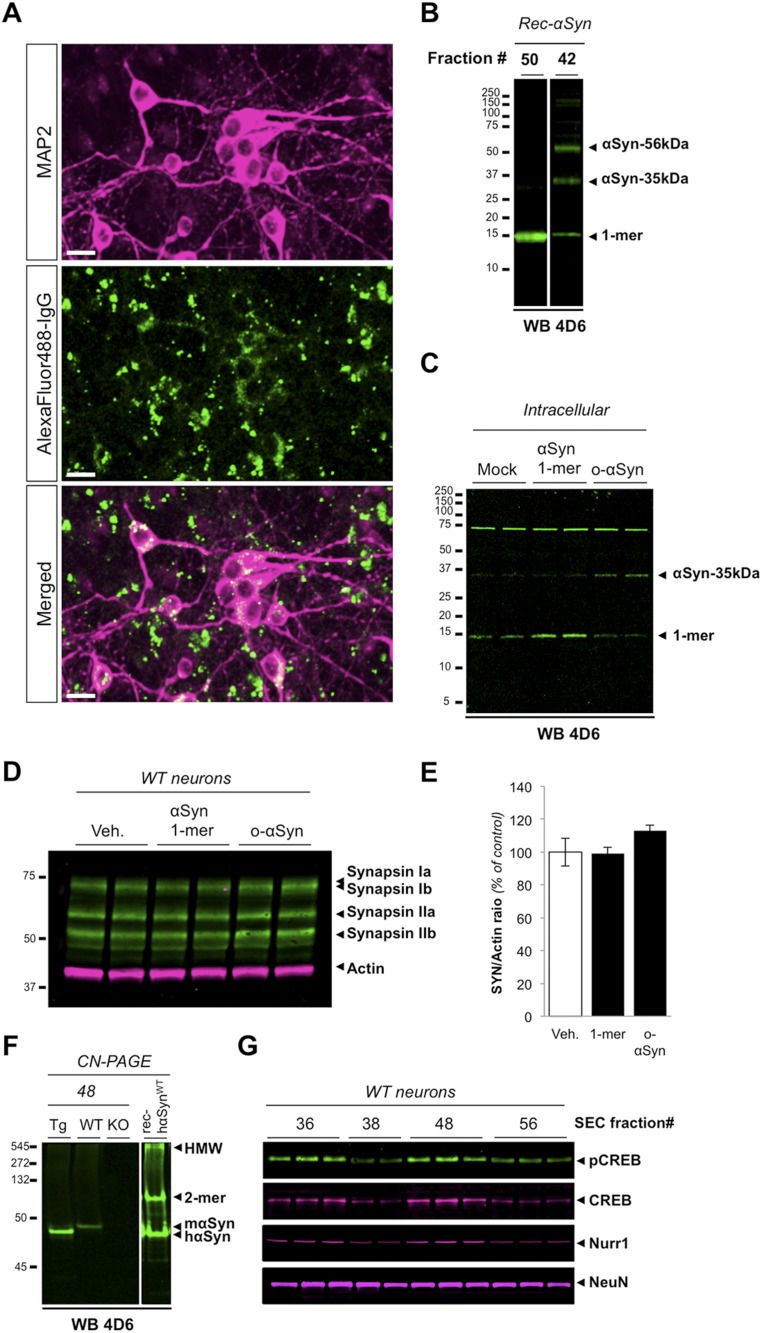
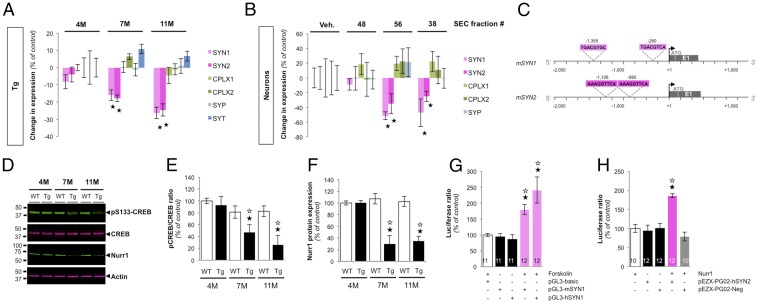
Mounting evidence indicates that soluble oligomeric forms of amyloid proteins linked to neurodegenerative disorders, such as amyloid-β (Aβ), tau, or α-synuclein (αSyn) might be the major deleterious species for neuronal function in these diseases. Here, we found an abnormal accumulation of oligomeric αSyn species in AD brains by custom ELISA, size-exclusion chromatography, and nondenaturing/denaturing immunoblotting techniques. Importantly, the abundance of αSyn oligomers in human brain tissue correlated with cognitive impairment and reductions in synapsin expression. By overexpressing WT human αSyn in an AD mouse model, we artificially enhanced αSyn oligomerization. These bigenic mice displayed exacerbated Aβ-induced cognitive deficits and a selective decrease in synapsins. Following isolation of various soluble αSyn assemblies from transgenic mice, we found that in vitro delivery of exogenous oligomeric αSyn but not monomeric αSyn was causing a lowering in synapsin-I/II protein abundance. For a particular αSyn oligomer, these changes were either dependent or independent on endogenous αSyn expression. Finally, at a molecular level, the expression of synapsin genes SYN1 and SYN2 was down-regulated in vivo and in vitro by αSyn oligomers, which decreased two transcription factors, cAMP response element binding and Nurr1, controlling synapsin gene promoter activity. Overall, our results demonstrate that endogenous αSyn oligomers can impair memory by selectively lowering synapsin expression.

Keywords: Alzheimer’s disease; memory; oligomer; synapsins; α-synuclein.


Conflict of interest statement

The authors declare no conflict of interest.

Figures

Fig. 1.
Fig. 1.
Identification of soluble αSyn assemblies in human brain tissues. (A) Experimental design of oligomeric αSyn ELISA. The capture antibody consisted in the human specific αSyn antibody LB509 and a tandem of detecting antibodies (LB509-IR800 and A11-Biotin) was used to reveal oligomeric αSyn. (B) Representative infrared images of oligomeric αSyn measurements in Religious Orders Study specimens (n = 84) using either LB509-LB509 (homotypic) or LB509-A11 sandwiches on 96-well ELISA plates. Each well represents a separate patient sample. The dashed rectangle indicates increasing amounts of freshly resuspended recombinant monomeric αSyn (last row, samples 86–96, 1 pg to 10 ng). Please note that no signal was detected confirming the specificity of the assay. (C and D) Box plots for oligomeric αSyn species using either the homotypic LB509 sandwich (C) or the LB509-A11 sandwich (D). Obvious differences were observed between the AD group (n = 24) and the NCI (N) group (n = 26). (Mann–Whitney U test, F1, 47 = 4.9728 and F1, 47 = 5.0115, respectively; Student t test, P < 0.05 vs. NCI.) (E) Regression analyses indicated a positive correlation between oligomeric αSyn species detected with either LB509/LB509 (x axis) or with LB509/A11 (y axis) (n = 84; Spearman rank correlation, P < 0.0001). (F) Western blot (WB) analyses of soluble αSyn species in IC-enriched fractions using 4D6. Tg mice from the TgI2.2 line and recombinant human αSynWT were used as positive controls. (G and H) Box plots for monomeric (G) and putative oligomeric (H) αSyn species in the temporal cortex of subjects with NCI, MCI, or AD devoid of αSyn inclusions. Numbers in parentheses indicate group sizes. NCI is shown in green, MCI in blue, and AD in magenta boxes. In box plots of all figures, the bar inside the box indicates the median; the upper and lower limits of boxes represent the 75th and 25th percentiles, respectively. Bars flanking the box represent the 95th and fifth percentiles. (Kruskal–Wallis followed by Mann–Whitney U test, F1, 66 = 4.2289, F1, 66 = 4.4464, F1, 66 = 4.7717, F1, 66 = 3.8853, and F1, 66 = 2.4774 respectively; P < 0.05 vs. NCI.) A.U., arbitrary units.
Fig. S1.
Fig. S1.
Characterization of the human brain tissues and the o-αSyn ELISA used in this study. All tissue specimens used were previously characterized by histological analysis at Rush University. To confirm the initial characterization, 15 Religious Orders Study participants were randomly selected for confocal analysis and 5 are shown here. Numbers correspond to the Religious Orders Study identity number (ROS ID). (A and B) Representative confocal images of temporal neurons immunostained for total αSyn (4D6, magenta), pS129-αSyn (pS129, green), and the microtubule-associated protein-2 (MAP2; blue channel) confirmed the absence of LB inclusions in the ITG used in our study. Brain tissues previously characterized as displaying cortical LBs were used as positive controls. (n = 3 sections per case; n = 15). Arrowheads indicate neurons with αSyn aggregates. (Magnification: 20×; Insets, 60×.) (C) Comparative detection of αSyn monomers and oligomers using the homotypic o-αSyn ELISA. Each point corresponds to the average of three independent measurements using the 680- and 800-nm channels on a Li-Cor Odyssey platform. There was no apparent cross-reactivity with freshly resuspended αSyn monomers (up to 50 ng/mL). (D) Representative infrared images of oligomeric αSyn measurements in 11-mo-old WT, TgI2.2, and SNCA-null forebrain lysates using either LB509-LB509 (homotypic; 680 nm) or LB509-A11 (800 nm) sandwiches on 96-well ELISA plates. Each horizontal lane corresponds to increasing protein loads (0.1, 1, and 10 μg). A.U., arbitrary units.; Veh., vehicle.
Fig. S2.
Fig. S2.
Identification of soluble αSyn assemblies present in human brain tissues. (A) Western blot (WB) profile of soluble αSyn molecules detected in SEC fractions from brain tissue of subjects with normal (Upper) or high (Lower) levels of soluble αSyn. Blue arrows indicate the elution of used globular standards. Samples of interest were separated onto two separate 12-well gels in parallel. (B) Averaged signal intensity for the indicated apparent αSyn assembly detected in each SEC fraction obtained from both subgroups (the solid line represents the mean and shaded areas correspond to SDs). Abnormal elevations were detected for putative αSyn dimers (28 kDa) and monomers (17 kDa) in the brain tissues of AD-high subjects (Kruskal–Wallis followed by Mann–Whitney U test, P < 0.05, n = 3 per SEC fraction; n = 5 per group). A.U., arbitrary units.
Fig. S3.
Fig. S3.
SEC profiles of recombinant human αSyn monomers and of soluble αSyn assemblies present in TgI2.2, WT, and SCNA-null forebrain tissues. (A) Representative Western blot (WB) profile of recombinant human αSyn monomers detected in SEC fractions. Blue arrows indicate the elution of used globular standards. The Left Inset corresponds the nonsegregated material. Samples of interest were separated onto two separate 12-well gels in parallel. (B–D) Representative Western blot profile of soluble αSyn molecules detected in SEC fractions from forebrain tissue of 11-mo-old TgI2.2 (B), WT (C), and SNCA-null (D) mice. Of total proteins from the IC-enriched fraction, 250 μg was injected. The Left Inset in B corresponds with the nonsegregated material. Samples of interest were separated onto two separate 12-well gels in parallel.
Fig. S4.
Fig. S4.
Nondenaturing analyses of soluble αSyn species isolated by liquid-phase chromatography. SEC fractions containing segregated soluble αSyn species isolated from brain tissues of AD subjects with high levels of αSyn (AD-high), or from mouse brain tissues (TgI2.2, WT, and SNCA-null mice) were analyzed under native conditions. (A) Dot blot analysis of SEC-isolated soluble αSyn molecules in AD-high specimen, 11-mo-old TgI2.2, WT, and SNCA-null mice (n = 3–6 per group per antibody) using commercially available antibodies against human αSyn (LB509 and 4B12), mouse/human αSyn (4D6), oligomeric αSyn (Syn33, F8H7), and aggregated amyloid proteins (A11, OC, and Officer). Finally, 6E10, a monoclonal antibody raised against human Aβ1–16 was used as an internal control. (B) ELISA analysis of SEC-isolated soluble αSyn molecules in AD specimens, 11-mo-old TgI2.2 mice and recombinant human αSyn monomers (n = 3–6 per group). (C) Relative fluorescence intensity corresponding to αSyn levels in SEC fraction tested. (Histograms represent the mean ± SD; Student t test, P < 0.05, n = 6 per group.)
Fig. S5.
Fig. S5.
Histochemical and biochemical characterization αSyn species detected in TgI2.2 mice. (A) Representative confocal images for MAP2 (blue) and αSyn (green) illustrating the cellular localization of αSyn in the hippocampi (CA1) of 7-mo-old WT and TgI2.2 littermates. Note the absence of apparent αSyn inclusions in transgenic animals. (Scale bars: 20 μm.) (B) Western blot (WB) analyses of IC fractions of 4-, 7-, and 11-mo-old WT, TgI2.2, and SNCA-null mice (KO) with 4D6 revealed the detection of putative αSyn assemblies of 28, 35, 56, and 72 kDa. Please note the absence of signal of αSyn in KO animals; only a faint nonspecific band was detected at ∼70 kDa. (C and D) Densitometry analyses revealed selective elevations in apparent αSyn oligomers (C) and monomers (D). (Histograms represent the mean ± SD; Student t test with Bonferroni correction, P < 0.05 vs. 4-mo-old mice, P < 0.05 vs. 7-mo-old mice, n = 6 animals per genotype.) (E) Solvent-induced disassembly of putative brain αSyn oligomers. Representative Western blot analysis of TgI2.2 brain lysates subjected to increasing amounts of HFIP and revealed with 4D6. (F) Apparent soluble αSyn oligomers disassembled in >20% HFIP, with concomitant enrichment of monomeric αSyn (lower exposure provided in the Lower Inset of E for enhanced contrast). The data for fold-change in αSyn species corresponds to the mean ± SD. (ANOVA followed by Student t test with Bonferroni correction, P < 0.05 vs. 0% HFIP, P < 0.05 vs. 20% HFIP, n = 3–4 per condition.) M, months.
Fig. S6.
Fig. S6.
Relative expression of soluble αSyn species detected in EC-enriched ITG lysates and in IC-enriched lysates from additional brain regions. (A) Western blot (WB) analyses of soluble αSyn species in EC-enriched fractions using 4D6. Transgenic mice from the TgI2.2 line were used as positive controls. (B) Quantification of monomeric and oligomeric αSyn species in the inferior temporal cortex of subjects with NCI (N), MCI (M), or AD. Numbers in parentheses indicate group sizes. NCI is shown in green, MCI in blue, and AD in magenta boxes. (C) Western blot analyses of soluble αSyn species in IC-enriched fractions from MF, AG, CALC, and enthorinal (EC) cortices using 4D6. Transgenic TgI2.2 and WT mice were used as positive and negative controls, respectively. (D–G) Comparative analysis of monomeric and oligomeric αSyn species detected in ITG, AG, CALC, enthorinal, and MF cortices of subjects with NCI, MCI, or AD. Italicized numbers in parentheses indicate group sizes. NCI is shown in green, MCI in blue, and AD in magenta boxes. In box plots of all figures, the bar inside the box indicates the median; the upper and lower limits of boxes represent the 75th and 25th percentiles, respectively. Bars flanking the box represent the 95th and fifth percentiles. (Kruskal–Wallis followed by Mann–Whitney U test, P < 0.05 vs. NCI.) A.U., arbitrary units.
Fig. 2.
Fig. 2.
Soluble αSyn assemblies are associated with changes in cognitive function and synaptic expression in AD. (A) Following the measurements of soluble αSyn species in EC- and IC-enriched fractions of human temporal cortices, multivariate analysis was performed within the NCI and AD groups. Monomeric αSyn expression was used as positive control (18) and βSyn expression was used as negative control. Finally, all measures of proteins were performed using the same technique (SDS/PAGE followed by Western blot) to avoid inherent differences between techniques. Raw measurements of all proteins were used for the analysis. (Spearman’s ρ correlation with Bonferroni correction, P < 0.05; ★★P < 0.01, nNCI = 26 and nAD = 24). (B and C) Regression analyses between total synapsin protein expression and o-αSyn measured by ELISA using either LB509 (B) or A11 (C) as the detecting antibody in all AD cases tested (n = 24). Best-fitting models indicated significant negative correlations for both o-αSyn measurements (Spearman’s ρ, ρ = −0.346, P = 0.0241 and ρ = −0.551, P = 0.0052 respectively, n = 24). (D and E) Regression analyses between SYP protein expression and o-αSyn measured by ELISA using either LB509 (D) or A11 (E) as the detecting antibody revealed no correlations between o-αSyn and SYP (Spearman’s ρ, ρ = −0.1745, P = 0.4248 and ρ = −0.1470, P = 0.4932 respectively, n = 24). (F and G) Regression analyses revealed positive correlations between synapsin levels, total (F) or isoform specific (G), and episodic memory performance in our AD cohort (Spearman’s ρ, ρ = 0.4132, P = 0.0447 and ρ = 0.581, P = 0.0053 respectively, n = 24). A.U., arbitrary units.
Fig. S7.
Fig. S7.
Relationships between SYP, synapsin-IIa expression, and antemortem cognitive performance. (A) Western blot (WB) analyses of human SYP in the inferior temporal gyrus using membrane-associated (MB) extracts. Actin was used as internal loading control. (B) Quantification of the relative protein levels for SYP revealed a decrease in SYP abundance in AD vs. NCI (N) (Kruskal–Wallis followed by Mann–Whitney U test, P < 0.05 vs. NCI). (C) Regression analysis between SYP expression and the global cognition composite index (Spearman’s ρ, ρ = 0.3388, P = 0.0009, n = 85). (D and E) Regression analyses between SYNIIa expression in the ITG and performance in various memory modalities, including semantic memory, working memory, perceptual speed, visuospatial memory, and global cognition. (Spearman’s ρ, n = 24.) A.U., arbitrary units; M, MCI.
Fig. 3.
Fig. 3.
Genetic elevation of oligomeric αSyn in the J20 mouse model of Alzheimer’s disease is associated with a selective reduction in synapsin expression and exacerbated cognitive deficits. Three-month-old non-Tg WT, J20, TgI2.2, and J20×TgI2.2 mice were analyzed in the BCM. Immediately following behavioral testing, mice were killed for gene and protein analyses. (A) Representative Western blot images for transgene-derived human αSyn and total αSyn (mouse and human) using forebrain IC lysates. Actin was used as internal control. (B) Quantification of αSyn species revealed a significant elevation of putative o-αSyn in J20×TgI2.2 mice at 3 mo (ANOVA followed by Student t test with Bonferroni correction, F3, 24 = 754.193, P < 0.05 vs. WT, P < 0.05 vs. TgI2.2, n = 6 per age per genotype). (C) Representative Western blot images for synapsins and SYP using forebrain MB lysates. Actin was used as internal control. (D) Densitometry analyses confirmed the apparent visual reduction in synapsins in bigenic J20×TgI2.2 mice compared with other mouse groups (ANOVA followed by Student t test with Bonferroni correction, P < 0.05 vs. WT, n = 6 per age per genotype). (E) Double labeling for αSyn (green) and synapsins (magenta) in 6-μm-thick sections of the CA1 domain of the hippocampus from 3-mo-old WT and J20×TgI2.2 mice. (Scale bars: 20 μm, Upper; 4 μm, Lower.) (F) Quantification of the colocalization between αSyn/SYN in the stratum radiatum of WT, J20, TgI2.2, and J20×TgI2.2 mice using Bitplane’s Imaris7.x colocalization tool. Z-stacks of images were transformed for volume rendering and voxel count analysis was performed. (Histogram values represent mean ± SD, ANOVA followed by Student t test with Bonferroni correction, F3, 48 = 167.576 and, F3, 48 = 64.229, P < 0.05 vs. WT, n = 6 animals, 8 fields per mouse.) (G) Three-month-old non-Tg C57BL/6, J20, TgI2.2, and J20×TgI2.2 mice were trained in the BCM for 4 d. A probe trial (escape platform removed) was conducted 24 h after the last training session. During acquisition of the task, escape latency to complete the task was recorded. Although J20 and TgI2.2 groups learned this task comparably to WT mice, J20×TgI2.2 bigenic mice displayed a severe acquisition deficit. In these mice, two-way repeated-measures ANOVA (RMANOVA) revealed an effect of transgene (F = 36.89, P = 0.0008) but no significant effect of training (F = 8.02, P = 0.8236). Although different from WT animals, J20×TgI2.2 mice were partly able to learn the task (P < 0.05 vs. WT mice). (H) During the probe trial, J20×TgI2.2 animals did not elicit a spatial search bias compared with WT and single Tg littermates. Bigenic J20×TgI2.2 mice consistently performed worse than age-matched single Tg J20 and TgI2.2 animals (two-way ANOVA, P < 0.05 vs. WT mice; P < 0.05 vs. J20×TgI2.2 mice). Data represent mean ± SEM (n = 6–8 males per age per genotype). (I) Relationship between probe trial performance and relative synapsin-IIa expression in all animals tested. The best fit is represented on the dot plot (R2 = 0.9111, P < 0.0001, n = 24). (J) Regression analyses between probe trial performance and relative synapsin-IIa expression by genotype of tested animals revealed linear relationships within each group, including bigenic J20×TgI2.2 mice (R2 = 0.8659, P < 0.01, n = 6 animals). A.U., arbitrary units.
Fig. S8.
Fig. S8.
Age-dependent expression of synapsins in TgI2.2 mice. (A) Representative Western blot analyses of synapsins, complexins, Rab3 in MB fractions of 4-mo-old WT and TgI2.2 mice. Actin was used as internal loading control. (B) Quantification of the relative expression levels of synapsins, complexin isoforms, Rab3, and SYP in the forebrain of young WT and TgI2.2 animals. (ANOVA followed by Student t test with Bonferroni correction, n = 5–6 animals per group.) (C) Representative Western blot (WB) analyses of synapsin-I/II isoforms in MB fractions of TgI2.2 mice at 4, 7, and 11 mo of age. Actin was used as internal loading control. (D) Quantification of the relative expression levels of synapsin isoforms with aging in the forebrain of TgI2.2 animals (ANOVA followed by Student t test with Bonferroni correction, P < 0.05 vs. WT, n = 4–6 animals per group). M, months.
Fig. S9.
Fig. S9.
Relative forebrain expression of APP, Aβ, αSyn, and synapsins in 3-mo-old mice used in the study. (A) Western blot (WB) analyses of human APP and total Aβ in forebrains of young WT, J20, TgI2.2, and J20×TgI2.2 mice using 6E10. Actin was used as internal loading control. (B) Quantification of the relative protein levels for APP and Aβ. (Histograms represent the mean ± SD; Student t test with Bonferroni correction, P < 0.05 vs. J20, n = 6 group per genotype.) (C) Representative confocal images of CA1 hippocampal neurons immunostained for the MAP2 (blue channel), αSyn (4D6; green), and synapsins (magenta) revealed no aberrant formation of LB inclusions in 3-mo-old TgI2.2 and J20×TgI2.2 mice. A subtle global reduction in the signal for SYN could also be noticed (n = 6 sections per animals; n = 3–6 animals per genotype). (Scale bars: 20 μm.) M, months.
Fig. 4.
Fig. 4.
Intraneuronal delivery of oligomeric αSyn lowers synapsin expression in primary cortical neurons. (A) Representative Western blot image illustrating the detection of αSyn species following SEC separation of IC forebrain lysates of 9-mo-old TgI2.2 animals. Increasing amounts of recombinant human αSynWT was used as internal standard. (B) Immunofluorescent labeling of exogenous human αSyn (magenta) delivered intracellularly into cultured primary neurons 6 h postproteotransfection. Nuclei were labeled with DAPI (blue). (Scale bar: 10 μm.) (C) Representative Western blot analyses of synapsin isoforms in primary WT (Upper) and SNCA-null (Lower) cortical neurons exposed to SEC fractions containing oligomeric (#38 and #56) or monomeric (#48) αSyn derived from TgI2.2 mice for 6 h. Actin was used as internal standard. (D) Densitometry analyses revealed apparent reduction in synapsins in cells treated with oligomeric αSyn but not with monomeric αSyn. (Histogram values represent mean ± SD, ANOVA followed by Student t test with Bonferroni correction, F4, 50 = 24.930, F4, 50 = 0.819, and F4, 50 = 26.742 for WT cells + TgI2.2 fractions, WT cells + SNCA-null fractions and SNCA-null cells + TgI2.2 fractions respectively; P < 0.05 vs. WT, n = 6 animals per group per genotype.) Veh., vehicle.
Fig. S10.
Fig. S10.
Protein expression of synapsins, CREB, and Nurr1 in mouse primary cortical neurons following IC delivery of recombinant h-αSynWT species. (A) IC delivery of exogenous fluorophore-conjugated antibodies using Chariot in primary cortical neurons 60 min postapplication. Neurons were labeled with MAP2 (magenta). (Scale bars: 10 μm.) (B) Representative Western blot (WB) images for αSyn in selected fractions following SEC segregation of recombinant monomers and multimers. Fraction #50 was enriched in monomers, whereas #42 was enriched in αSyn multimers. (C) Representative Western blot images for αSyn using lysates of cells subjected to IC delivery of fractions #50 and #42 (250 nM, monomer equivalent). (D) Representative Western blot analysis of synapsin expression in primary neurons 6 h after intraneuronal delivery of recombinant monomers or oligomers isolated by SEC. Actin was used as internal loading control. (E) Quantification of the relative expression levels of synapsins following intraneuronal delivery of recombinant h-αSynWT species. (ANOVA followed by Student t test with Bonferroni correction, n = 4–6 dishes per group.) (F) Western blot analysis with 4D6 antibodies following Clear Native (CN)-PAGE segregation of SEC fraction #48 using IC lysates from TgI2.2, WT, or SNCA-null (KO) mice. Oligomeric recombinant h-αSynWT (0.25 μg) was used as control. (G) Representative Western blot images documenting the protein abundance for pS133-CREB, total CREB, Nurr1, and the neuronal nuclear protein NeuN in membrane lysates from primary neurons treated with αSyn species delivered with Chariot. Please note the selective reductions in phosphorylated (p)CREB and Nurr1, whereas NeuN amounts remain unchanged. Veh., vehicle.
Fig. 5.
Fig. 5.
αSyn oligomers down-regulate SYN1 and SYN2 gene expression through CREB and Nurr1. (A) Age-dependent changes of SYN1, SYN2, CPLX1, CPLX2, SYP, and SYT1 gene expression by rt-qPCR analysis in the forebrain of TgI2.2 mice. Two-way ANOVA revealed a significant effect of transgene (F = 37.18, P < 0.0001), of age (F = 21.09, P < 0.0001), and transgene × age interaction (F = 4.92, P = 0.033) for SYN1 mRNA. The same analysis revealed a significant effect of transgene (F = 36.61, P < 0.0001), of age (F = 18.37, P < 0.0001), and transgene × age interaction (F = 4.37, P = 0.041) for SYN2 mRNA. (Histogram values represent mean ± SD, ANOVA followed by Student t test with Bonferroni correction, F3, 35 = 20.026 and F3, 35 = 18.99 for SYN1 and SYN2, respectively; P < 0.05 vs. WT, n = 6–10 animals per age.) (B) Changes of SYN1, SYN2, CPLX1, CPLX2, SYP, and SYT1 gene expression by rt-qPCR analysis in primary cortical neurons following Chariot-mediated delivery of with isolated αSyn species. (Histogram values represent mean ± SD, ANOVA followed by Student t test with Bonferroni correction, F3, 24 = 9.173, P = 0.0004 and F3, 24 = 6.407, P = 0.0013 for SYN1 and SYN2, respectively; P < 0.05 vs. WT, n = 6 dishes per treatment.) (C) Predicted response elements for CREB (light pink) and Nurr1 (dark pink) within mouse SYN1 and SYN2 genes. (D) Representative Western blot images illustrating the abundance of pS133-CREB, total CREB, Nurr1, and actin in forebrain lysates of 4-, 7-, and 11-mo-old WT and TgI2.2 mice. (E and F) Densitometry analyses revealed age-dependent reductions in the phosphorylated (p)CREB/CREB ratio (E) and in Nurr1 (F) protein amounts. Two-way ANOVA revealed a significant effect of transgene (F = 168.67, P < 0.0001), of age (F = 129.39, P < 0.0001), and transgene × age interaction (F = 72.74, P < 0.0001) for the pCREB/CREB ratio. The same analysis revealed a significant effect of transgene (F = 91.34, P < 0.0001), of age (F = 22.09, P < 0.0001), and transgene × age interaction (F = 29.93, P < 0.0001) for Nurr1. (Histogram values represent mean ± SD, two-way ANOVA followed by Student t test with Bonferroni correction, F3, 30 = 130.886 and F3, 30 = 49.870 for pCREB/CREB and Nurr1, respectively; P < 0.05 vs. WT, P < 0.05 vs. 4-mo-old TgI2.2 mice, n = 5–6 animals per group per genotype.) (G and H) Dual luciferase gene promoter reporter assay revealed that the activity of mouse and human SYN1 (G) and SYN2 (H) promoters is positively modulated by CREB and Nurr1, respectively. Treating cells with 10 µM forskolin activated CREB as assessed by phosphorylation at S133 and nuclear translocation. (Histogram values represent mean ± SD, ANOVA followed by Student t test with Bonferroni correction, F5, 57 = 120.67 and F5, 56 = 112.48 for SYN1 and SYN2 promoters, respectively; P < 0.05 vs. empty vector, P < 0.05 vs. stimulated cells, n = 10–12 dishes per group.) M, months; Veh., vehicle.

References

    1. Lasagna-Reeves CA, et al. Tau oligomers impair memory and induce synaptic and mitochondrial dysfunction in wild-type mice. Mol Neurodegener. 2011;6:39. - PMC - PubMed
    1. Larson ME, Lesné SE. Soluble Aβ oligomer production and toxicity. J Neurochem. 2012;120:125–139. - PMC - PubMed
    1. Lashuel HA, Overk CR, Oueslati A, Masliah E. The many faces of α-synuclein: From structure and toxicity to therapeutic target. Nat Rev Neurosci. 2013;14:38–48. - PMC - PubMed
    1. Bendor JT, Logan TP, Edwards RH. The function of α-synuclein. Neuron. 2013;79:1044–1066. - PMC - PubMed
    1. Diao J, et al. Native α-synuclein induces clustering of synaptic-vesicle mimics via binding to phospholipids and synaptobrevin-2/VAMP2. eLife. 2013;2:e00592. - PMC - PubMed

Publication types

MeSH terms