. 2017 May 8:8:99.
doi: 10.3389/fendo.2017.00099. eCollection 2017.

Leptin Induces Mitosis and Activates the Canonical Wnt/β-Catenin Signaling Pathway in Neurogenic Regions of Xenopus Tadpole Brain

Affiliations

Leptin Induces Mitosis and Activates the Canonical Wnt/β-Catenin Signaling Pathway in Neurogenic Regions of Xenopus Tadpole Brain

Melissa Cui Bender et al. Front Endocrinol (Lausanne). .

Abstract

In addition to its well-known role as an adipostat in adult mammals, leptin has diverse physiological and developmental actions in vertebrates. Leptin has been shown to promote development of hypothalamic circuits and to induce mitosis in different brain areas of mammals. We investigated the ontogeny of leptin mRNA, leptin actions on cell proliferation in the brain, and gene expression in the preoptic area/hypothalamus of tadpoles of Xenopus laevis. The level of leptin mRNA was low in premetamorphic tadpoles, but increased strongly at the beginning of metamorphosis and peaked at metamorphic climax. This increase in leptin mRNA at the onset of metamorphosis correlated with increased cell proliferation in the neurogenic zones of tadpole brain. We found that intracerebroventricular (i.c.v.) injection of recombinant Xenopus leptin (rxLeptin) in premetamorphic tadpoles strongly increased cell proliferation in neurogenic zones throughout the tadpole brain. We conducted gene expression profiling of genes induced at 2 h following i.c.v. injection of rxLeptin. This analysis identified 2,322 genes induced and 1,493 genes repressed by rxLeptin. The most enriched Kyoto Encyclopedia of Genes and Genomes term was the canonical Wnt/β-catenin pathway. Using electroporation-mediated gene transfer into tadpole brain of a reporter vector responsive to the canonical Wnt/β-catenin signaling pathway, we found that i.c.v. rxLeptin injection activated Wnt/β-catenin-dependent transcriptional activity. Our findings show that leptin acts on the premetamorphic tadpole brain to induce cell proliferation, possibly acting via the Wnt/β-catenin signaling pathway.

Keywords: Wnt/β-catenin; Xenopus; leptin; metamorphosis; neurogenesis.


Figures

Figure 1
Figure 1
Transcription of the lep gene is activated during tadpole metamorphosis. (A) Whole body lep mRNA increases during tadpole metamorphosis. (B) Developmental changes in lep mRNA in four tadpole tissues during metamorphosis. We analyzed lep mRNA by reverse transcriptase quantitative real-time PCR. Note that the scales of the graphs in panel (B) are not directly comparable to the graph in panel (A) since the samples were analyzed in separate assays using a relative quantification method (see Materials and Methods). Means with the same letter are not significantly different [p < 0.05; Fisher’s least squares difference test; n = 5–6/Nieuwkoop–Faber (NF) stage].
Figure 2
Figure 2
Leptin induces mitosis in premetamorphic tadpole brain. (A) Changes in cell proliferation in tadpole brain throughout metamorphosis analyzed by BrdU incorporation [data are modified from Denver et al. (30); reproduced with permission]. (B) Quantification of pH3 positive cells in tadpole brain following intracerebroventricular injection of saline or recombinant Xenopus leptin (rxLeptin) (200 ng/g BW). Tadpoles were given two injections, the second 24 h after the first, and then they were killed 48 h after the first injection. *Denotes a statistically significant difference (p < 0.05; Student’s unpaired t-test). (C) Images of transverse sections of the region of the telencephalon [lateral ventricle (lv)] and anterior preoptic area [location of neurosecretory neuron cell bodies; third ventricle (3V)] of tadpole brain stained for pH3. Scale bars = 120 µM. (D) Induction of pSTAT3 immunoreactivity in cells located in the ventricular zone (VZ)/subventricular zone (SVZ) of premetamorphic (Nieuwkoop–Faber stage 50) tadpole brain by rxLeptin (20 ng/g BW; 1 h). The inset shows a higher magnification view of the VZ/SVZ with elongated cells undergoing migration out of the neurogenic zone.
Figure 3
Figure 3
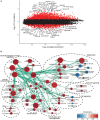
Analysis of microarray data from preoptic area/hypothalamus of saline or recombinant Xenopus leptin (rxLeptin)-injected [intracerebroventricular (i.c.v.) 20 ng/g BW; 2 h] Nieuwkoop–Faber stage 54 tadpoles. (A) Transformed log ratio and mean average plot [log2 fold change (log2FC) vs. average expression] of saline vs. rxLeptin-injected tadpole mRNA levels (see Materials and Methods). Dots represent genes: red = genes with a false-discovery rate <0.05; blue = top 20 differentially expressed and annotated Xenopus laevis genes; black = all other genes. (B) Biological processes, pathways, and modules affected by i.c.v. rxLeptin injection. Enrichment map of enriched biological process gene ontology terms (redundancy reduced, p < 0.05), Kyoto Encyclopedia of Genes and Genomes (KEGG) pathways (p < 0.05), and KEGG modules. Circular node color reflects positive (red) or negative (blue) enrichment. Node color intensity reflects the degree of enrichment relative to the most highly enriched in either direction. Lines (green) represent significant genetic information shared between connected nodes (above 50%), and line thickness represents the degree of shared information.
Figure 4
Figure 4
Validation of leptin-induced genes in Nieuwkoop–Faber stage 54 Xenopus laevis tadpole preoptic area/hypothalamus by reverse transcriptase quantitative real-time PCR (RTqPCR). Tadpoles received an injection intracerebroventricular of 0.6% saline or recombinant Xenopus leptin (rxLeptin) (20 ng/g BW) and were killed 2 h later for tissue harvest for RNA isolation. Gene expression was analyzed by SYBR Green RTqPCR and normalized to the reference gene rpL8 which was not affected by rxLeptin injection (data not shown). Asterisks indicate statistically significant differences from saline injected controls (*p < 0.05; unpaired Student’s t-test).
Figure 5
Figure 5
Gene expression changes in the Wnt/β-catenin signaling pathway. Shown is the Kyoto Encyclopedia of Genes and Genomes Wnt/β-catenin signaling pathway with differential gene expression values plotted for genes with false-discovery rate <0.05. The color of each gene represents the direction of regulation (red = positive; gray = no change; green = negative). log2FC = log2 fold change. The intensity of the color is the value relative to the most highly regulated gene (log2FC = 2.6) in the entire dataset.
Figure 6
Figure 6
Gene expression changes in the TGFβ signaling pathway. Shown is the Kyoto Encyclopedia of Genes and Genomes TGFβ signaling pathway with differential gene expression values plotted for genes with false discover rate <0.05. The color of each gene represents the direction of regulation (red = positive; gray = no change; green = negative). log2FC = log2 fold change. The intensity of the color is the value relative to the most highly regulated gene (log2FC = 2.6) in the entire dataset.
Figure 7
Figure 7
The canonical Wnt/β-catenin signaling pathway is activated by leptin signaling in Xenopus laevis tadpole brain. We injected plasmids into the region of the third ventricle of premetamorphic (Nieuwkoop–Faber stage 50) tadpoles and transfected them by biopolar electroporation-mediate gene transfer. Twenty-four hours after transfection, we screened tadpoles for EGFP expression, and then separated them into eight groups. The reporter vector is given at the top left of each panel. Tadpoles received intracerebroventricular (i.c.v.) injections of 0.6% saline or recombinant Xenopus leptin (rxLeptin) (20 ng/g BW); a separate group was cotransfected with the pGL4.23-6TCF reporter vector and either empty expression vector (pCMVneo-empty) or a vector that expresses constitutively active β-catenin (pcDNA3-S33Y β-catenin). Two hours after i.c.v. injection, tadpoles were killed and brains harvested for dual-luciferase assay. Asterisks indicate statistically significant differences (*p < 0.001, **p < 0.0001; n = 8 tadpoles/treatment).

Similar articles

Cited by

References

    1. Morton GJ, Cummings DE, Baskin DG, Barsh GS, Schwartz MW. Central nervous system control of food intake and body weight. Nature (2006) 443:289–95.10.1038/nature05026 - DOI - PubMed
    1. Denver RJ, Bonett RM, Boorse GC. Evolution of leptin structure and function. Neuroendocrinology (2011) 94:21–38.10.1159/000328435 - DOI - PubMed
    1. Londraville RL, Macotela Y, Duff RJ, Easterling MR, Liu Q, Crespi EJ. Comparative endocrinology of leptin: assessing function in a phylogenetic context. Gen Comp Endocrinol (2014) 203:146–57.10.1016/j.ygcen.2014.02.002 - DOI - PMC - PubMed
    1. Ahima RS, Osei SY. Leptin signaling. Physiol Behav (2004) 81:223–41.10.1016/j.physbeh.2004.02.014 - DOI - PubMed
    1. Myers MG, Cowley MA, Munzberg H. Mechanisms of leptin action and leptin resistance. Annu Rev Physiol (2008) 70:537–56.10.1146/annurev.physiol.70.113006.100707 - DOI - PubMed