. 2017 May 18:6:14.
doi: 10.1186/s40164-017-0074-5. eCollection 2017.

Changes in clinical laboratory parameters and pharmacodynamic markers in response to blinatumomab treatment of patients with relapsed/refractory ALL

Affiliations

Changes in clinical laboratory parameters and pharmacodynamic markers in response to blinatumomab treatment of patients with relapsed/refractory ALL

Virginie Nägele et al. Exp Hematol Oncol. .

Abstract

Background: Blinatumomab has shown a remission rate of 69% in an exploratory single-arm, phase II dose-escalation study in adult patients with relapsed/refractory B-precursor acute lymphoblastic leukemia (ALL). We evaluated changes in laboratory parameters and immunopharmacodynamic markers in patients who received blinatumomab in the exploratory phase II study.

Methods: Data from 36 adults with relapsed/refractory ALL receiving blinatumomab as 4-week continuous IV infusions in various dose cohorts were analyzed for changes in liver enzymes, first-dose parameters, peripheral blood cell subpopulations, and cytokine/granzyme B release. Associations with clinical response were evaluated.

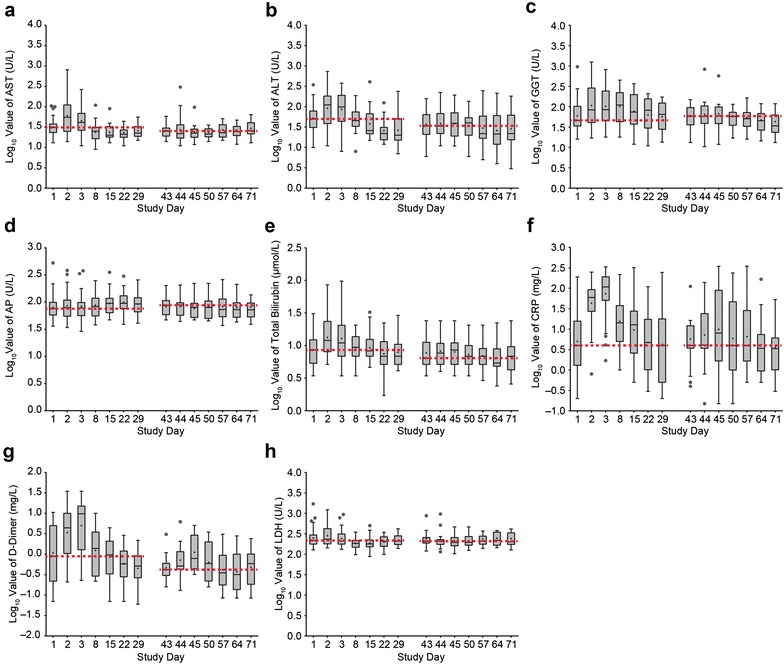
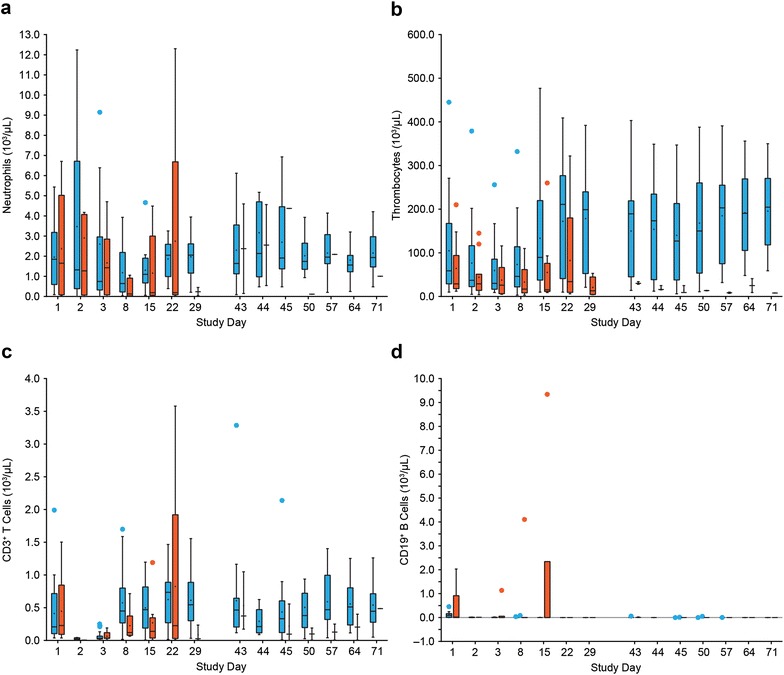
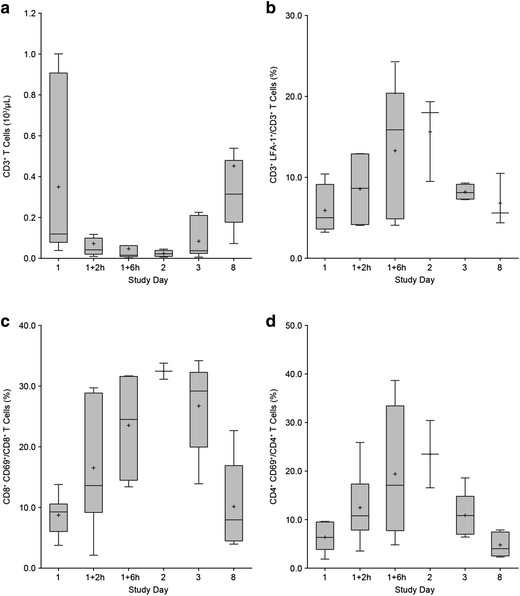
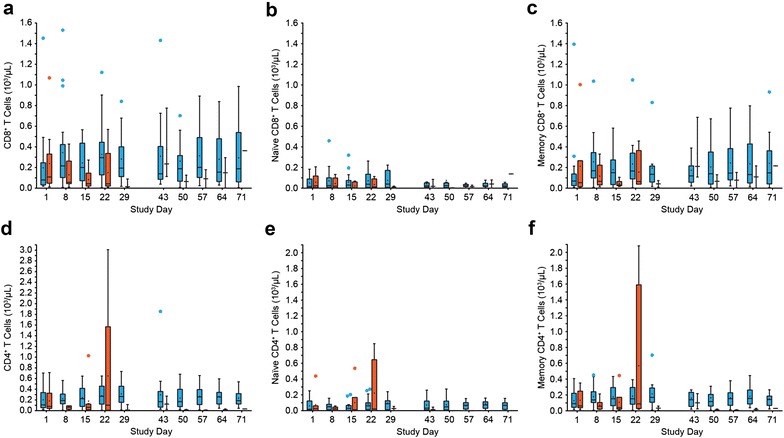
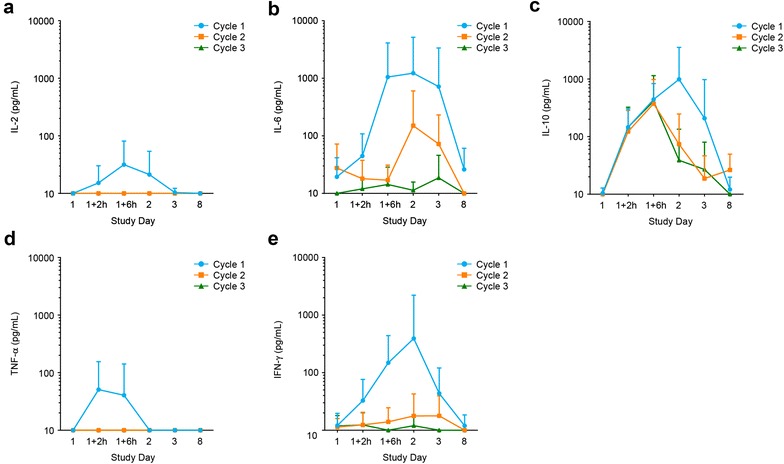
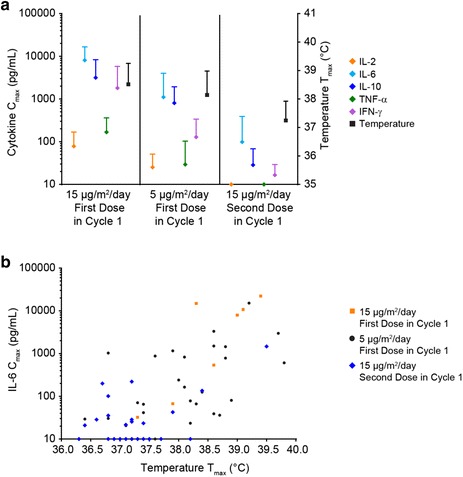
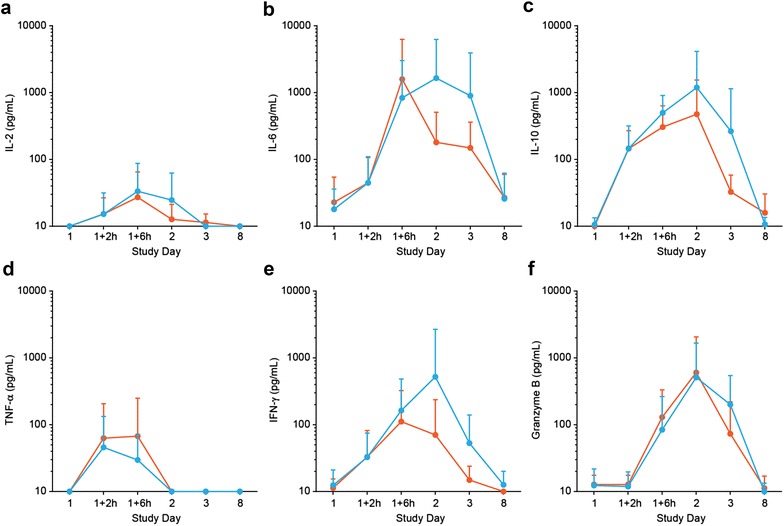
Results: Liver enzymes and inflammatory parameters transiently increased primarily during the first treatment week without clinical symptoms and reversed to baseline levels thereafter. B and T cells showed expected depletion and redistribution kinetics, respectively. Similarly, thrombocytes and T cells displayed an initial decline in cell counts, whereas neutrophils peaked during the first days after infusion start. T-cell redistribution coincided with upregulation of LFA-1 and CD69. Patients who responded to blinatumomab had more pronounced T-cell expansion, which was associated with proliferation of CD4+ and CD8+ T cells and memory subsets. Release of cytokines and granzyme B primarily occurred during the first week of cycle 1, except for IL-10, which was released in subsequent cycles. Blinatumomab step-dosing was associated with lower cytokine release and lower body temperature.

Conclusions: In this study of relapsed/refractory ALL, blinatumomab-induced changes in laboratory parameters were transient and reversible. The evaluated PD markers demonstrated blinatumomab activity, and the analysis of cytokines supported the rationale for stepwise dosing. (ClinicalTrials.gov Identifier NCT01209286.).

Keywords: Acute lymphoblastic leukemia; BiTE®; Bispecific; Blinatumomab; CD19; Liver enzymes; Pharmacodynamics.


Figures

Fig. 1
Fig. 1
Liver and first-dose parameters transiently increase primarily during the first treatment week of cycle 1. Box plots depicting logarithmic serum values of aspartate aminotransferase (AST) (a), alanine amino transferase (ALT) (b), gamma glutamyl transferase (GGT) (c), alkaline phosphatase (AP) (d), total bilirubin (e), C-reactive protein (CRP) (f), D-dimer (g), and lactate dehydrogenase (LDH) (h) in all evaluable patients during cycle 1 and 2. Black line median levels; plus sign mean levels; circle outlying value; red dashed line baseline level in cycle 1 or cycle 2. Boxes extend from the 25th to 75th percentile, with bars extending to the minimum and maximum values within 1.5 times the interquartile range (difference between the 25th and 75th percentile). Corresponding patient numbers are shown in Additional file 1
Fig. 2
Fig. 2
Blinatumomab-induced changes in peripheral blood cell subpopulations. Redistribution of neutrophils (a) and thrombocytes (b), expansion of T cells (c), and kinetics of B-cell depletion (d) in responders versus nonresponders during treatment cycle 1 and 2. Patients were stratified into responders (blue) and nonresponders (red) based on CR/CRh response during the first two treatment cycles. Box plots depict cell counts of all evaluable patients during cycles 1 and 2. Black line median counts; plus sign mean counts; circle outlying value. Boxes extend from the 25th to 75th percentile, with bars extending to the minimum and maximum values within 1.5 times the interquartile range (difference between the 25th and 75th percentile). Corresponding patient numbers are shown in Additional file 2
Fig. 3
Fig. 3
T-cell redistribution during treatment week 1 coincides with activation of LFA-1 and upregulation of CD69. Boxplots depicting the CD3+ T-cell counts of patients with frequent blood sampling during the 1st week after start of infusion in cycle 1 (a), the percentage of CD3+ T cells with activated (i.e., intermediate affinity) LFA-1 (b), the percentage of CD8+ CD69+ (c), and CD4+ CD69+ T cells (d). Black line median values; plus sign mean values. Boxes extend from the 25th to 75th percentile, with bars extending to the minimum and maximum values within 1.5 times the interquartile range (difference between the 25th and 75th percentile). Corresponding patient numbers are shown in Additional file 3
Fig. 4
Fig. 4
CD8+ and CD4+ T-cell expansion in responding patients. Patients were stratified into responders (blue) and nonresponders (red) based on CR/CRh response within the first two treatment cycles. Box plots depicting the cell counts of all evaluable patients are shown for CD8+ T cells (a), naïve CD8+ T cells (b), memory CD8+ T cells (c), CD4+ T cells (d), naïve CD4+ T cells (e), and memory CD4+ T cells (f). Black line median counts; plus sign mean counts; circle outlying value. Boxes extend from the 25th to 75th percentile, with bars extending to the minimum and maximum values within 1.5 times the interquartile range (difference between the 25th and 75th percentile). Corresponding patient numbers are shown in Additional file 4
Fig. 5
Fig. 5
Transient cytokine release primarily occurs during the first days after start of blinatumomab therapy. Mean ± SD serum concentrations of IL-2 (a), IL-6 (b), IL-10 (c), TNF-α (d), and IFN-γ (e) from all evaluable patients during the first treatment week of each of the first three cycles. Corresponding patient numbers are shown in Additional file 5
Fig. 6
Fig. 6
Mitigation of cytokine release by blinatumomab step-dosing. a Mean peak serum concentrations (Cmax) ± SD of cytokines IL-2, IL-6, IL-10, TNF-α, IFN-γ and mean peak body temperature (Tmax) ± SD in patients who received blinatumomab doses of either 5 or 15 µg/m2/day as first dose during treatment week 1, or 15 µg/m2/day as second dose in week 2. b Cmax of IL-6 and Tmax in patients receiving different blinatumomab doses during week 1 or 2. Orange 15 µg/m2/day flat dose; black 5 µg/m2/day first dose in cycle 1; blue 15 µg/m2/day second dose in cycle 1. Corresponding patient numbers are shown in Additional file 6
Fig. 7
Fig. 7
Cytokine and granzyme B release during the first treatment week in responding and nonresponding patients. Patients were stratified into responders (blue) and nonresponders (red) based on CR/CRh response within the first two treatment cycles. Mean ± SD serum concentrations of IL-2 (a), IL-6 (b), IL-10 (c), TNF-α (d), IFN-γ (e), and granzyme B (f) from all evaluable patients during the first treatment week are depicted on a logarithmic scale. Corresponding patient numbers are shown in Additional file 7

References

    1. Wang K, Wei G, Liu D. CD19: a biomarker for B cell development, lymphoma diagnosis and therapy. Exp Hematol Oncol. 2012;1:36. doi: 10.1186/2162-3619-1-36. - DOI - PMC - PubMed
    1. Baeuerle PA, Reinhardt C. Bispecific T-cell engaging antibodies for cancer therapy. Cancer Res. 2009;69:4941–4944. doi: 10.1158/0008-5472.CAN-09-0547. - DOI - PubMed
    1. Topp MS, Kufer P, Gokbuget N, Goebeler M, Klinger M, Neumann S, Horst HA, Raff T, Viardot A, Schmid M, et al. Targeted therapy with the T-cell-engaging antibody blinatumomab of chemotherapy-refractory minimal residual disease in B-lineage acute lymphoblastic leukemia patients results in high response rate and prolonged leukemia-free survival. J Clin Oncol. 2011;29:2493–2498. doi: 10.1200/JCO.2010.32.7270. - DOI - PubMed
    1. Topp MS, Gokbuget N, Zugmaier G, Degenhard E, Goebeler ME, Klinger M, Neumann SA, Horst HA, Raff T, Viardot A, et al. Long-term follow-up of hematologic relapse-free survival in a phase 2 study of blinatumomab in patients with MRD in B-lineage ALL. Blood. 2012;120:5185–5187. doi: 10.1182/blood-2012-07-441030. - DOI - PubMed
    1. Goebeler ME, Knop S, Viardot A, Kufer P, Topp MS, Einsele H, Noppeney R, Hess G, Kallert S, Mackensen A, et al. Bispecific T-Cell engager (BiTE) antibody construct blinatumomab for the treatment of patients with relapsed/refractory non-hodgkin lymphoma: final results from a phase I Study. J Clin Oncol. 2016;34:1104–1111. doi: 10.1200/JCO.2014.59.1586. - DOI - PubMed

Associated data