. 2017 May 18:5:e3341.
doi: 10.7717/peerj.3341. eCollection 2017.

Lid opening and conformational stability of T1 Lipase is mediated by increasing chain length polar solvents

Affiliations

Lid opening and conformational stability of T1 Lipase is mediated by increasing chain length polar solvents

Jonathan Maiangwa et al. PeerJ. .

Abstract

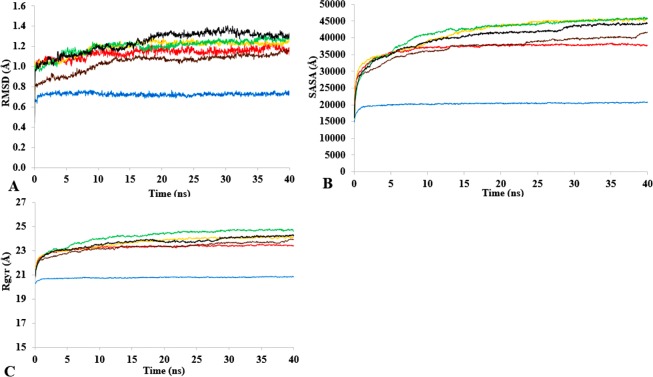
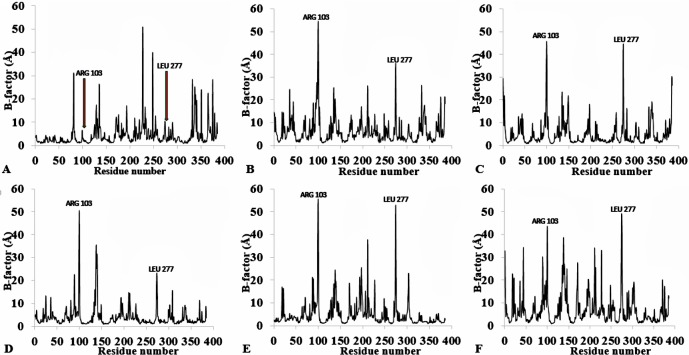
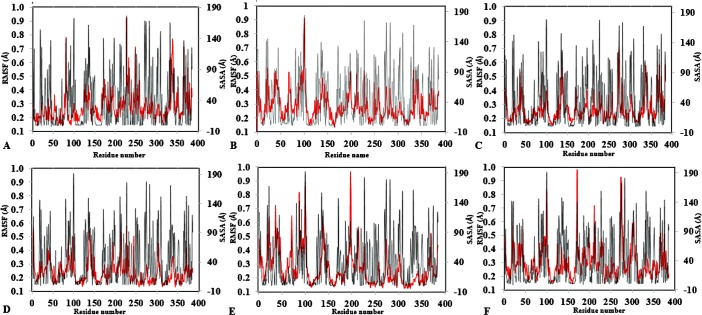
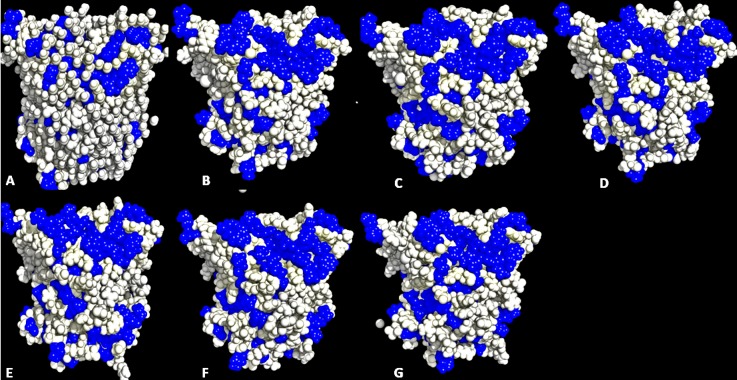
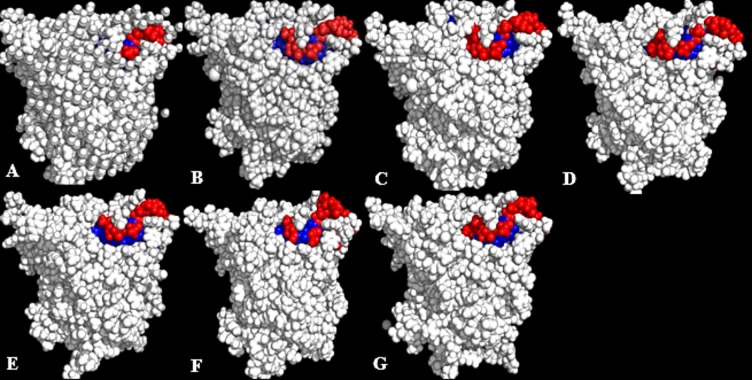
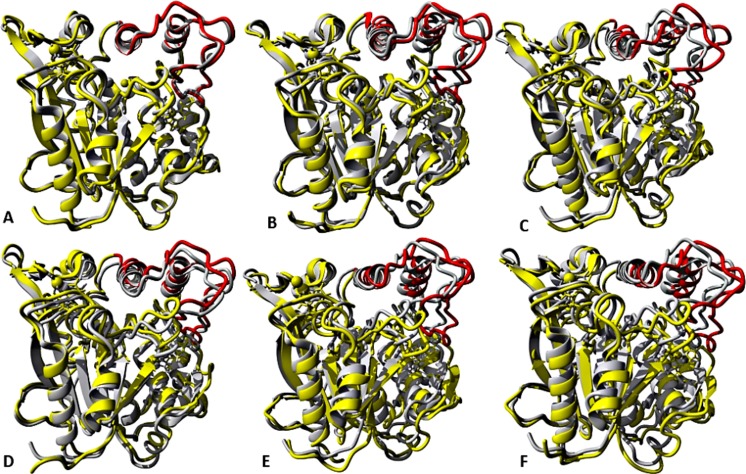
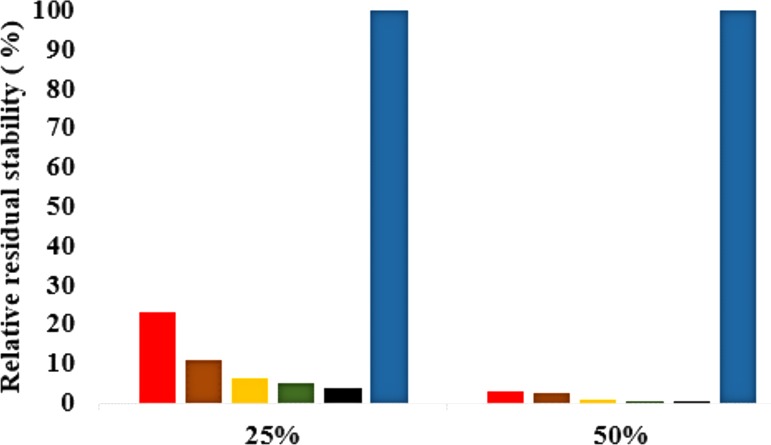
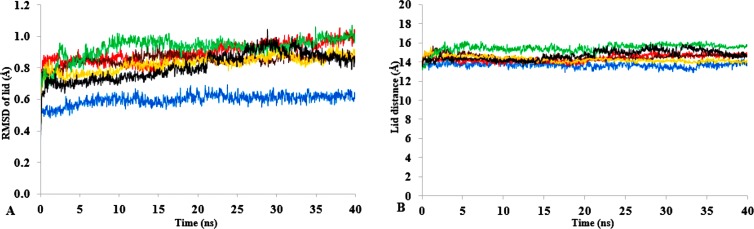
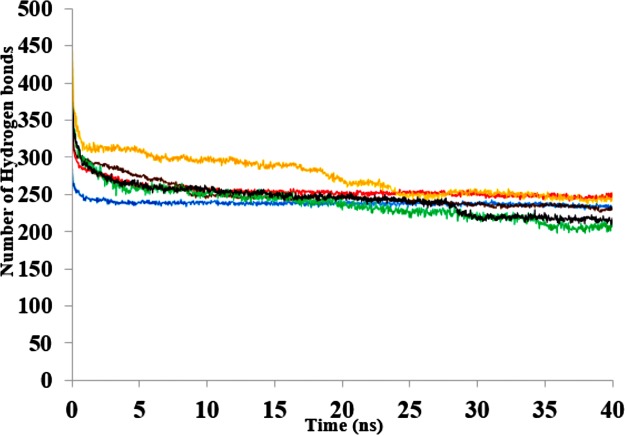
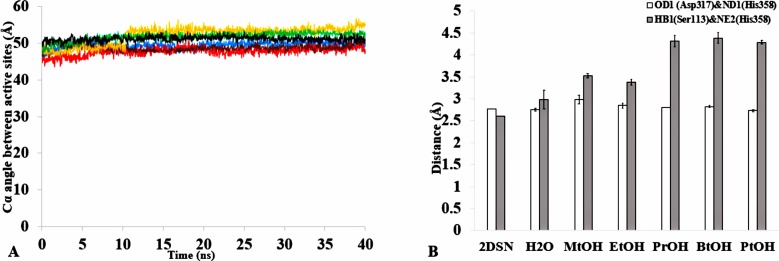
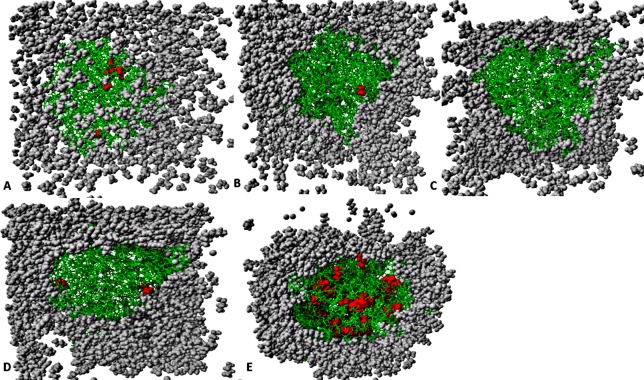
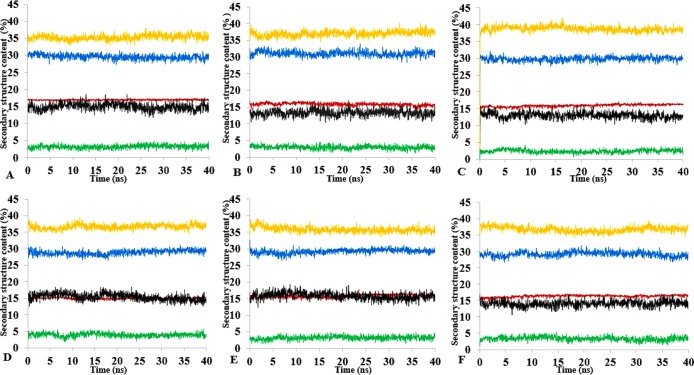
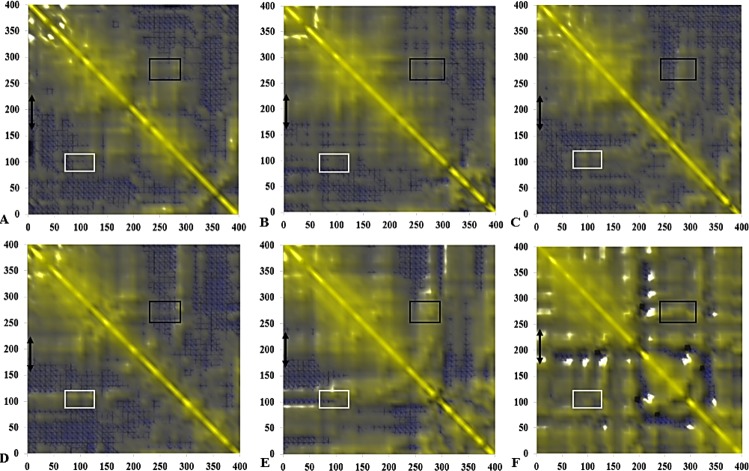
The dynamics and conformational landscape of proteins in organic solvents are events of potential interest in nonaqueous process catalysis. Conformational changes, folding transitions, and stability often correspond to structural rearrangements that alter contacts between solvent molecules and amino acid residues. However, in nonaqueous enzymology, organic solvents limit stability and further application of proteins. In the present study, molecular dynamics (MD) of a thermostable Geobacillus zalihae T1 lipase was performed in different chain length polar organic solvents (methanol, ethanol, propanol, butanol, and pentanol) and water mixture systems to a concentration of 50%. On the basis of the MD results, the structural deviations of the backbone atoms elucidated the dynamic effects of water/organic solvent mixtures on the equilibrium state of the protein simulations in decreasing solvent polarity. The results show that the solvent mixture gives rise to deviations in enzyme structure from the native one simulated in water. The drop in the flexibility in H2O, MtOH, EtOH and PrOH simulation mixtures shows that greater motions of residues were influenced in BtOH and PtOH simulation mixtures. Comparing the root mean square fluctuations value with the accessible solvent area (SASA) for every residue showed an almost correspondingly high SASA value of residues to high flexibility and low SASA value to low flexibility. The study further revealed that the organic solvents influenced the formation of more hydrogen bonds in MtOH, EtOH and PrOH and thus, it is assumed that increased intraprotein hydrogen bonding is ultimately correlated to the stability of the protein. However, the solvent accessibility analysis showed that in all solvent systems, hydrophobic residues were exposed and polar residues tended to be buried away from the solvent. Distance variation of the tetrahedral intermediate packing of the active pocket was not conserved in organic solvent systems, which could lead to weaknesses in the catalytic H-bond network and most likely a drop in catalytic activity. The conformational variation of the lid domain caused by the solvent molecules influenced its gradual opening. Formation of additional hydrogen bonds and hydrophobic interactions indicates that the contribution of the cooperative network of interactions could retain the stability of the protein in some solvent systems. Time-correlated atomic motions were used to characterize the correlations between the motions of the atoms from atomic coordinates. The resulting cross-correlation map revealed that the organic solvent mixtures performed functional, concerted, correlated motions in regions of residues of the lid domain to other residues. These observations suggest that varying lengths of polar organic solvents play a significant role in introducing dynamic conformational diversity in proteins in a decreasing order of polarity.

Keywords: Cross correlations; Interactions; Molecular dynamics; Organic solvent mixtures; Residue fluctuations; Structure conformation.


Conflict of interest statement

The authors declare there are no competing interests.

Figures

Figure 1
Figure 1. Structure of the closed conformation of T1.
View of the T1 structure with different colored domains: (α/ β) hydrolase, cyan; cap domain helix α6 and α7 connected by the loop residues 175–230, yellow; the active site Ser113, magenta; Asp317, red and His358, gray spheres, respectively. Metal ions Zn2+, blue; Ca2+ orange are in spheres held together by a network of amino acid residues, green.
Figure 2
Figure 2. The time dependence of the mean average of replicates root mean square deviations (rmsd) of backbone atoms for the 40 ns simulations of T1 lipase (A).
The Solvent accessible surface area (B) showed higher hydrophobic area of residues according to solvent polarity. The Radius of gyration (C) shows the same level of compactness among solvents compared to H2O. Both properties are calculated from mean average of three replicates of 40 ns simulations of solvent mixtures H2O (blue), MtOH-H2O (red), EtOH-H2O (brown), PrOH-H2O (yellow), BtOH-H2O (green), PtOH-H2O (black).
Figure 3
Figure 3. Per-residue B-factor calculated from the last 10 ns of 40 ns simulations for T1 lipase 2DSN.
The peaks correspond to the mean average of three replicates simulations at different initial velocities. B-factor were calculated from the root mean square fluctuations (rmsf) in (A) H2O, (B) MeOH-H2O, (C) BtOH-H2O, (D) PrOH-H2O, (E) BtOH-H2O, (F) PtOH-H2O. Higher fluctuations are indicated for Arg 103 and Leu 277.
Figure 4
Figure 4. Average RMSF and SASA for each residue in all solvent mixtures (A) H2O, (B) MtOH-, (C) EtOH-, (D) PrOH-, (E) BtOH-, and (F) PtOH-H2O over the last 150 ps simulations.
The red peaks depicts the RMSF per residue, and the gray peaks depicts the SASA per residue of all replicate simulations.
Figure 5
Figure 5. Conformations of exposed hydrophobic residues (blue) of T1 lipase of the last snapshots of 40 ns simulations as compared to (A) crystal structure, (B) H2O, (C) MeOH-H2O, (D) EtOH-H2O, (E) PrOH-H2O, (F) BtOH-H2O, (G) PtOH-H2O solvent mixtures.
Figure 6
Figure 6. Conformations of exposed (red) and buried (blue) hydrophobic residues constituting the lid regions of T1 lipase of the last snapshots of 40 ns simulations as compared to (A) crystal structure, (B) H2O, (C) MtOH-H2O, (D) EtOH-H2O, (E) PrOH-H2O, (F) BtOH-H2O, (G) PtOH-H2O.
At the lid domain, residues with a lower measure of solvent accessible hydrophobic area (<20 Å) were completely buried. Residues with a higher hydrophobic area of the solvent accessible hydrophobic surface were completely exposed.
Figure 7
Figure 7. representative structures of the last 40 ns of T1 lipase (yellow) in different solvent mixtures (A) H2O, (B) MtOH-H2O, (C) EtOH-H2O, (D) PrOH-H2O, (E) BtOH-H2O and (F) PtOH-H2O superposed with the reference crystallographic structure (gray).
Localized structural differences are observed near the lid domain (red) at the beginning of the helix Asp175 all through the loop to Arg230, which shows a gradual lid opening.
Figure 8
Figure 8. Effects of organic solvent on T1 lipase stability.
The lipase activity was determined at 70° C in olive oil emulsion-Glycine-NaOH buffer (pH 9) emulsion as the substrate. After pre-incubation of the lipase at 25% and 50% solvent concentration for 1 h, residual activity was determined according to Kwon & Rhee (1986). The relative residual stability was defined as the activity compared to a native T1 lipase incubated at 50% polar organic solvents and untreated T1 lipase held at 100%. Results are average of three independent experiments. Plots show organic solvent % concentration of treated T1 lipase MtOH red, EtOH brown, PrOH yellow, BtOH green, PtOH black and untreated T1 lipase blue (held at 100%).
Figure 9
Figure 9. (A) lid domain rmsd calculated from the Cα atoms of residue Asp175-Arg230 in all solvents. (B) Distance of the lid measured between Cα Res Asp175 and Cα Res Arg230 with appreciable increase in distance of lid opening among all solvents.
Solvents mixtures are H2O (blue), MtOH-H2O (red), EtOH-H2O (brown), PrOH-H2O (yellow), BtOH-H2O (green), PtOH-H2O (black). All analysis are the mean average of three replicates of 40 ns simulations.
Figure 10
Figure 10. The number of hydrogen bonds within the solute as a function of the H-bond-acceptor distance in Å  of 40 ns simulations.
Solvent mixtures are H2O (blue), MtOH-H2O (red), EtOH-H2O (brown), PrOH-H2O (yellow), BtOH-H2O (green), PtOH-H2O (black).
Figure 11
Figure 11. (A) The angle between the active site residue Cα atoms of Ser113, Asp 317 and His358 in all solvents environments of H2O (blue), MtOH-H2O (red), EtOH-H2O (brown), PrOH-H2O (yellow), BtOH-H2O (green), and PtOH-H2O (black). (B) The distance between the active site residues of the last structure from the solvent mixtures environments between OD2-Asp317 and ND1-His358 (bars in white) is conserved, allowing the formation of Hbond.
However, the distance is not conserved between HB1-Ser113 and NE2-His358 (bars in gray) in the organic solvent mixtures. One hydrogen bond is considered to be presented if both the distance between the hydrogen atom acceptor and hydrogen atom donor is <3.5. All analysis are the mean average of three replicates of 40 ns simulations.
Figure 12
Figure 12. The penetration of organic solvent molecules into the protein as revealed from last trajectory of 40 ns simulations in (A) MtOH-H2O, (B) EtOH-H2O, (C) PrOH-H2O, (D) BtOH-H2O, and (E) PtOH-H2O.
The organic solvent molecules that penetrated into the protein core are in red spheres, while other molecules are represented in gray spheres and protein structure represented in green sticks. Pentanol solvent molecules had higher penetration as compared to other organic molecules.
Figure 13
Figure 13. Mean average of replicate 40 ns simulations of preserved secondary structure assignment of T1 lipase in H2O (A), MtOH-H2O (B), EtOH-H2O (C), PrOH-H2O (D), BtOH-H2O (E), PtOH-H2O (F).
Increase in coil (yellow) and decrease in sheet (red) occurred in some solvents. The solvents did not have a significant influence on the turn (black), helix (blue) and 3–10 helix (green).
Figure 14
Figure 14. Calculated dynamical cross-correlations map for T1 lipase over the last 10 ns of 40 ns simulations in (A) H2O, (B) MtOH-H2O, (C) EtOH-H2O, (D) PrOH-H2O, (E) BtOH-H2O, (F) PtOH-H2O solvent mixtures.
The DCCM matrix is visualized automatically with colours ranging from blue (−1, fully anti-correlated) to yellow (+1, fully correlated) with the zero level (0, not correlated) indicated by the blue wire-frame grid. Correlated movements between residues 175–230 to other residue is highlighted with a black double arrow. Regions comprising correlated movements of residues Arg103 to Leu277 are shown with white and black boxes, respectively. All correlation analysis were considered from the y-axis across the maps.

Similar articles

Cited by

References

    1. Abdul Rahman MZ, Salleh AB, Abdul Rahman RNZR, Abdul Rahman MB, Basri M, Leow TC. Unlocking the mystery behind the activation phenomenon of T1 lipase: a molecular dynamics simulations approach. Protein Science. 2012;21:1210–1221. doi: 10.1002/pro.2108. - DOI - PMC - PubMed
    1. Andreini C, Bertini I, Cavallaro G, Holliday GL, Thornton JM. Metal ions in biological catalysis: from enzyme databases to general principles. Journal of Biological Inorganic Chemistry. 2008;13:1205–1218. doi: 10.1007/s00775-008-0404-5. - DOI - PubMed
    1. Arcangeli C, Bizzarri AR, Cannistraro S. Molecular dynamics simulation and essential dynamics study of mutated plastocyanin: structural, dynamical and functional effects of a disulfide bridge insertion at the protein surface. Biophysical Chemistry. 2001;92:183–199. doi: 10.1016/S0301-4622(01)00199-5. - DOI - PubMed
    1. Arnold FH. Engineering enzymes for non-aqueous solvents. Trends in Biotechnology. 1990;8:244–249. doi: 10.1016/0167-7799(90)90186-2. - DOI - PubMed
    1. Arpigny JL, Jaeger KE. Bacterial lipolytic enzymes: classification and properties. The Biochemical Journal. 1999;343:177–183. doi: 10.1042/bj3430177. - DOI - PMC - PubMed

LinkOut - more resources