

Applying protein-based amide proton transfer MR imaging to distinguish solitary brain metastases from glioblastoma
- PMID: 28534162
- PMCID: PMC5744886
- DOI: 10.1007/s00330-017-4867-z
Applying protein-based amide proton transfer MR imaging to distinguish solitary brain metastases from glioblastoma
Abstract
Objectives: To determine the utility of amide proton transfer-weighted (APTw) MR imaging in distinguishing solitary brain metastases (SBMs) from glioblastomas (GBMs).
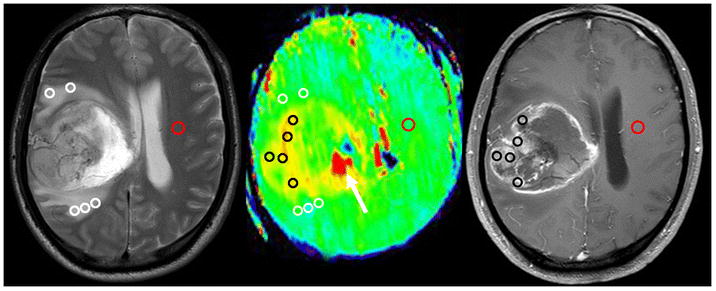
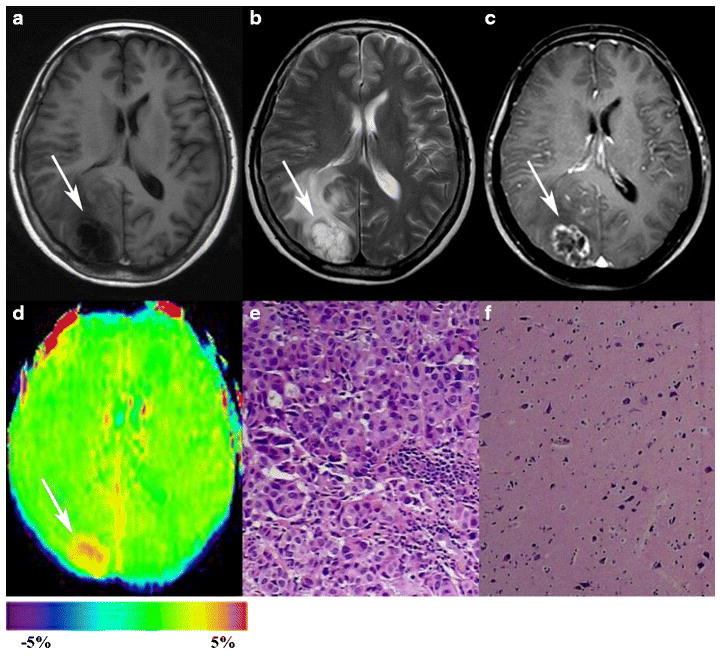
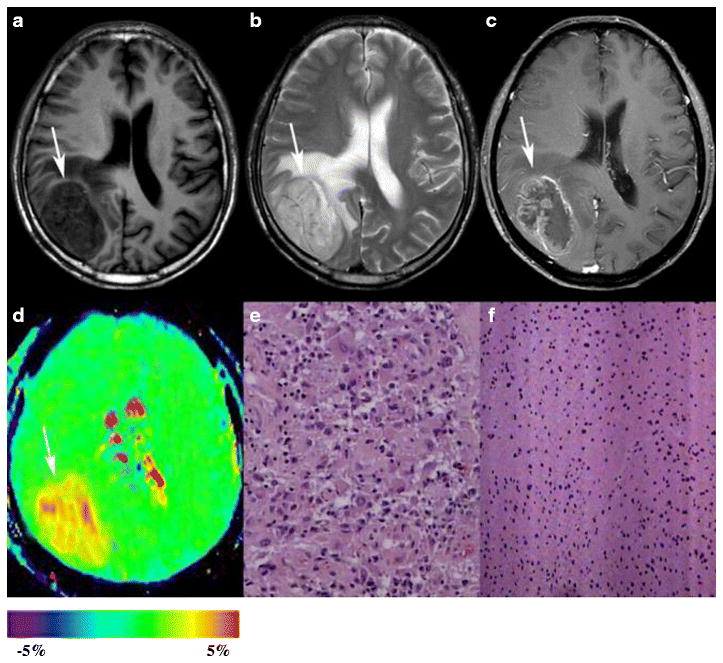
Methods: Forty-five patients with SBMs and 43 patients with GBMs underwent conventional and APT-weighted sequences before clinical intervention. The APTw parameters and relative APTw (rAPTw) parameters in the tumour core and the peritumoral brain zone (PBZ) were obtained and compared between SBMs and GBMs. The receiver-operating characteristic (ROC) curve was used to assess the best parameter for distinguishing between the two groups.
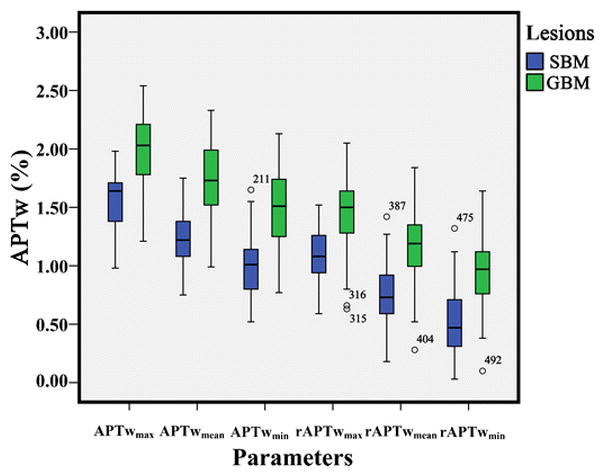
Results: The APTwmax, APTwmin, APTwmean, rAPTwmax, rAPTwmin or rAPTwmean values in the tumour core were not significantly different between the SBM and GBM groups (P = 0.141, 0.361, 0.221, 0.305, 0.578 and 0.448, respectively). However, the APTwmax, APTwmin, APTwmean, rAPTwmax, rAPTwmin or rAPTwmean values in the PBZ were significantly lower in the SBM group than in the GBM group (P < 0.001). The APTwmin values had the highest area under the ROC curve 0.905 and accuracy 85.2% in discriminating between the two neoplasms.
Conclusion: As a noninvasive imaging method, APT-weighted MR imaging can be used to distinguish SBMs from GBMs.
Key points: • APTw values in the tumour core were not different between SBMs and GBMs. • APTw values in peritumoral brain zone were lower in SBMs than in GBMs. • The APTw min was the best parameter to distinguish SBMs from GBMs.
Keywords: APT imaging; Brain; Glioblastoma; Magnetic resonance imaging; Solitary brain metastases.
Figures
Similar articles
-
Histogram analysis of amide proton transfer-weighted imaging: comparison of glioblastoma and solitary brain metastasis in enhancing tumors and peritumoral regions.Eur Radiol. 2019 Aug;29(8):4133-4140. doi: 10.1007/s00330-018-5832-1. Epub 2018 Nov 28. Eur Radiol. 2019. PMID: 30488111
-
Combining amide proton transfer-weighted and arterial spin labeling imaging to differentiate solitary brain metastases from glioblastomas.Magn Reson Imaging. 2023 Oct;102:96-102. doi: 10.1016/j.mri.2023.05.004. Epub 2023 May 10. Magn Reson Imaging. 2023. PMID: 37172748
-
Can amide proton transfer-weighted imaging differentiate tumor grade and predict Ki-67 proliferation status of meningioma?Eur Radiol. 2019 Oct;29(10):5298-5306. doi: 10.1007/s00330-019-06115-w. Epub 2019 Mar 18. Eur Radiol. 2019. PMID: 30887206 Free PMC article.
-
APT-weighted MRI: Techniques, current neuro applications, and challenging issues.J Magn Reson Imaging. 2019 Aug;50(2):347-364. doi: 10.1002/jmri.26645. Epub 2019 Jan 20. J Magn Reson Imaging. 2019. PMID: 30663162 Free PMC article. Review.
-
Review and consensus recommendations on clinical APT-weighted imaging approaches at 3T: Application to brain tumors.Magn Reson Med. 2022 Aug;88(2):546-574. doi: 10.1002/mrm.29241. Epub 2022 Apr 22. Magn Reson Med. 2022. PMID: 35452155 Free PMC article. Review.
Cited by
-
Association between the Anatomical Location of Glioblastoma and Its Evaluation with Clinical Considerations: A Systematic Review and Meta-Analysis.J Clin Med. 2024 Jun 13;13(12):3460. doi: 10.3390/jcm13123460. J Clin Med. 2024. PMID: 38929990 Free PMC article. Review.
-
Chemical exchange saturation transfer magnetic resonance imaging and its main and potential applications in pre-clinical and clinical studies.Quant Imaging Med Surg. 2019 Oct;9(10):1747-1766. doi: 10.21037/qims.2019.10.03. Quant Imaging Med Surg. 2019. PMID: 31728316 Free PMC article. Review.
-
3-Tesla amide proton transfer-weighted imaging (APT-WI): elevated signal also in tumor mimics.Eur Radiol. 2025 Jun;35(6):3558-3567. doi: 10.1007/s00330-024-11202-8. Epub 2024 Nov 26. Eur Radiol. 2025. PMID: 39592486
-
Differentiation of glioma and solitary brain metastasis: a multi-parameter magnetic resonance imaging study using histogram analysis.BMC Cancer. 2024 Jul 5;24(1):805. doi: 10.1186/s12885-024-12571-5. BMC Cancer. 2024. PMID: 38969990 Free PMC article.
-
Differentiation of Brain Metastases and Gliomas Based on Color Map of Phase Difference Enhanced Imaging.Front Neurol. 2018 Sep 21;9:788. doi: 10.3389/fneur.2018.00788. eCollection 2018. Front Neurol. 2018. PMID: 30298047 Free PMC article.
References
MeSH terms
Substances
Grants and funding
LinkOut - more resources
Full Text Sources
Other Literature Sources
Medical
Research Materials
