. 2017 May 23:8:15264.
doi: 10.1038/ncomms15264.

Cis-perturbation of cancer drivers by the HTLV-1/BLV proviruses is an early determinant of leukemogenesis

Affiliations

Cis-perturbation of cancer drivers by the HTLV-1/BLV proviruses is an early determinant of leukemogenesis

Nicolas Rosewick et al. Nat Commun. .

Abstract

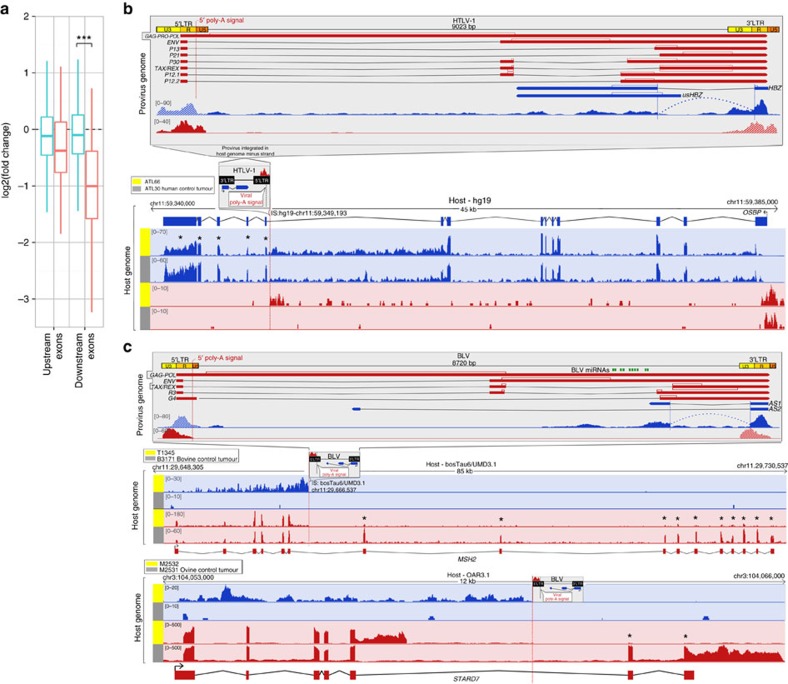
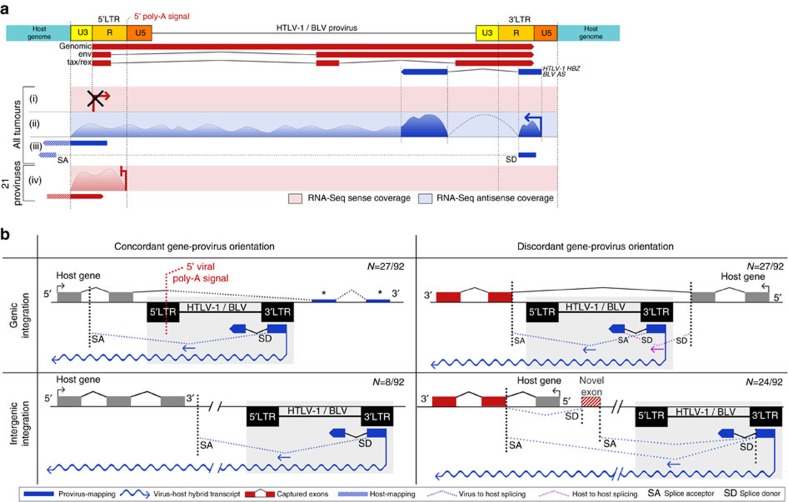
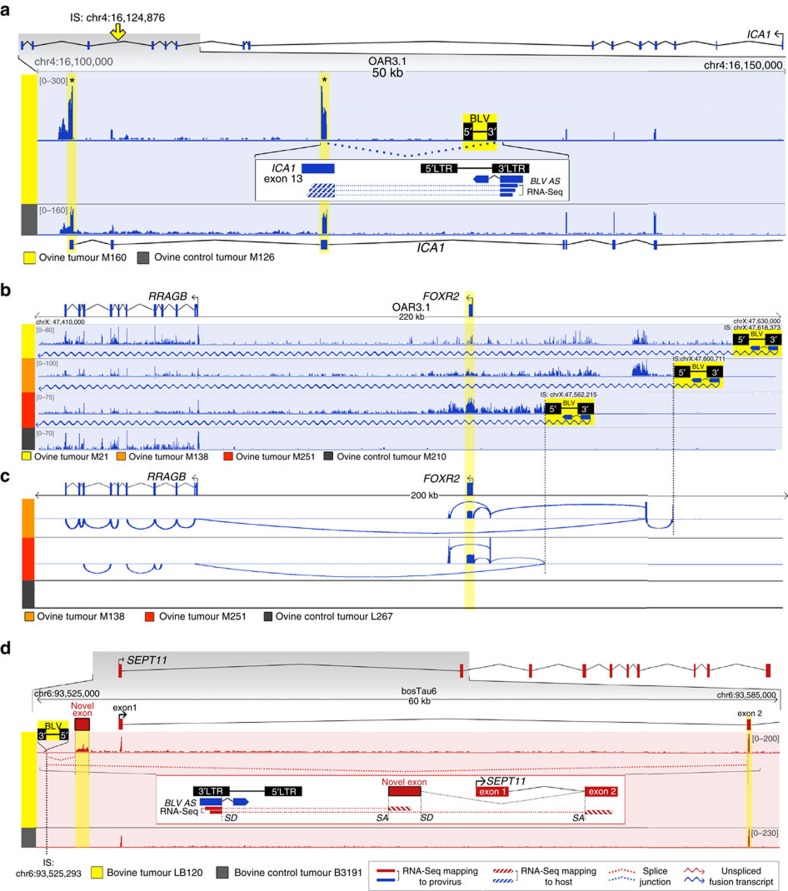
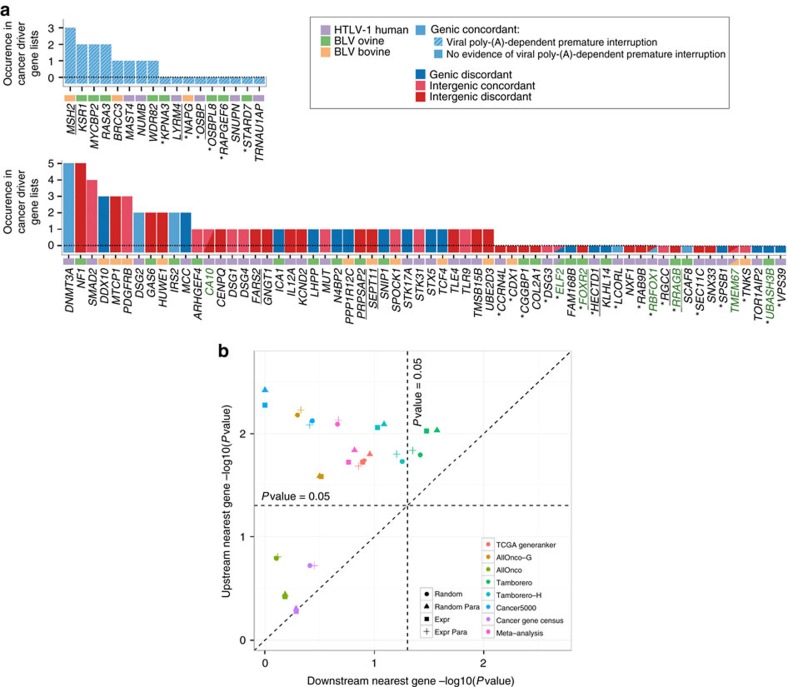
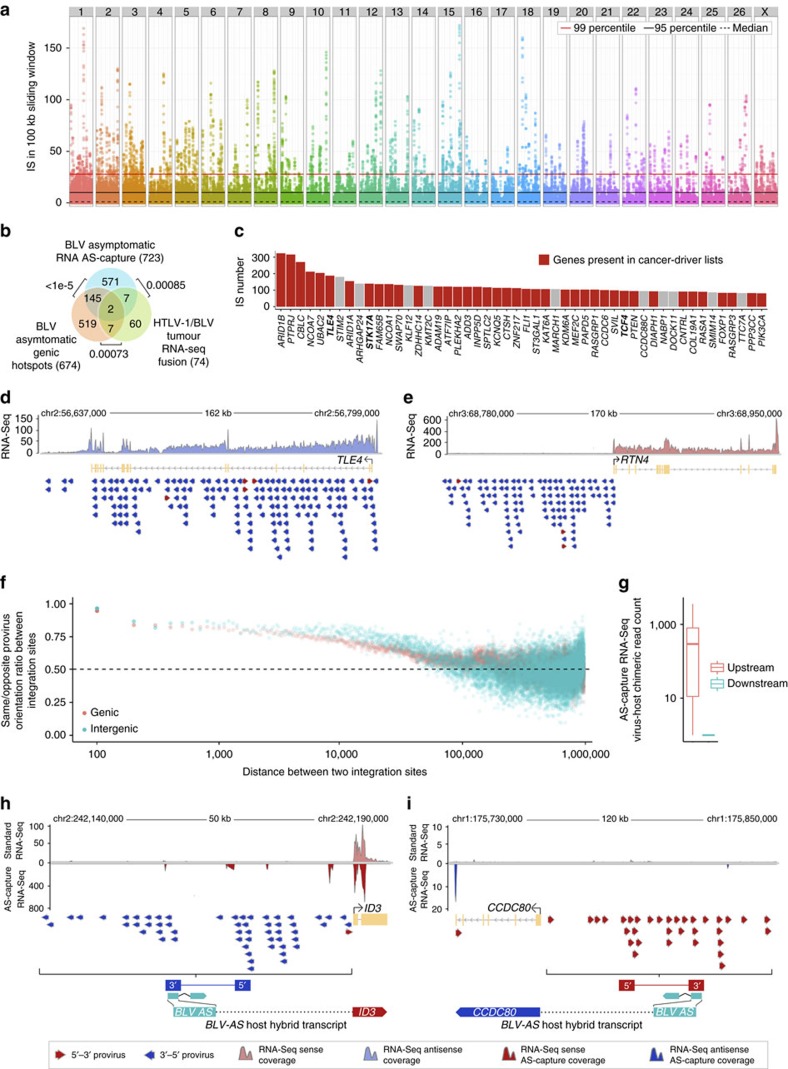
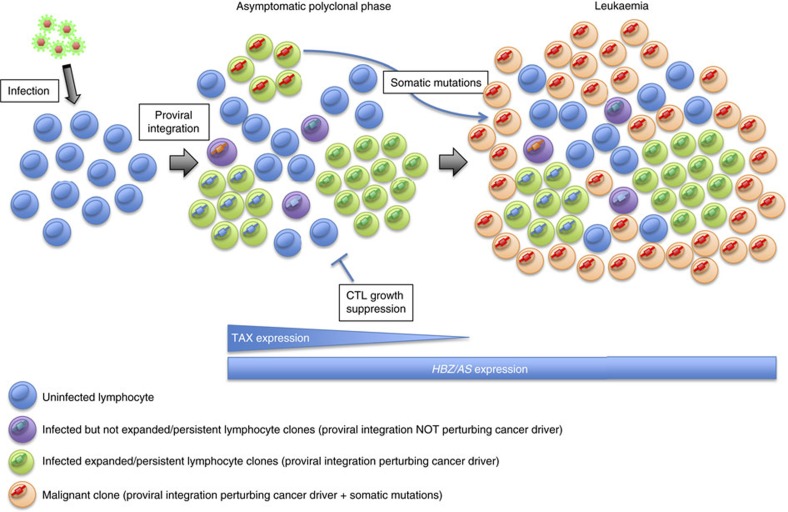
Human T-cell leukaemia virus type-1 (HTLV-1) and bovine leukaemia virus (BLV) infect T- and B-lymphocytes, respectively, provoking a polyclonal expansion that will evolve into an aggressive monoclonal leukaemia in ∼5% of individuals following a protracted latency period. It is generally assumed that early oncogenic changes are largely dependent on virus-encoded products, especially TAX and HBZ, while progression to acute leukaemia/lymphoma involves somatic mutations, yet that both are independent of proviral integration site that has been found to be very variable between tumours. Here, we show that HTLV-1/BLV proviruses are integrated near cancer drivers which they affect either by provirus-dependent transcription termination or as a result of viral antisense RNA-dependent cis-perturbation. The same pattern is observed at polyclonal non-malignant stages, indicating that provirus-dependent host gene perturbation contributes to the initial selection of the multiple clones characterizing the asymptomatic stage, requiring additional alterations in the clone that will evolve into full-blown leukaemia/lymphoma.


Conflict of interest statement

The authors declare no competing financial interests.

Figures

Figure 1
Figure 1. Provirus-dependent host gene interruption in HTLV-1/BLV primary tumours with genic-concordant proviral integration.
(a) Normalized RNA-seq read counts of upstream (left) and downstream (right) exons relative to the proviral integration site in the tumour set characterized by genic-concordant proviruses (red plot, N=21) and control tumours without integration in that gene (blue plot). ***P=5.878e-08 (Mann–Whitney U-test). (b) Transcription patterns of human leukaemia ATL66 shown as RNA-seq sense (red) and antisense (blue) coverage mapped to the proviral (top) or host (bottom) genomes visualized in Integrative Genomic Viewer (IGV). Top panel: HTLV-1 proviral genome flanked by 5′LTR/3′LTR redundant regions (U3, R, U5) that contain regulatory elements, transcriptional start sites (TSS) and poly-(A) signal. Positive-strand transcripts (red) encode structural and regulatory (TAX/REX) proteins; spliced HBZ antisense transcripts (blue) expressed from negative-strand. ATL66 RNA-seq coverage of HTLV-1: HBZ antisense transcripts and upstream coverage exposing hybrid transcripts; positive coverage of 5′LTR reveals read-through transcription and provirus-dependent premature polyadenylation of host gene OSBP. Absence of 5′LTR-driven viral transcription. Bottom panel: mapping to host genome (hg19). Small box: HTLV-1 integration in OSBP introns 9–10 (opposite orientation). OSBP exons 10–14 show decreased coverage (*ATL66/control ATLs (N=39): 52% decrease, ATL66 OSBP downstream/upstream exons, fold-change=0.52). Sense coverage: 3′LTR-dependent chimeric transcript in antisense overlap with OSBP. (c) Transcription patterns of bovine T1345/ovine M2532 B-cell tumours shown as RNA-seq sense (red) and antisense (blue) coverage mapped to the proviral (top) or host (bottom) genomes. Top: BLV genome, annotation and T1345 RNA-seq coverage representative of both tumours: AS1 antisense transcription; positive coverage of 5′LTR reveals host gene transcription (read-through) and provirus-dependent premature polyadenylation. Bottom panels: mapping to host genomes (UMD3.1 and OAR3.1). Small box: BLV integration in MSH2 (ref. 33) intron 6 or STARD7 (ref. 34) intron 5. Decrease of MSH2 and STARD7 downstream exon coverage (*MSH2 T1345/control tumours (N=14), 88% decrease; T1345 MSH2 downstream/upstream exons, fold-change=0.12 and STARD7: 96% decrease (control tumours, N=31), downstream/upstream exon fold-change=0.08). Antisense coverage: 3′AS-dependent chimeric transcript in antisense overlap with MSH2/STARD7. See also Supplementary Fig. 3 for RNA-seq coverage assignment to 5′LTR/3′LTR.
Figure 2
Figure 2. Viral antisense RNA-dependent transcriptional interactions with the host genome in HTLV-1/BLV primary tumours.
(a) Schematics of RNA-seq coverage mapped to HTLV-1/BLV in ATLs/B-cell tumours and antisense-predominant viral transcription. Top: proviral genome and simplified HTLV-1/BLV common annotation: positive-strand transcripts (red), spliced HBZ/AS antisense transcripts (blue). (i–iv): RNA-seq coverage. In all tumours, (i) absence of 5′LTR-dependent positive-strand coverage (structural proteins and TAX, Supplementary Fig. 3), (ii) 3′LTR-dependent HBZ/AS antisense transcripts (dark-blue) and upstream coverage (light-blue), (iii) hybrid antisense reads that span HBZ/AS exon 1-host and 5′LTR-host boundaries, supporting 3′LTR-dependent chimeric transcripts. In 21 proviruses (genic-concordant), (iv) positive coverage of host-5′LTR-U3/R boundary (viral poly-(A)-dependent host transcript truncation). See also Supplementary Fig. 3: coverage for 24 representative tumours and Supplementary Fig. 4: secondary types of virus-host transcriptional interactions. (b) Four main patterns of viral antisense RNA-dependent transcriptional interactions with the tumour genome: upper left: genic integration, concordant gene-provirus transcriptional orientation. Viral 5′LTR poly-(A)-dependent gene interruption, downstream exon decreased expression (*blue boxes, see also Fig. 1) and 3′AS-dependent hybrid transcript in antisense overlap with upstream sequences. Splicing to host cryptic SA (10/21 proviruses). Upper right: genic integration, discordant gene-provirus transcriptional orientation. 3′AS-dependent virus–host hybrid transcript and HBZ/AS exon 1 SD sequestration by upstream host exon(s) (i.e., tumour M160/ICA1; Fig. 3a). Capture of viral HBZ/AS exon 2 by downstream host gene exon (10/27 proviruses). Bottom left: intergenic integration, concordant gene-provirus transcriptional orientation. 3′AS-dependent virus–host chimeric transcript in antisense overlap with host gene (i.e., ATL1_Ly/RGCC; Supplementary Fig. 5a). Bottom right: intergenic integration, discordant gene–provirus transcriptional orientation. 3′AS-dependent chimeric transcript in sense overlap with upstream host gene(s) (i.e., tumours M138, M251 and M21/FOXR2 and RRAGB; Fig. 3b,c), and capture of exon 2 or novel exon that creates non-canonical isoforms (i.e., tumour LB120/SEPT11; Fig. 3d). Six proviruses were integrated in gene deserts (Supplementary Table 1 and Supplementary Data 2). See Supplementary Figs 4 and 6: comprehensive characterization of dominant and secondary types of virus-host interactions in tumours. RNA-seq splice junctions/breakpoints were validated by RT–PCR for representative tumours of each group (Supplementary Fig. 7).
Figure 3
Figure 3. Viral antisense RNA-dependent cis-perturbation of host genes in representative tumours with discordant proviruses.
RNA-seq antisense (blue) and sense (red) coverages of tumours with genic (a) and intergenic (bd) discordant proviruses. Upper (yellow) and lower (black) IGV tracks: tumour of interest and control tumour, respectively. (a) Genic-discordant provirus and host gene cis-perturbation by 3′AS-dependent capture of upstream exons. Ovine tumour M160: capture and increased coverage of ICA1 exons 13–15; *read counts M160 ICA1 upstream/downstream exons fold-change=11.54; ICA1 upstream exons M160/control tumours (N=31) fold-change=6.89. Box: hybrid RNA-seq split reads spanning BLV AS exon 1 and ICA1 exon 13. (b) Intergenic-discordant provirus and interaction with multiple host genes: RNA-seq of three independent ovine tumours M251, M138, M21 with BLV integration upstream of FOXR2 (ref. 42) (80 kb-window) reveals sense overlap of FOXR2 and RRAGB (ref. 66) by 3′AS-dependent hybrid transcripts (160, 220 and 240 kb in length respectively). (c) 3′AS-capture RNA-seq reveals AS exon 1–FOXR2/RRAGB splice junctions and ectopic expression of FOXR2. Mapping and Sashimi plots of reads obtained from 3′AS-capture RNA libraries (STAR splice-aware aligner) prepared from modified 3′-RACE products of tumours M138 and M251 reveal FOXR2 coverage as well as chimeric split reads exposing splicing events between BLV AS exon 1 and upstream genomic sequences including FOXR2 and RRAGB (white tracks). BLV integration causes ectopic expression of FOXR2 a gene that is not expressed in normal ovine B-cells (L267: control tumour), consistent with a gain-of-function of this well-established oncogene. (d) Intergenic-discordant proviruses generate novel transcript isoforms: host gene cis-perturbation by sense overlap of upstream gene by 3′AS-dependent hybrid transcript with capture of both exon 2 and a novel exon upstream of canonical exon 1, creating two novel isoforms (bovine tumour LB120: BLV integration upstream of SEPT11 (ref. 67), SEPT11 exon 1 skipping). See also Supplementary Fig. 5 for representative tumours with concordant proviruses.
Figure 4
Figure 4. HTLV-1/BLV interacting host genes are connected to cancer.
(a) Transcript-interacting host genes were ranked according to their occurrence in seven cancer driver lists used for enrichment (Table 1 and Supplementary Table 2). Top panel: viral poly-(A) truncated genes disrupted by genic-concordant proviruses. Bottom panel: all genes interacting with 3′AS-dependent transcripts. Cancer drivers are equally represented between provirus types (genic, intergenic) and across species. Underlined genes: genes for which transcriptional patterns in tumours are shown in Figs 1 and 3 and Supplementary Fig. 5. Recurrent genes between tumours: green symbols. *Genes absent from cancer driver lists for which literature screen supported connection to cancer. This list comprises FOXR2, RRAGB, ELF2 and SPSB1 (refs 40, 42, 66, 68), genes that exhibit undeniable oncogenic properties. UBASH3B (BLV, sheep): identified as the target gene of HTLV-1 integration in one of the ATLs analysed in a recent WGS study. The remaining protein-coding genes and interacting non-coding RNAs not previously reported in cancer (Supplementary Data 2 and Supplementary Table 4, antisense transcript-interacting lncRNAs) represent a potential resource of novel candidate cancer drivers of both the coding and noncoding class of genes. (b) Host genes upstream (y-axis) of proviral integration sites in ATLs and B-cell tumours (92 sites) show significant enrichment in cancer drivers in contrast to the corresponding downstream host genes (x-axis), supporting antisense-dependent cancer driver perturbation by HTLV-1/BLV proviruses. The direct target genes of genic proviruses were excluded from the analysis. The significance of the enrichment was computed for seven publicly available cancer driver lists and for all list combined by means of a meta-analysis (Supplementary Data 3 and Supplementary Table 2). Observed scores were compared to simulated scores obtained from N=100,000 size-matched random or expression-matched gene sets, including information about paralogs (Random Para, Expr Para) or not (Random, Expr) (Supplementary Fig. 2). Symbol code: simulated gene sets, colour code: cancer driver lists.
Figure 5
Figure 5. Hotspots of proviral integration at polyclonal nonmalignant stages of infection.
(a) Genome-wide distribution of BLV integration sites in asymptomatic sheep samples. Y-axis: number of integration sites per genomic bin (100 kb overlapping genomic windows sliding by steps of 50 kb). Hotspots of proviral integration were identified by simulation (Methods), defining 674 genic and 48 intergenic hotspots (P<0.05). (b) Significant recurrence (P-values) between genes revealed by BLV genic integration hotspots (674 genes), antisense-RNA interacting genes identified in tumours (74 genes, HTLV-1/BLV) and genes identified by 3′AS-capture RNA-seq of asymptomatic samples (723 genes). All gene subsets showed robust cancer driver enrichment (P<1e-05 and 7e-04 for asymptomatic and tumour samples, respectively, Supplementary Data 3). (c) Top 50 genic integration hotspots. Comprise gene classes like chromatin modifiers, E3-ubiquitin ligases and tumour suppressors (ARID1B, CBL-B, PTEN). Genes in bold: also identified in tumour RNA-seq data set (TLE4 and STK17A: ATLs, TCF4: bovine B-cell tumour). (d) Genic integration hotspot in tumour suppressor TLE4 (ref. 39): arrows represent proviruses (5′–3′ orientation). Of 163 sites, 159 show identical orientation (ratio same/opposite: 0.97) consistent with genic-concordant proviruses predicted to cause TLE4 loss-of-function. TLE4 also affected in tumour data set (ATL62_2). (e) Intergenic integration hotspot upstream of RTN4 (ref. 69): 121/124 sites show identical orientation (ratio same/opposite: 0.97) consistent with intergenic-discordant proviruses predicted to cause RTN4 activation (gain-of-function). Mixed genic–intergenic hotspot type shown in Supplementary Fig. 9 (ATF7IP). (f) Provirus pairs from genic (red) and intergenic (blue) IS data sets were scored for relative orientation and same/opposite ratios computed for all combinations of pairs (Methods). Bias towards same orientation is associated with provirus proximity, consistent with non-randomness of proviral orientation in hotspots. (g) Virus–host chimeric transcripts uncovered by 3′AS-capture RNA-seq map to genomic region upstream of intergenic hotspots consistent with antisense-dependent transcriptional activity. Absence of coverage for corresponding downstream regions. (h) Mapping of 3′AS-capture RNA-seq hybrid reads (red coverage) to genomic region upstream of intergenic hotspot chr2: 242,107,500-242,240,229 reveals antisense-dependent chimeric transcription and interaction with oncogene ID3 (ref. 49). (i) Hybrid reads mapping to genomic region upstream of intergenic hotspot chr1: 175,765,639–175,927,608 (blue coverage) reveal ectopic expression of CCDC80 (not expressed in lymphocytes) consistent with a gain-of-function mechanism.
Figure 6
Figure 6. Model of leukemogenesis by HTLV-1/BLV.
After infection by HTLV-1/BLV the fate of a given infected T-cell/B-cell clone depends on the proviral integration site within the host genome, the expression of TAX and HTLV-1-HBZ/BLV-AS, the host CTL response to HTLV-1/BLV antigens and somatic mutations in the host genome. Asymptomatic polyclonal stage: the integration of HTLV-1/BLV proviruses in the vicinity of cancer drivers causes their perturbation and hence favours the persistence/survival/expansion of the corresponding infected clone (green clones). Clones in which proviral insertions do not affect cancer drivers show a modest survival (purple clones). The relative contribution of each infected clone to the polyclonal population of infected cells results from the balance between cancer driver perturbation, expression of TAX and HBZ/AS that both promote cell growth, and negative selection by the host CTL response. The prolonged life-span of clones in which cancer drivers are perturbed favours the acquisition of further somatic alterations in the host genome. Malignant stage: the accumulation of somatic changes ultimately precipitates the progression of one of the clones to full-blown malignancy (green clone—red integration and orange leukaemic clone). The tumour clone originates from an expanded/persistent clone yet not necessarily the most abundant one. The absence of TAX expression in the tumour clone confers a survival advantage through escape from the strong CTL immune response.

References

    1. Gessain A. & Cassar O. Epidemiological aspects and world distribution of HTLV-1 infection. Front. Microbiol. 3, 388 (2012). - PMC - PubMed
    1. Ishitsuka K. & Tamura K. Human T-cell leukaemia virus type I and adult T-cell leukaemia-lymphoma. Lancet Oncol. 15, e517–e526 (2014). - PubMed
    1. Burny A. et al.. in Viruses and Cancer (eds Minson, A. C., Neil, J. C. & McRae, M. A.) 213–234 (Cambridge University Press, 1994).
    1. Gillet N. et al.. Mechanisms of leukemogenesis induced by bovine leukemia virus: prospects for novel anti-retroviral therapies in human. Retrovirology 4, 18 (2007). - PMC - PubMed
    1. Bartlett P. C. et al.. Options for the control of bovine leukemia virus in dairy cattle. J. Am. Vet. Med. Assoc. 244, 914–922 (2014). - PubMed

Publication types

MeSH terms