. 2017 Dec;37(12):3659-3670.
doi: 10.1177/0271678X17708692. Epub 2017 May 23.

Dynamic brain glucose metabolism identifies anti-correlated cortical-cerebellar networks at rest

Affiliations

Dynamic brain glucose metabolism identifies anti-correlated cortical-cerebellar networks at rest

Dardo G Tomasi et al. J Cereb Blood Flow Metab. 2017 Dec.

Abstract

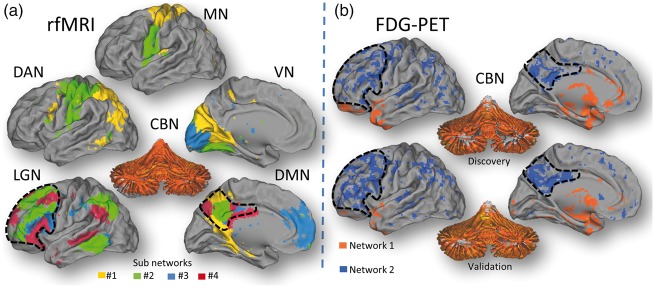
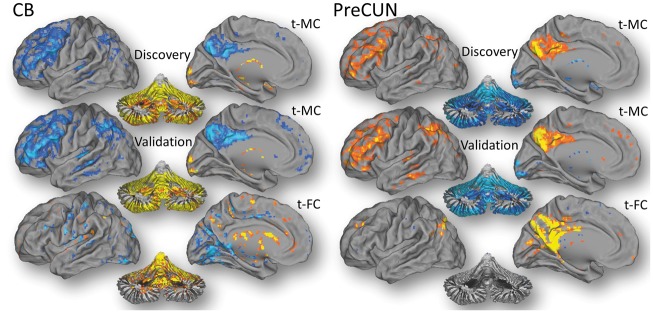
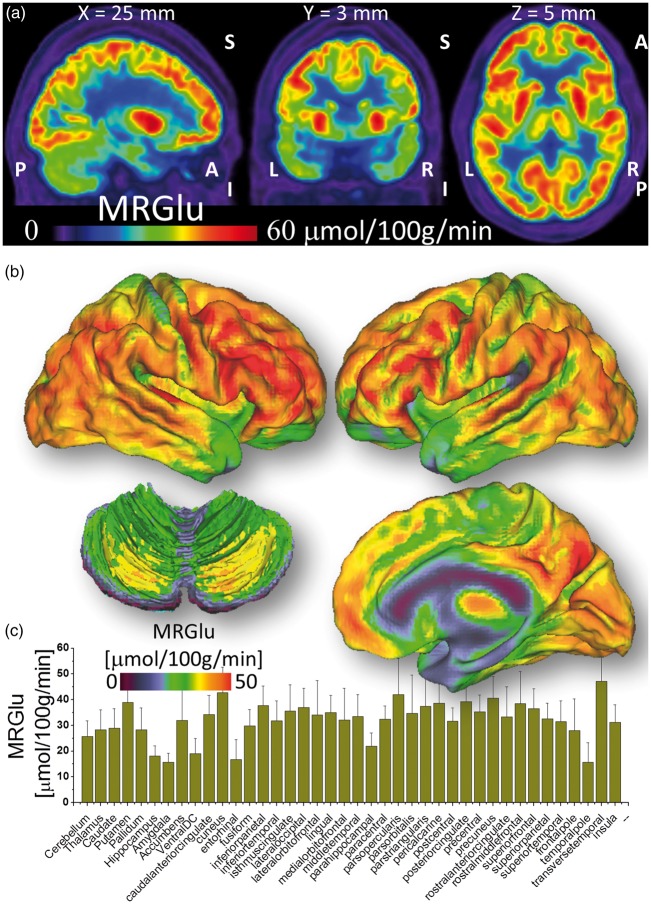
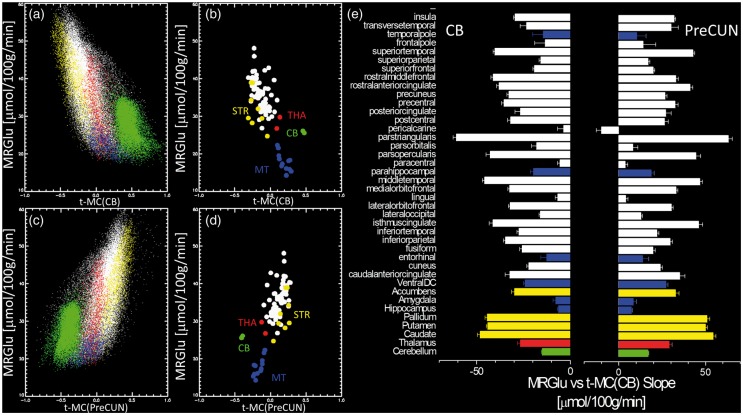
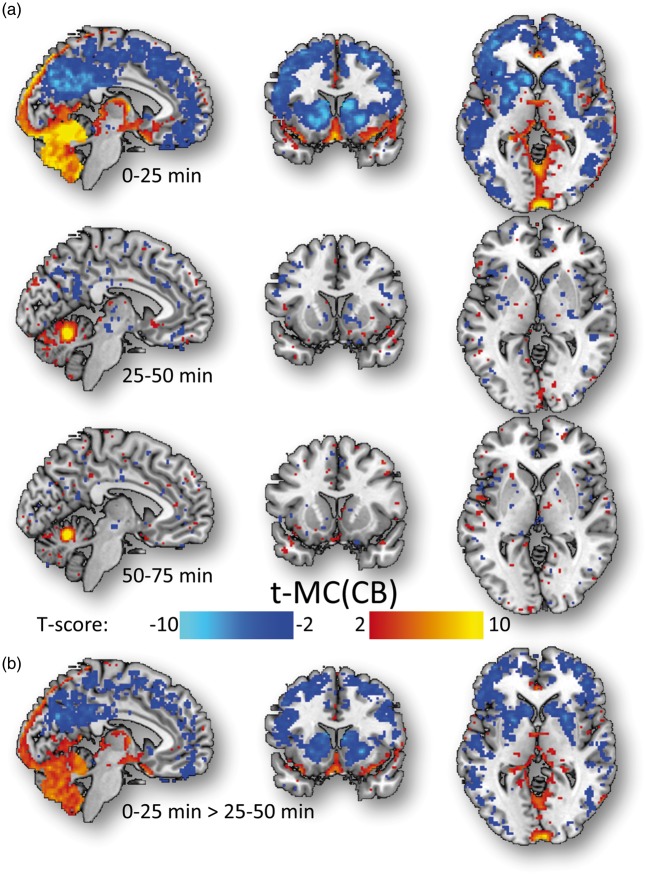
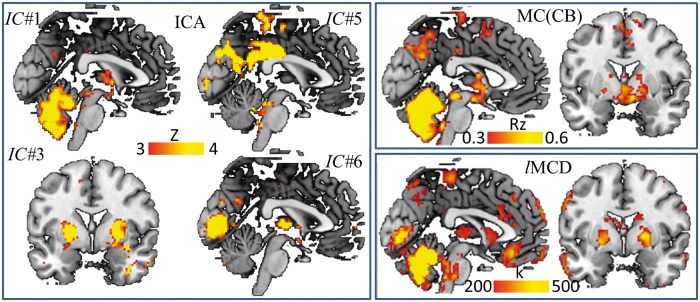
It remains unclear whether resting state functional magnetic resonance imaging (rfMRI) networks are associated with underlying synchrony in energy demand, as measured by dynamic 2-deoxy-2-[18F]fluoroglucose (FDG) positron emission tomography (PET). We measured absolute glucose metabolism, temporal metabolic connectivity (t-MC) and rfMRI patterns in 53 healthy participants at rest. Twenty-two rfMRI networks emerged from group independent component analysis (gICA). In contrast, only two anti-correlated t-MC emerged from FDG-PET time series using gICA or seed-voxel correlations; one included frontal, parietal and temporal cortices, the other included the cerebellum and medial temporal regions. Whereas cerebellum, thalamus, globus pallidus and calcarine cortex arose as the strongest t-MC hubs, the precuneus and visual cortex arose as the strongest rfMRI hubs. The strength of the t-MC linearly increased with the metabolic rate of glucose suggesting that t-MC measures are strongly associated with the energy demand of the brain tissue, and could reflect regional differences in glucose metabolism, counterbalanced metabolic network demand, and/or differential time-varying delivery of FDG. The mismatch between metabolic and functional connectivity patterns computed as a function of time could reflect differences in the temporal characteristics of glucose metabolism as measured with PET-FDG and brain activation as measured with rfMRI.

Keywords: 2-Deoxyglucose; blood-oxygenation level dependent contrast; energy metabolism; magnetic resonance imaging; pharmacokinetics.


Figures

Figure 1.
Figure 1.
Network synchrony. (a) Thirteen of the 22 networks identified by gICA in the Discovery rfMRI datasets were recognized as sub components of six major networks: cerebellum (CBN) language (LNG), motor (MN), visual (VN), dorsal attention (DAN) and default-mode (DMN). Different colors indicate different independent components within each of the major network. gICA reproduced successfully these synchronous networks in the Validation rfMRI datasets. (b) gICA on the FDG-PET Discovery datasets (N = 28) identified two anti-correlated networks, a pattern that was reproduced in the Validation datasets (N = 25).
Figure 2.
Figure 2.
Seed-voxel correlations. Metabolic (t-MC) and functional (t-FC) connectivities for the cerebellar vermis (CB) and precuneus (PreCUN) seed regions in the Discovery cohort (N = 28). t-MC and t-FC patterns were reproduced in the Validation cohort (N = 25).
Figure 3.
Figure 3.
Absolute glucose metabolism. (a) Spatial distribution of the metabolic rate of glucose (MRGlu) overlaid on three orthogonal views of the brain for a randomly selected subject. (b) Average MRGlu across subjects superimposed on dorsal (top) and medial (right bottom) surface views of the cerebrum and a dorsal view of the cerebellum (left bottom). (c) FreeSurfer-based ROI analysis reflecting the average MRGlu within 40 bilateral cortical and subcortical anatomical regions and across 28 healthy subjects (Discovery sample). Patlak analysis was used to quantify MRGlu.
Figure 4.
Figure 4.
Absolute metabolism and network synchrony. Linear regression across voxels (a and c) and across ROI measures (b and d) between the average MRGlu and the average MC for the cerebellum (CB, top left) and precuneus (PreCUN, bottom left). Colors in (a) and (c) distinguish voxels in different ROIs (b and d). The green dots highlight voxels in the cerebellum. (e) Linear regression slope for 40 bilateral cortical and subcortical anatomical regions. Error bars are standard errors. Discovery sample (N = 28).
Figure 5.
Figure 5.
Tracer delivery and t-MC. Statistical significance for the t-MC of the cerebellum computed for three different periods of 25 min (0–25 min; 25–50 min, and 50–75 min; (a), and statistical differences in cerebellar t-MC between the first two periods (b) superimposed on three orthogonal views of the human brain. The anti-correlated t-MC patterns emerged during the first 25 min after tracer injection, likely from pronounced tissue-differences in tracer delivery. Discovery cohort (N = 28).
Figure 6.
Figure 6.
MC across subjects. The MRGlu maps from all 53 subjects were concatenated and used to extract the connectivity patterns across subjects. ICA (left panel) revealed four networks comprising: cerebellum (IC#1), putamen/pallidum (IC#3), precuneus/posterior cingulum (IC#5) and calcarine cortex (IC#6). IC#1 is consistent with the seed-voxel correlation pattern for the cerebellum (MC; right upper panel) and IC#1, IC#3 and IC#6, combined, are consistent with the distribution of local hubs of metabolic connectivity (lMCD; right bottom panel).

References

    1. Biswal B, Yetkin F, Haughton V, et al. Functional connectivity in the motor cortex of resting human brain using echo-planar MRI. Magn Reson Med 1995; 34: 537–541. - PubMed
    1. Biswal B, Mennes M, Zuo X, et al. Toward discovery science of human brain function. Proc Natl Acad Sci USA 2010; 107: 4734–4739. - PMC - PubMed
    1. Di Martino A, Yan C, Li Q, et al. The autism brain imaging data exchange: towards a large-scale evaluation of the intrinsic brain architecture in autism. Mol Psychiatry 2014; 19: 659–667. - PMC - PubMed
    1. Glasser M, Smith S, Marcus D, et al. The Human Connectome Project’s neuroimaging approach. Nat Neurosci 2016; 19: 1175–1187. - PMC - PubMed
    1. Ugurbil K. What is feasible with imaging human brain function and connectivity using functional magnetic resonance imaging. Philos Trans R Soc Lond B Biol Sci 2016; 371: pii: 20150361. - PMC - PubMed

LinkOut - more resources