Microarray analysis of differentially expressed genes in L929 mouse fibroblast cells exposed to leptin and hypoxia
- PMID: 28534985
- PMCID: PMC5482097
- DOI: 10.3892/mmr.2017.6596
Microarray analysis of differentially expressed genes in L929 mouse fibroblast cells exposed to leptin and hypoxia
Abstract
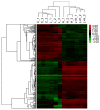
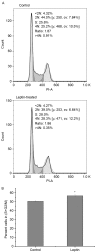
Leptin and hypoxia are pro-fibrotic factors involved in fibrogenesis, however, the gene expression profiles remain to be fully elucidated. The aim of the present study was to investigate the regulatory roles of leptin and hypoxia on the L929 mouse fibroblast cell line. The cells were assigned to a normoxia, normoxia with leptin, hypoxia, and hypoxia with leptin group. The cDNA expression was detected using an Agilent mRNA array platform. The differentially expressed genes (DEGs) in response to leptin and hypoxia were identified using reverse transcription‑quantitative polymerase chain reaction analysis, followed by clustering analysis, Gene Ontology analysis and pathway analysis. As a result, 54, 1,507 and 1,502 DEGs were found in response to leptin, hypoxia and the two combined, respectively, among which 52 (96.30%), 467 (30.99%) and 495 (32.96%) of the DEGs were downregulated. The most significant functional terms in response to leptin were meiosis I for biological process (P=0.0041) and synaptonemal complex for cell component (P=0.0013). Only one significant pathway responded to leptin, which was axon guidance (P=0.029). Flow cytometry confirmed that leptin promoted L929 cell proliferation. The most significant functional terms in response to hypoxia were ion binding for molecular function (P=7.8621E‑05), glucose metabolic process for biological process (P=0.0008) and cell projection part for cell component (P=0.003). There were 12 pathways, which significantly responded to hypoxia (P<0.05) and the pathway with the highest significance was the chemokine signaling pathway (P=0.0001), which comprised 28 genes, including C‑C motif ligand (CCL)1, C‑X‑C motif ligand (CXCL)9, CXCL10, son of sevenless homolog 1, AKT serine/threonine kinase 2, Rho‑associated protein kinase 1, vav guanine nucleotide exchange factor 1, CCL17, arrestin β1 and C‑C motif chemokine receptor 2. In conclusion, the present study showed that leptin and hypoxia altered the profiles of gene expression in L929 cells. These findings not only extend the cell spectrum of leptin on cell proliferation, but also improve current understanding of hypoxia in fibroblast cells.
Figures


References
-
- Peters S. Cystic fibrosis: A review of pathophysiology and current treatment recommendations. S D Med. 2014;67:148–151. 153. - PubMed
MeSH terms
Substances
LinkOut - more resources
Full Text Sources
Other Literature Sources
Research Materials
Miscellaneous

