

Invited Commentary: Selection Bias Without Colliders
- PMID: 28535177
- PMCID: PMC6664806
- DOI: 10.1093/aje/kwx077
Invited Commentary: Selection Bias Without Colliders
Abstract
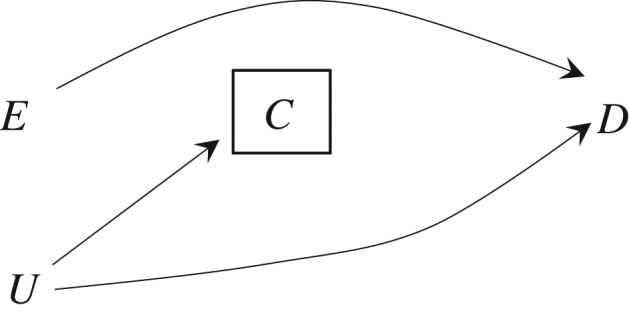
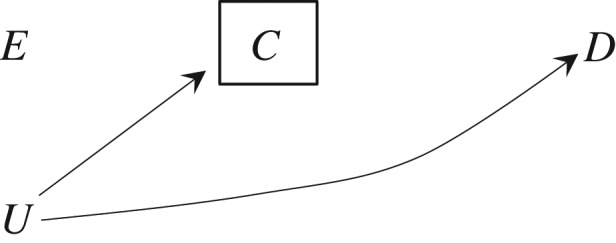
In causal analyses, conditioning on a collider generally results in selection bias. Conditioning on a prognostic factor that is independent of the exposure-and therefore is not a collider-can also result in selection bias when 1) the exposure has a non-null effect on the outcome and 2) the association between the noncollider and the outcome is heterogenous across levels of the exposure. This result was empirically demonstrated by Greenland in 1977 (Am J Epidemiol. 1977;106(3):184-187).
Keywords: causal diagrams; collider; loss to follow-up; selection bias.
© The Author 2017. Published by Oxford University Press on behalf of the Johns Hopkins Bloomberg School of Public Health. All rights reserved. For permissions, please e-mail: journals.permissions@oup.com.
Figures
References
-
- Greenland S. Response and follow-up bias in cohort studies. Am J Epidemiol. 1977;106(3):184–187. - PubMed
-
- Greenland S, Pearl J, Robins JM. Causal diagrams for epidemiologic research. Epidemiology. 1999;10(1):37–48. - PubMed
-
- Hernán MA. Discussion on the paper by Keiding and Louis. J R Stat Soc Ser A Stat Soc. 2016;179(part 2):346–347.
-
- Pearl J. Causal diagrams for empirical research. Biometrika. 1995;82(4):669–688.
-
- Greenland S, Pearl J. Adjustments and their consequences-collapsibility analysis using graphical models. Int Stat Rev. 2011;79(3):401–426.
Publication types
MeSH terms
Grants and funding
LinkOut - more resources
Full Text Sources
Other Literature Sources
