

Characterization of liver injury, oval cell proliferation and cholangiocarcinogenesis in glutathione S-transferase A3 knockout mice
- PMID: 28535182
- PMCID: PMC5862260
- DOI: 10.1093/carcin/bgx048
Characterization of liver injury, oval cell proliferation and cholangiocarcinogenesis in glutathione S-transferase A3 knockout mice
Abstract
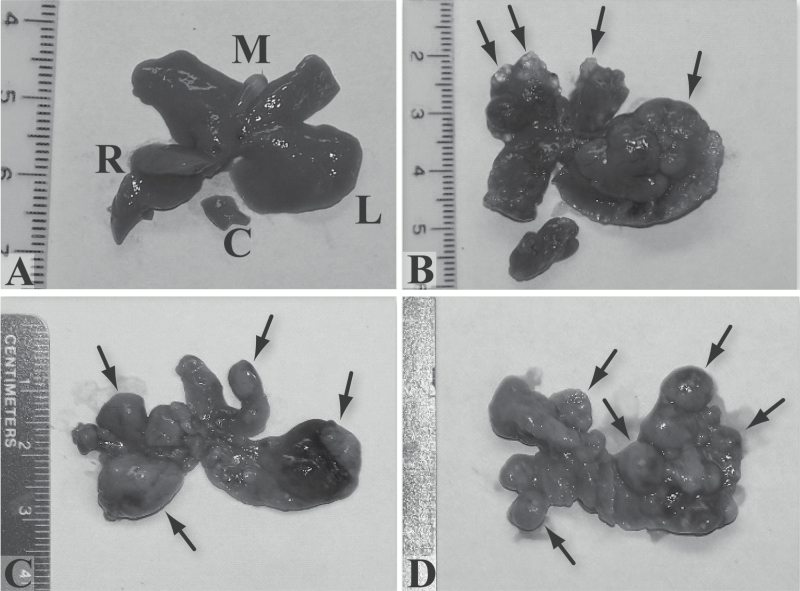
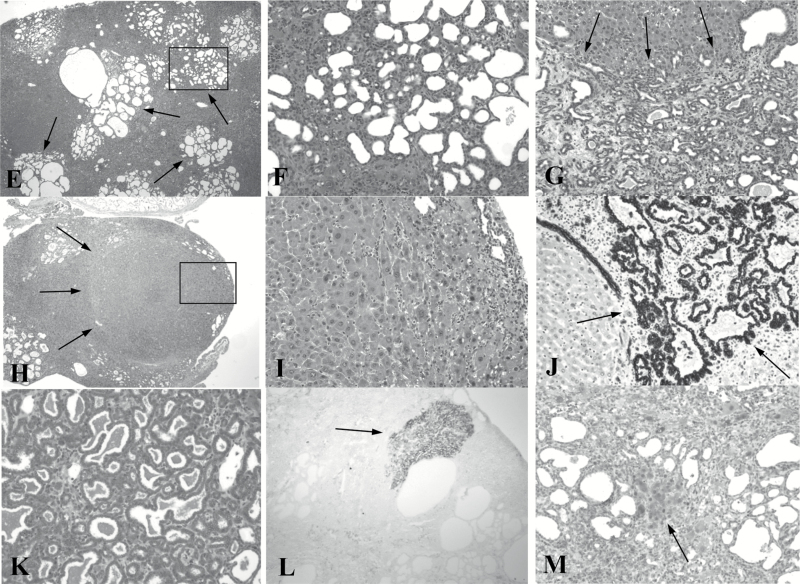
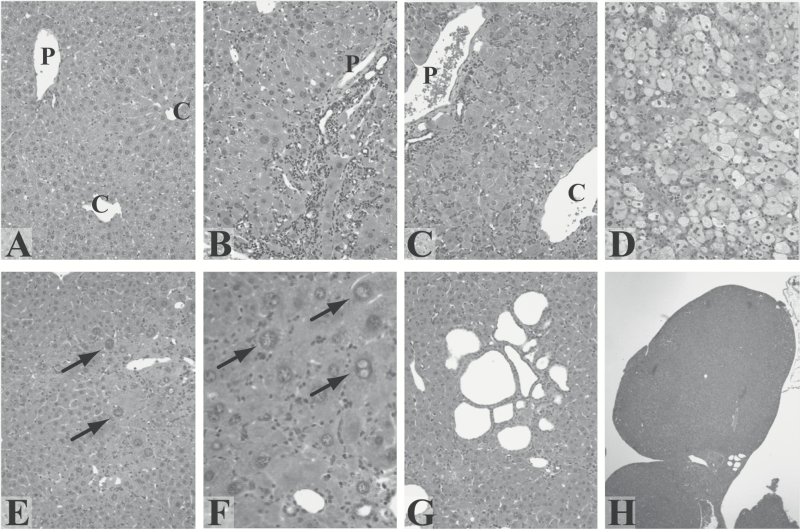
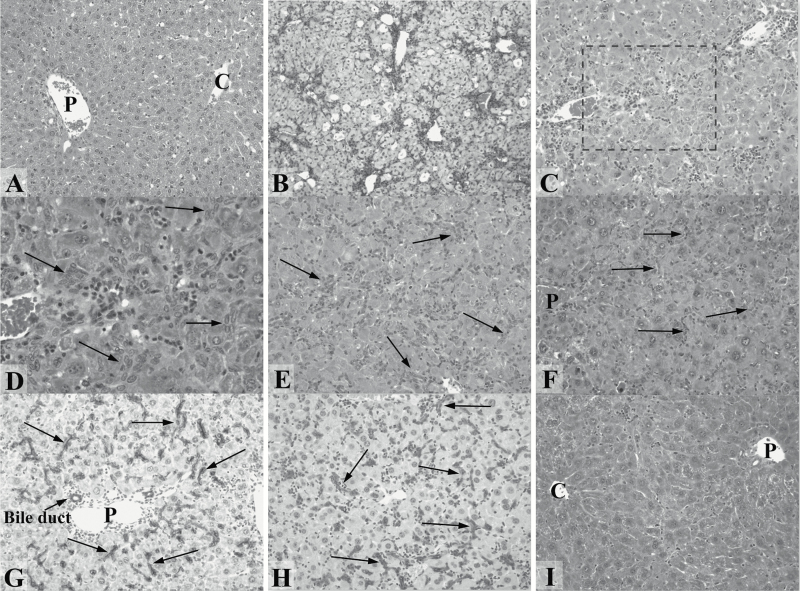
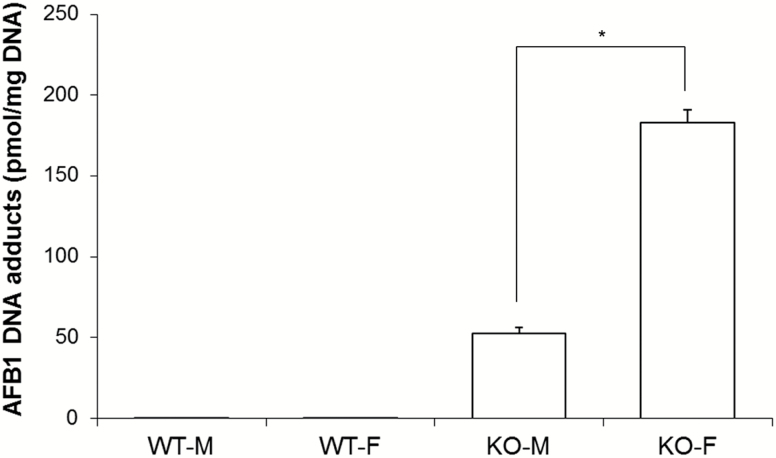
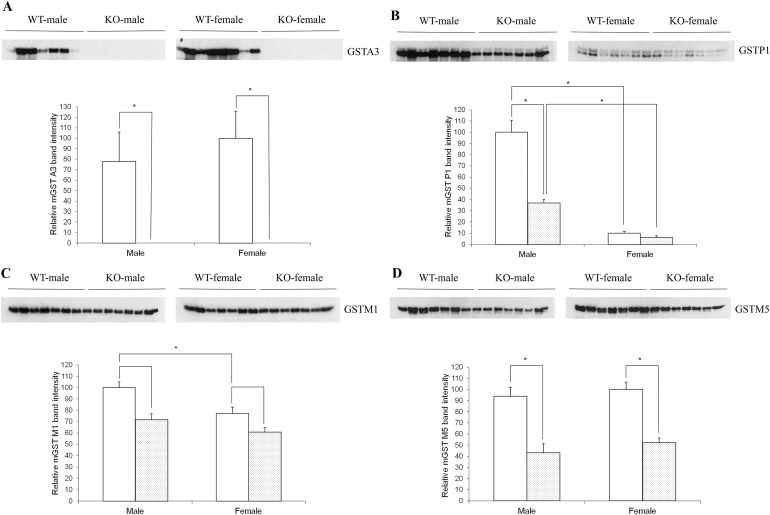
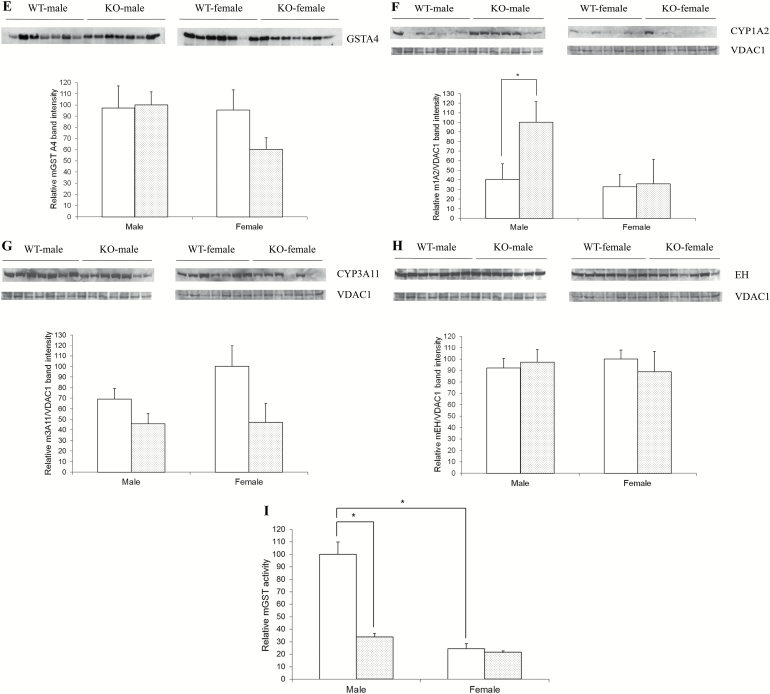
We recently generated glutathione S-transferase (GST) A3 knockout (KO) mice as a novel model to study the risk factors for liver cancer. GSTA3 KO mice are sensitive to the acute cytotoxic and genotoxic effects of aflatoxin B1 (AFB1), confirming the crucial role of GSTA3 in resistance to AFB1. We now report histopathological changes, tumor formation, biochemical changes and gender response following AFB1 treatment as well as the contribution of oxidative stress. Using a protocol of weekly 0.5 mg AFB1/kg administration, we observed extensive oval (liver stem) cell (OC) proliferation within 1-3 weeks followed by microvesicular lipidosis, megahepatocytes, nuclear inclusions, cholangiomas and small nodules. Male and female GSTA3 KO mice treated with 12 and 24 weekly AFB1 injections followed by a rest period of 12 and 6 months, respectively, all had grossly distorted livers with macro- and microscopic cysts, hepatocellular nodules, cholangiomas and cholangiocarcinomas and OC proliferation. We postulate that the prolonged AFB1 treatment leads to inhibition of hepatocyte proliferation, which is compensated by OC proliferation and eventually formation of cholangiocarcinoma (CCA). At low-dose AFB1, male KO mice showed less extensive acute liver injury, OC proliferation and AFB1-DNA adducts than female KO mice. There were no significant compensatory changes in KO mice GST subunits, GST enzymatic activity, epoxide hydrolase, or CYP1A2 and CYP3A11 levels. Finally, there was a modest increase in F2-isoprostane and isofuran in KO mice that confirmed putative GSTA3 hydroperoxidase activity in vivo for the first time.
© The Author 2017. Published by Oxford University Press. All rights reserved. For Permissions, please email: journals.permissions@oup.com.
Figures
Similar articles
-
Participation of liver stem cells in cholangiocarcinogenesis after aflatoxin B1 exposure of glutathione S-transferase A3 knockout mice.Tumour Biol. 2018 May;40(5):1010428318777344. doi: 10.1177/1010428318777344. Tumour Biol. 2018. PMID: 29804515
-
Glutathione-S-transferase A3 knockout mice are sensitive to acute cytotoxic and genotoxic effects of aflatoxin B1.Toxicol Appl Pharmacol. 2010 Feb 1;242(3):241-6. doi: 10.1016/j.taap.2009.10.008. Epub 2009 Oct 20. Toxicol Appl Pharmacol. 2010. PMID: 19850059 Free PMC article.
-
Low hepatic glutathione S-transferase and increased hepatic DNA adduction contribute to increased tumorigenicity of aflatoxin B1 in newborn and partially hepatectomized mice.Toxicol Lett. 2004 Mar 14;148(1-2):1-9. doi: 10.1016/j.toxlet.2003.11.008. Toxicol Lett. 2004. PMID: 15019083
-
Aflatoxin B1 metabolism: Regulation by phase I and II metabolizing enzymes and chemoprotective agents.Mutat Res Rev Mutat Res. 2018 Oct-Dec;778:79-89. doi: 10.1016/j.mrrev.2018.10.002. Epub 2018 Oct 29. Mutat Res Rev Mutat Res. 2018. PMID: 30454686 Review.
-
DNA damage checkpoint response to aflatoxin B1.Environ Toxicol Pharmacol. 2019 Jan;65:90-96. doi: 10.1016/j.etap.2018.12.006. Epub 2018 Dec 7. Environ Toxicol Pharmacol. 2019. PMID: 30594067 Review.
Cited by
-
Nrf2 in liver toxicology.Arch Pharm Res. 2020 Mar;43(3):337-349. doi: 10.1007/s12272-019-01192-3. Epub 2019 Nov 28. Arch Pharm Res. 2020. PMID: 31782059 Free PMC article. Review.
-
GSTA3 regulates TGF-β1-induced renal interstitial fibrosis in NRK-52E cells as a component of the PI3K-Keap1/Nrf2 pathway.J Int Med Res. 2019 Nov;47(11):5787-5801. doi: 10.1177/0300060519876796. Epub 2019 Oct 16. J Int Med Res. 2019. PMID: 31617428 Free PMC article.
-
Five glutathione S-transferase isozymes played crucial role in the detoxification of aflatoxin B1 in chicken liver.J Anim Sci Biotechnol. 2025 Apr 8;16(1):54. doi: 10.1186/s40104-025-01189-7. J Anim Sci Biotechnol. 2025. PMID: 40197593 Free PMC article.
-
Regulatory network identified by pulmonary transcriptome and proteome profiling reveals extensive change of tumor-related genes in microRNA-21 knockout mice.J Cancer Res Clin Oncol. 2022 Aug;148(8):1919-1929. doi: 10.1007/s00432-022-03967-6. Epub 2022 May 5. J Cancer Res Clin Oncol. 2022. PMID: 35511299 Free PMC article.
-
Criteria for preclinical models of cholangiocarcinoma: scientific and medical relevance.Nat Rev Gastroenterol Hepatol. 2023 Jul;20(7):462-480. doi: 10.1038/s41575-022-00739-y. Epub 2023 Feb 8. Nat Rev Gastroenterol Hepatol. 2023. PMID: 36755084 Review.
References
-
- Shupe T., et al. (2004) Low hepatic glutathione S-transferase and increased hepatic DNA adduction contribute to increased tumorigenicity of aflatoxin B1 in newborn and partially hepatectomized mice. Toxicol. Lett., 148, 1–9. - PubMed
-
- Eaton D.L., et al. (1994) Mechanisms of aflatoxin carcinogenesis. Annu. Rev. Pharmacol. Toxicol., 34, 135–172. - PubMed
-
- Egner P.A., et al. (2006) Quantification of aflatoxin-B1-N7-Guanine in human urine by high-performance liquid chromatography and isotope dilution tandem mass spectrometry. Chem. Res. Toxicol., 19, 1191–1195. - PubMed
-
- Hayes J.D., et al. (1994) Cloning of cDNAs from fetal rat liver encoding glutathione S-transferase Yc polypeptides. The Yc2 subunit is expressed in adult rat liver resistant to the hepatocarcinogen aflatoxin B1. J. Biol. Chem., 269, 20707–20717. - PubMed
Publication types
MeSH terms
Substances
Grants and funding
LinkOut - more resources
Full Text Sources
Other Literature Sources
Molecular Biology Databases
Research Materials
Miscellaneous
