. 2017 Aug 15;26(16):3130-3143.
doi: 10.1093/hmg/ddx197.

Altered organization of the intermediate filament cytoskeleton and relocalization of proteostasis modulators in cells lacking the ataxia protein sacsin

Affiliations

Altered organization of the intermediate filament cytoskeleton and relocalization of proteostasis modulators in cells lacking the ataxia protein sacsin

Emma J Duncan et al. Hum Mol Genet. .

Abstract

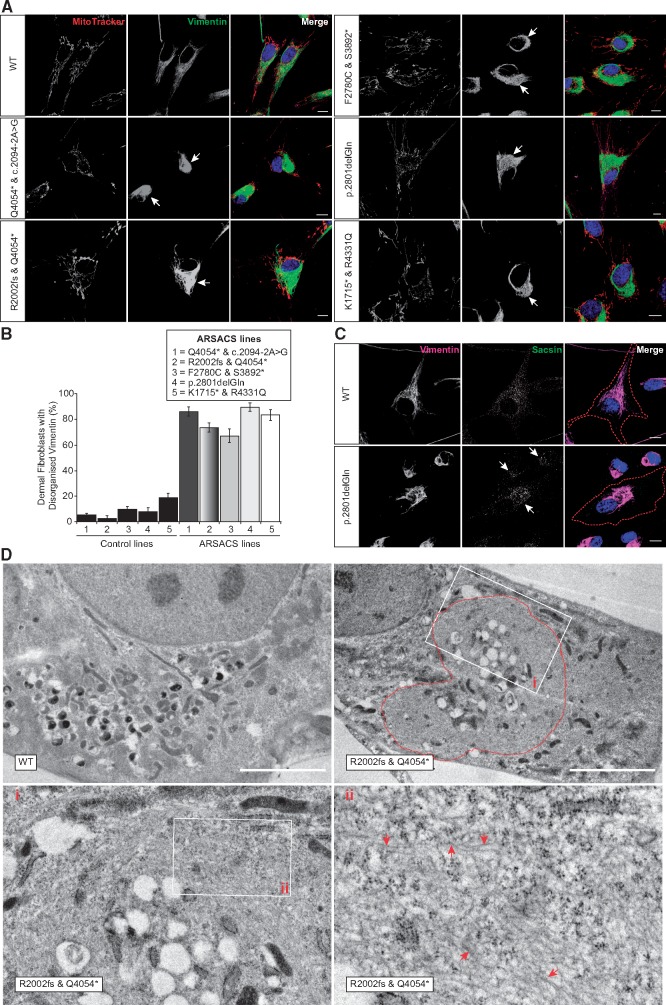
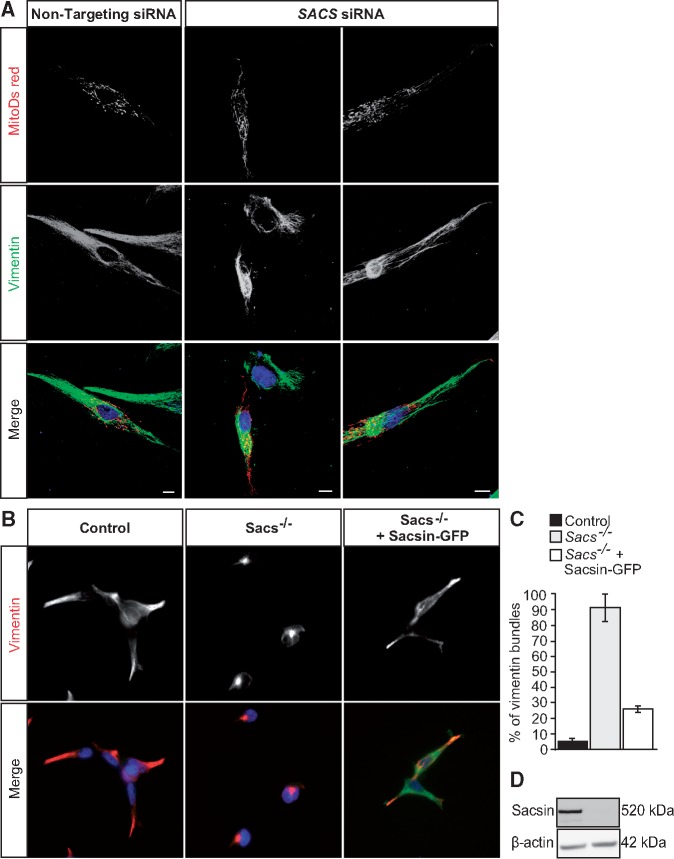
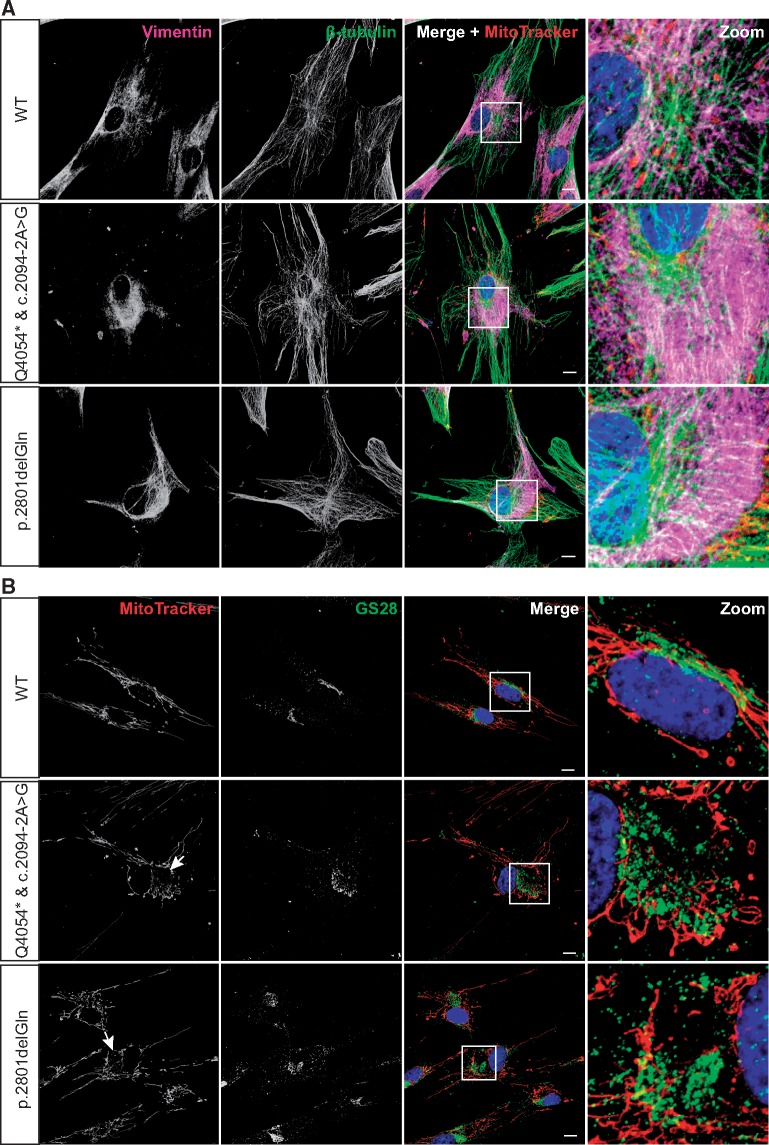
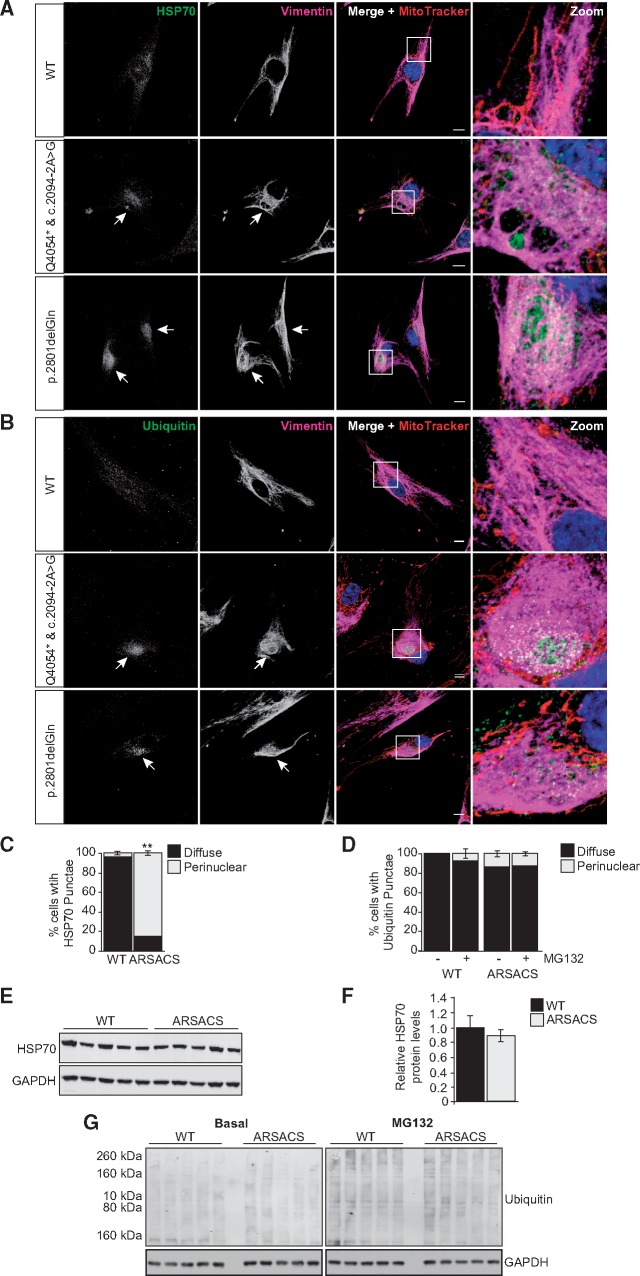
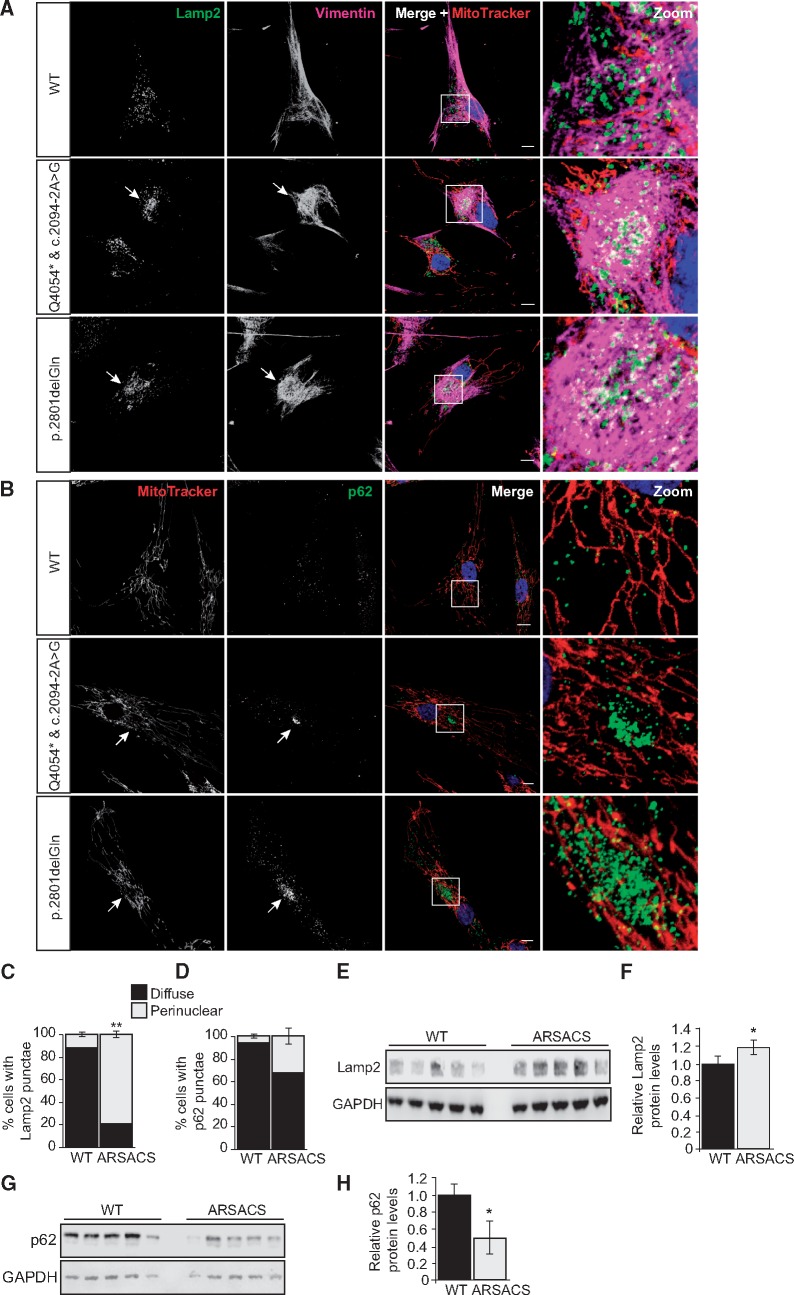
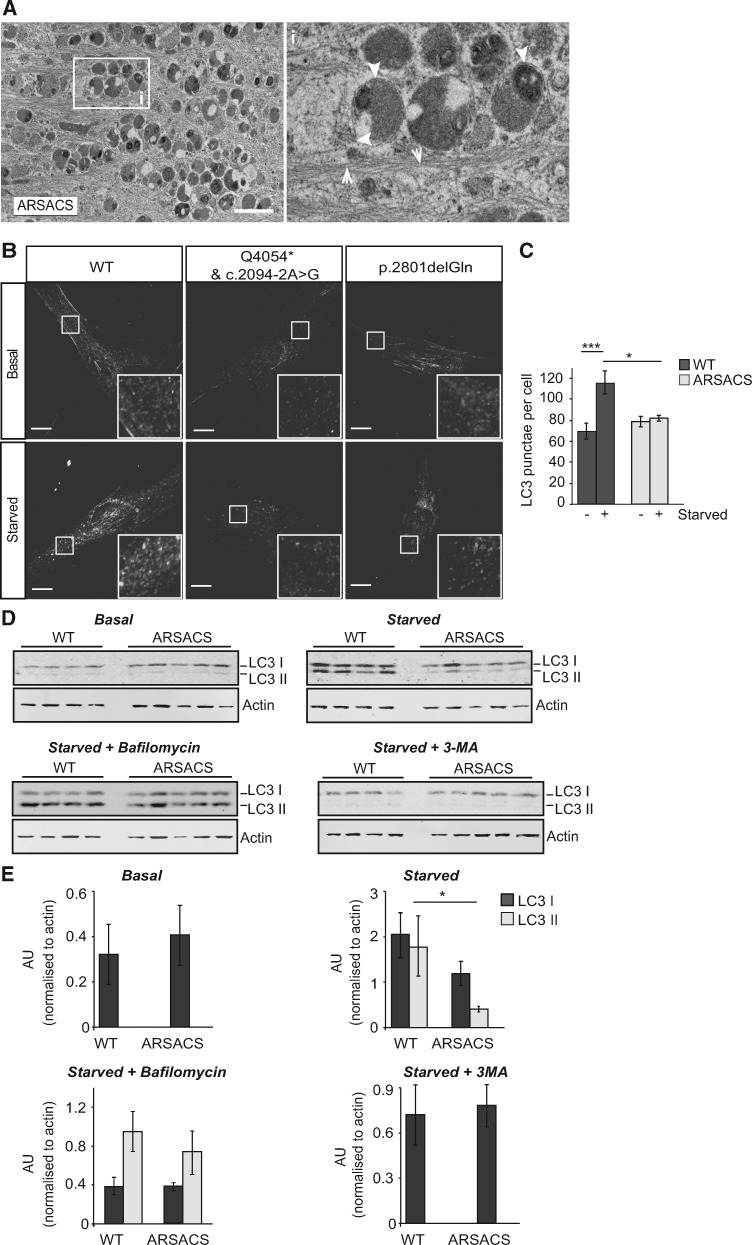
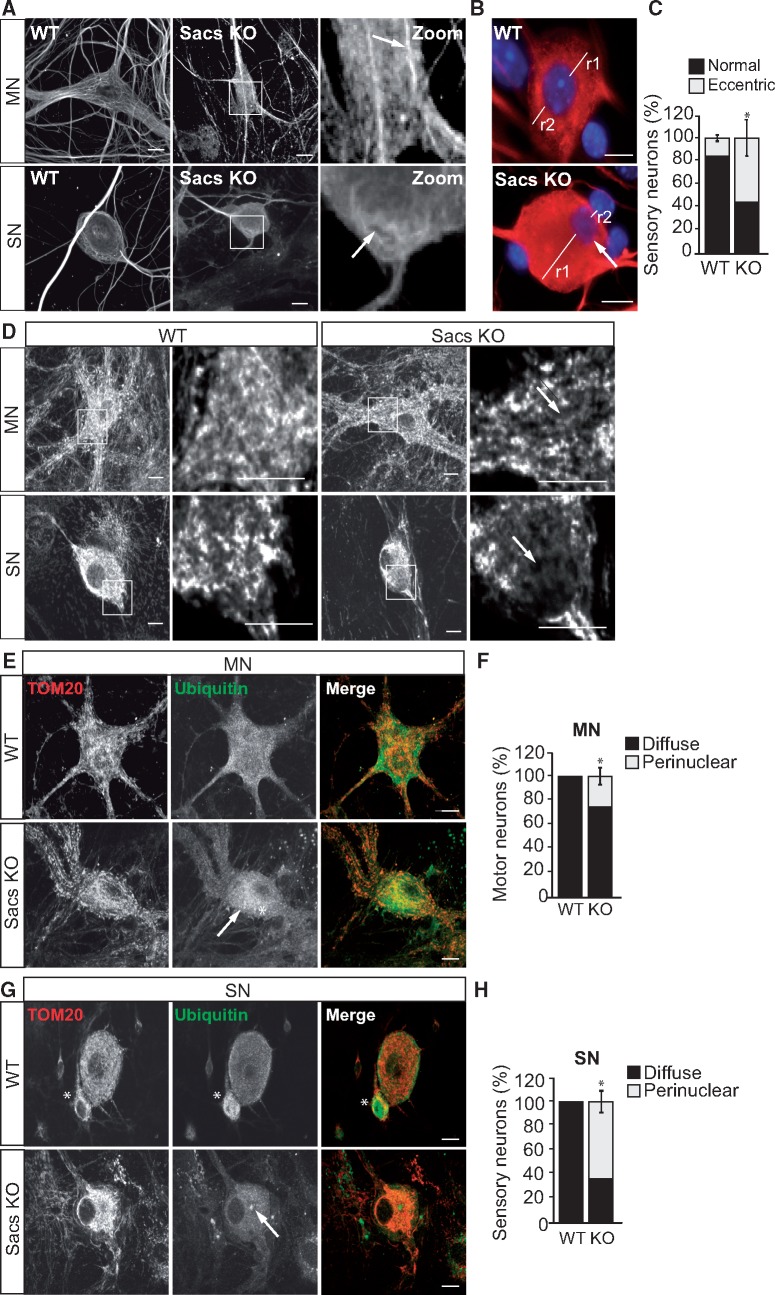
Autosomal Recessive Spastic Ataxia of Charlevoix-Saguenay (ARSACS) is caused by mutations in the gene SACS, encoding the 520 kDa protein sacsin. Although sacsin's physiological role is largely unknown, its sequence domains suggest a molecular chaperone or protein quality control function. Consequences of its loss include neurofilament network abnormalities, specifically accumulation and bundling of perikaryal and dendritic neurofilaments. To investigate if loss of sacsin affects intermediate filaments more generally, the distribution of vimentin was analysed in ARSACS patient fibroblasts and in cells where sacsin expression was reduced. Abnormal perinuclear accumulation of vimentin filaments, which sometimes had a cage-like appearance, occurred in sacsin-deficient cells. Mitochondria and other organelles were displaced to the periphery of vimentin accumulations. Reorganization of the vimentin network occurs in vitro under stress conditions, including when misfolded proteins accumulate. In ARSACS patient fibroblasts HSP70, ubiquitin and the autophagy-lysosome pathway proteins Lamp2 and p62 relocalized to the area of the vimentin accumulation. There was no overall increase in ubiquitinated proteins, suggesting the ubiquitin-proteasome system was not impaired. There was evidence for alterations in the autophagy-lysosome pathway. Specifically, in ARSACS HDFs cellular levels of Lamp2 were elevated while levels of p62, which is degraded in autophagy, were decreased. Moreover, autophagic flux was increased in ARSACS HDFs under starvation conditions. These data show that loss of sacsin effects the organization of intermediate filaments in multiple cell types, which impacts the cellular distribution of other organelles and influences autophagic activity.


Figures

Figure 1
Figure 1
Abnormal accumulations of vimentin intermediate filament in ARSACS patient HDFs. (A) Representative confocal images of five ARSACS patient HDFs and a wild-type (WT) control HDF line (further patient and control lines are shown in Supplementary Material, Fig. S2) that were stained for mitochondria (MitoTracker) and immunolabelled for vimentin. Cells were also stained with DAPI to detect nuclei. Arrows indicate areas of abnormal perinuclear vimentin accumulation. Scale bars = 10 μm. (B) The percentage of cells with a collapsed vimentin network was then quantified for each cell line. This was done blind to experimental status with >120 cells scored per cell line. Results are expressed as mean±SEM for each control and patient cell line. (C) Representative confocal images of HDFs from a homozygous ARSACS patient with the mutation p.2801delQ and a wild-type control line. HDFs were processed for immunofluorescent detection of sacsin and vimentin, and were counterstained with DAPI for nuclei. Localization of sacsin to the area of perinuclear vimentin accumulation is indicated by an arrow. Red dotted line indicates the edge of the cell. Scale bars = 10 μm. (D) Representative TEM of a HDF cell from a wild-type control and ARSACS patient (p.R2002fs & p.Q4054*). Boxes delineated by white lines indicate position of zoomed images shown in panels I and II. Red dotted line indicates the approximate boundary of the area of accumulation of filamentous material. Examples of filaments are indicated with arrows. Scale bar = 5 μm.
Figure 2
Figure 2
Abnormal accumulations of vimentin intermediate filament in sacsin knockdown cells. (A) Representative confocal images of wild-type HDFs cotransfected with mitoDSRed and either a non-targeting siRNA or siRNA targeting sacsin (SACS). 48 h after transfection, cells were processed for immunofluorescent detection of vimentin and counterstained with DAPI for nuclei. Scale bars = 10 µm. (B) Representative confocal images of CRISPR generated SACS−/− HEK293 cells and SACS−/− HEK293 transfected with a plasmid for expression of full-length sacsin-GFP. Cells were processed for immunofluorescent detection of vimentin and counterstained with DAPI. (C) The percentage of cells with a collapsed vimentin network was then quantified for each condition. This was done blind to experimental status with >45 cells scored per condition. Results are expressed as mean ± SEM. (D) Sacsin immunoblot of total lysates from control and SACS−/− HEK293 cells. β-actin was used as a loading control.
Figure 3
Figure 3
ARSACS HDFs show characteristics of aggresome formations, including accumulation of vimentin around the MTOC and Golgi fragmentation. (A,B) Representative confocal images of two ARSACS patient HDFs lines (heterozygous mutations c.2094-2A > G/Q4054* and the homozygous mutation p.2801delQ) and a WT control (further patient and control lines are shown in Supplementary Material, Fig. S3). Cell were stained with MitoTracker before being processed for immunofluorescent detection of (A) vimentin and β-tubulin, or (B) GS28, a membrane protein of the cis-Golgi. Cells were counterstained with DAPI for nuclei. White boxes are shown as zoomed images in the right-hand panels. Arrows indicate areas of mitochondrial network disruption. Scale bars = 10 μm.
Figure 4
Figure 4
Components of the cellular proteostasis machinery localise to the vimentin cage that forms in ARSACS patient HDFs. (A,B) Representative confocal images of two ARSACS patient HDFs lines (heterozygous mutations c.2094-2A > G/p.Q4054* and the homozygous mutation p.2801delQ) and a WT control (further patient and control lines are shown in Supplementary Material, Fig. S4). Cells were immunolabelled for (A) HSP70 and vimentin, or (B) ubiquitin and vimentin, as well as mitochondria (MitoTracker) and nuclei (DAPI). White arrows indicate perinuclear accumulation of HSP70 or ubiquitin. White boxes in merged panels are shown zoomed. Scale bars = 10 μm. (C,D) The incidence of cells with perinulear localization of (C) HSP70 or (D) ubiquitin was quantified. For ubiquitin, quantification was performed in cells cultured under control conditions (vehicle only) or treated with the proteasome inhibitor MG132 for 3 h. Results are expressed as mean ± SEM. (E) Immunoblot analysis of total cell lysates from five ARSACS patient and five WT control HDFs probed with an anti-HSP70 antibody. GAPDH was used as a loading control. (F) Densitometric analyses were performed and mean relative HSP70 protein levels calculated for the five WT and five patient cell lines. Data were normalized to GAPDH. (G) Immunoblot analysis of total cell lysates from five ARSACS patient and five WT control HDFs cultured for 3 h in the presence of MG132 or vehicle only control, probed with an anti-ubiquitin antibody. GAPDH was used as a loading control.
Figure 5
Figure 5
Components of the autophagy–lysosome pathway localise to the vimentin cage that forms in ARSACS patient HDFs. (A,B) Representative confocal images of two ARSACS patient HDFs lines (heterozygous mutations c.2094-2A > G/p.Q4054* and the homozygous mutation p.2801delQ) and a WT control (further patient and control lines are shown in Supplementary Material, Fig. S5). Cells were stained for mitochondria (MitoTracker) and then immunolabelled for (A) LAMP-2 (lysosome-associated membrane protein 2) and vimentin, or (B) p62/SQSTM1. Cells were also stained with DAPI to detect nuclei. White boxes in the merged panels are shown zoomed in the right-hand panels. Arrows indicate areas of LAMP-2 or p62 accumulation. Scale bars = 10 μm. (C,D) The incidence of cells with perinulear localization of (C) Lamp2 or (D) p62 was quantified. (E,F) Immunoblot of total cell lysates from five ARSACS patient and five WT control HDFs probed with an anti-Lamp2 antibody and subsequent densitometric analyses. (G,H) Immunoblot of total cell lysates from five ARSACS patient and five WT control HDFs probed with an anti-p62 antibody and subsequent densitometric analyses. Data were normalised to GAPDH.
Figure 6
Figure 6
Autopahgic Flux is increased in ARSACS patient HDFs upon nutrient starvation. (A) Representative EM image of autophagosomes (arrowheads) in the area of intermediate filament (arrows) accumulation in an ARSACS HDF. Scale bar = 1 μm. (B) Representative confocal images of two ARSACS patient HDFs lines (heterozygous mutations c.2094-2A>G/p.Q4054* and the homozygous mutation p.2801delQ) and a WT control immunolabelled for endogenous LC3. Scale bar = 10 μm. (C) Quantification of the number of LC3 puncta in ARSACS and control HDF lines under basal conditions and after induction of autophagy by nutrient starvation. Puncta were quantified in 12 cells per line/treatment. Results from five control and five patient cell lines were combined to give an overall mean±SEM, ***P<0.001. (D) Immunoblot analysis of total cell lysates from ARSACS patient and WT control HDFs probed with an LC3 antibody to detect LC3-I and LC3-II. Cell lysates were collected from untreated cells, nutrient starved cells, and cells that were nutrient starved and treated with either bafilomycin A or 3-Methyladenine (3-MA). Actin was used as a loading control. (E) Densitometric analyses were performed and mean LC3-I and LC3-II levels relative to actin were calculated for each treatment in control and ARSACS HDFs (n= 4).
Figure 7
Figure 7
Primary neurons from the Sacs−/− mouse have abnormal neurofilament organization, altered cellular architecture and abnormal ubiquitin localization. (A) Representative maximum intensity projections of confocal Z-stacks of primary neurons from 4-week-old dorsal root ganglia and spinal cord culture. Motor (MN) and sensory neurons (SN) from Sacs−/− (Sacs KO) or WT mice were immunolabelled for NFH. Arrows indicate bundled NFH intermediate filaments. (B) Nuclear positioning in DRG sensory neurons revealed by DAPI (blue) staining for the nucleus and immunostaining for tubulin (red) to identify the soma in the Sacs−/− sensory neuron. (C) Quantification of the percentage of sensory neuron with eccentric nuclear localization. Eccentric localization of nucleus was determined by the ratio of r1:r2, where r1 is the longest and r2 is the shortest distance between the nuclear membrane and the closest plasma membrane. Cells where r1/r2 was ≥1.1 (≥10% deviation from a centrally positioned nucleus) were scored as having an eccentric nuclear localization (D) Representative confocal images of motor (MN) and sensory neurons (SN) from Sacs−/− (Sacs KO) or WT mice were immunolabelled for Tom20. Arrows indicate areas where mitochondria were absent. (E) Representative confocal images of motor neurons from Sacs−/− (Sacs KO) or WT mice immunolabelled for ubiquitin. (F) Quantification of the number of motor neurons (MN) showing a perinuclear localization of ubiquitin. (G) Representative confocal images of sensory neurons from Sacs−/− (Sacs KO) or WT mice immunolabelled for ubiquitin. (HG Quantification of the number of sensory neurons (SN) showing a perinuclear localization of ubiquitin. Arrows show areas of ubiquitin accumulation. A white asterisk indicates the location of a glial cell. Scale bars =10 µm. Error bars are ±SD, *P < 0.05. N= between 30 and 70 neurons per experiment.

Similar articles

Cited by

References

    1. Bouhlal Y., Amouri R., El Euch-Fayeche G., Hentati F. (2011) Autosomal recessive spastic ataxia of Charlevoix-Saguenay: an overview. Parkinsonism Relat. Disord., 17, 418–422. - PubMed
    1. Girard M., Lariviere R., Parfitt D.A., Deane E.C., Gaudet R., Nossova N., Blondeau F., Prenosil G., Vermeulen E.G., Duchen M.R.. et al. (2012) Mitochondrial dysfunction and Purkinje cell loss in autosomal recessive spastic ataxia of Charlevoix-Saguenay (ARSACS). Proc. Natl Acad. Sci. U. S. A., 109, 1661–1666. - PMC - PubMed
    1. Engert J.C., Berube P., Mercier J., Dore C., Lepage P., Ge B., Bouchard J.P., Mathieu J., Melancon S.B., Schalling M.. et al. (2000) ARSACS, a spastic ataxia common in northeastern Quebec, is caused by mutations in a new gene encoding an 11.5-kb ORF. NatGenet, 24, 120–125. - PubMed
    1. Parfitt D.A., Michael G.J., Vermeulen E.G., Prodromou N.V., Webb T.R., Gallo J.M., Cheetham M.E., Nicoll W.S., Blatch G.L., Chapple J.P. (2009) The ataxia protein sacsin is a functional co-chaperone that protects against polyglutamine-expanded ataxin-1. HumMolGenet, 18, 1556–1565. - PMC - PubMed
    1. Anderson J.F., Siller E., Barral J.M. (2010) The sacsin repeating region (SRR): a novel Hsp90-related supra-domain associated with neurodegeneration. J. Mol. Biol., 400, 665–674. - PubMed

Publication types

MeSH terms

Supplementary concepts