. 2018 Nov 27;19(6):1115-1129.
doi: 10.1093/bib/bbx043.

Bioinformatic analysis of bacteria and host cell dual RNA-sequencing experiments

Affiliations

Bioinformatic analysis of bacteria and host cell dual RNA-sequencing experiments

James W Marsh et al. Brief Bioinform. .

Abstract

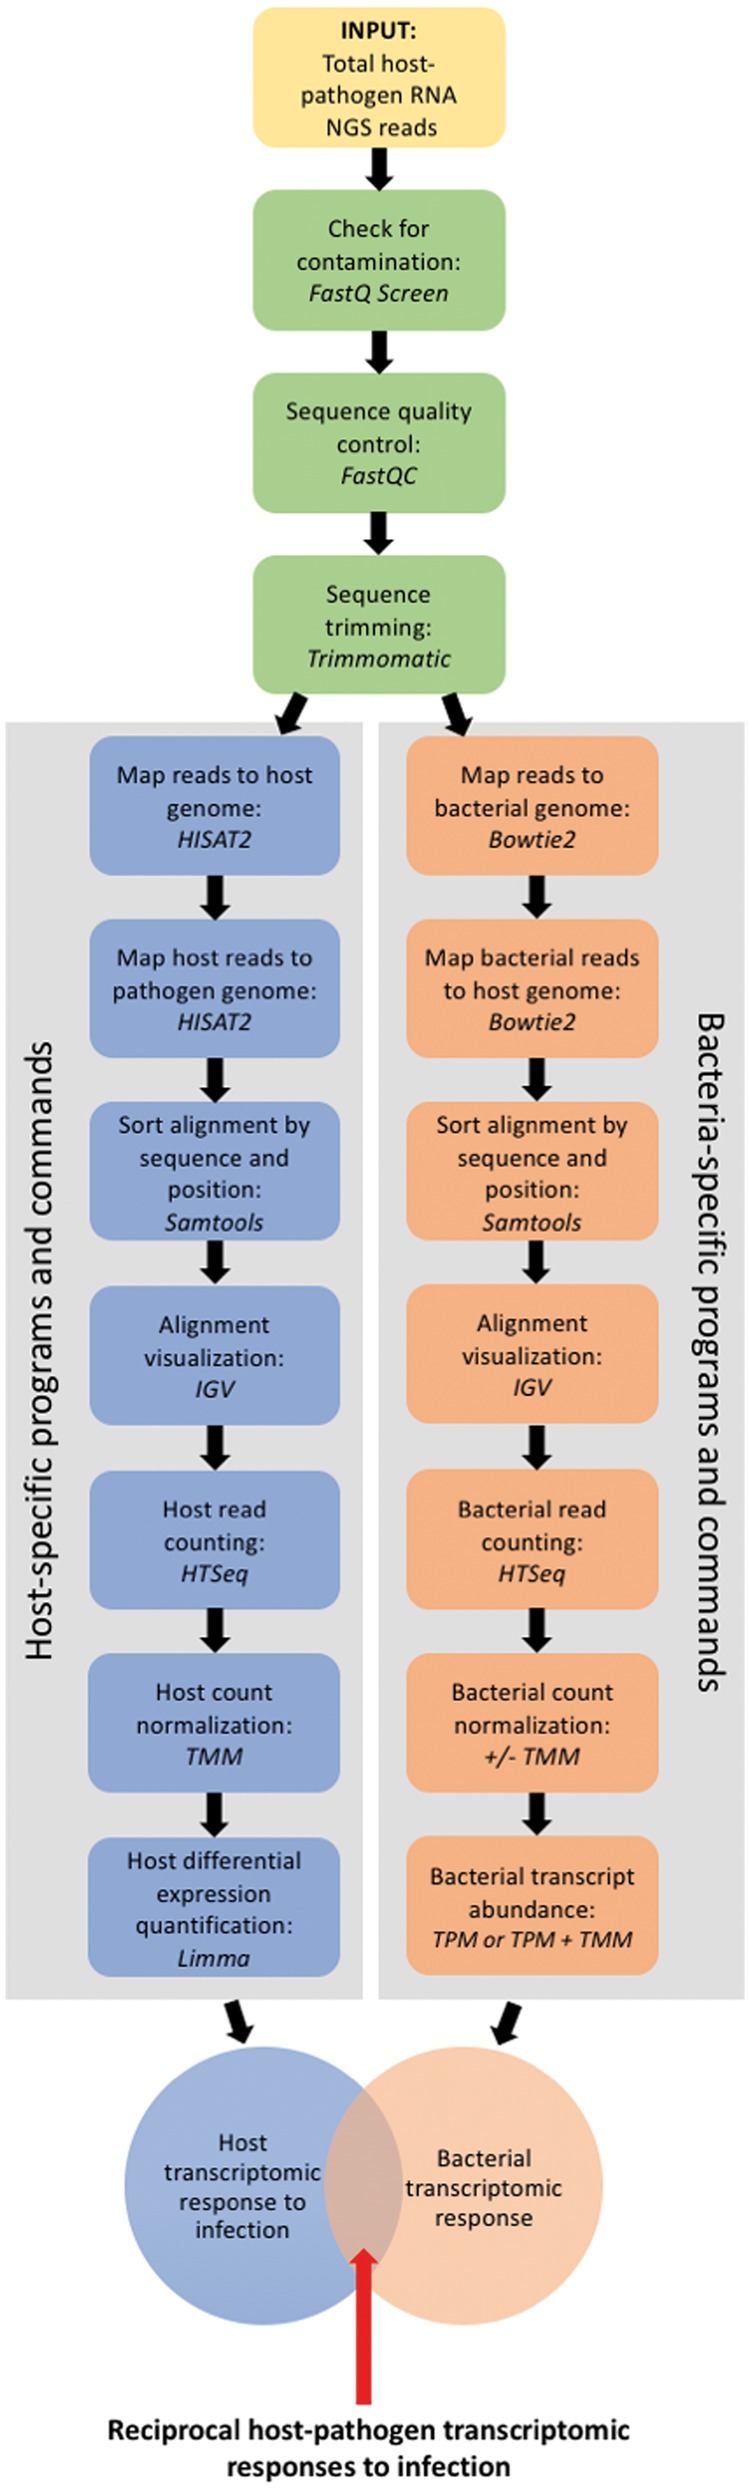
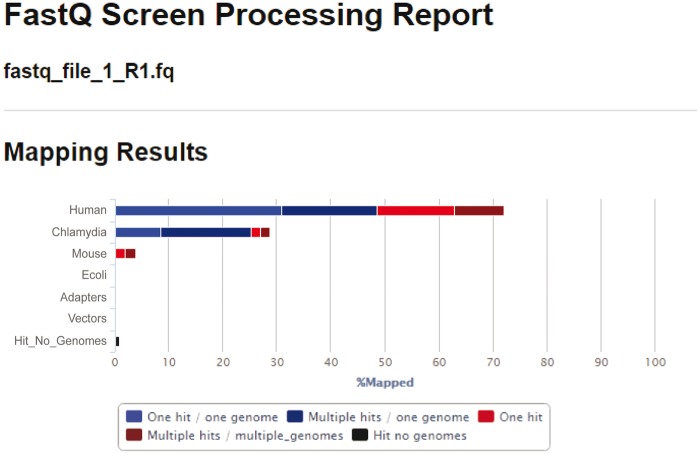
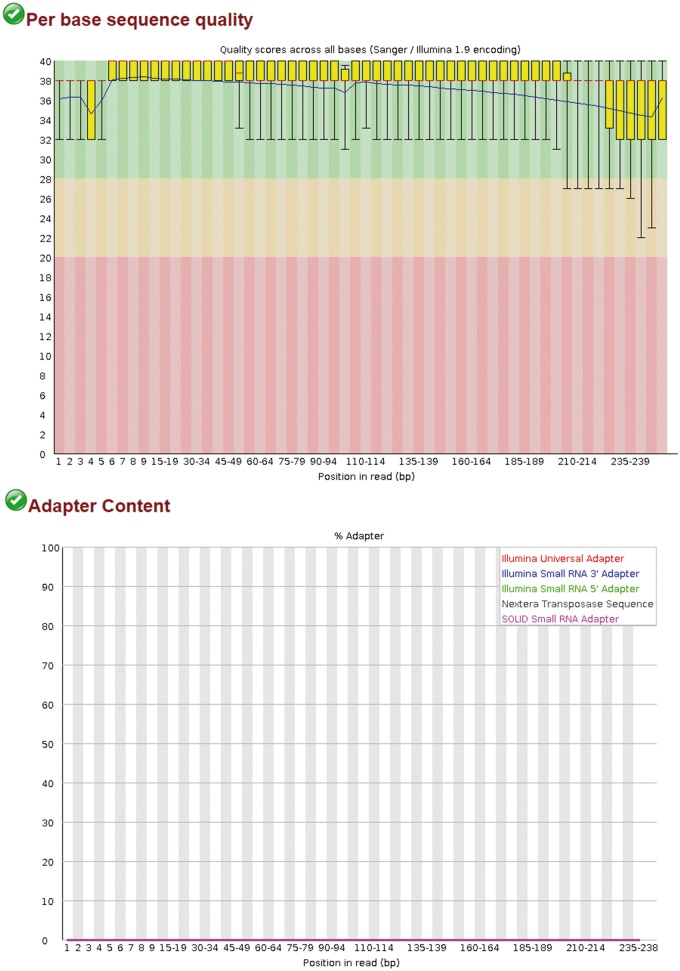
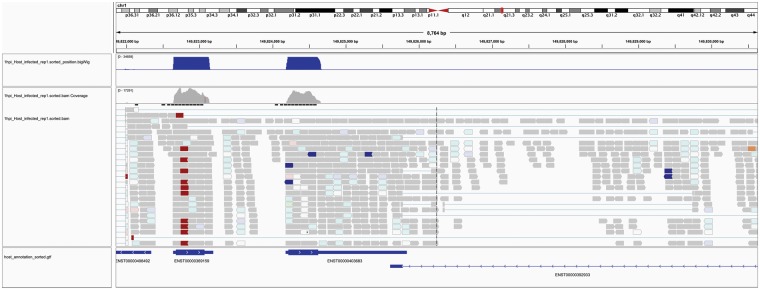
Bacterial pathogens subvert host cells by manipulating cellular pathways for survival and replication; in turn, host cells respond to the invading pathogen through cascading changes in gene expression. Deciphering these complex temporal and spatial dynamics to identify novel bacterial virulence factors or host response pathways is crucial for improved diagnostics and therapeutics. Dual RNA sequencing (dRNA-Seq) has recently been developed to simultaneously capture host and bacterial transcriptomes from an infected cell. This approach builds on the high sensitivity and resolution of RNA sequencing technology and is applicable to any bacteria that interact with eukaryotic cells, encompassing parasitic, commensal or mutualistic lifestyles. Several laboratory protocols have been presented that outline the collection, extraction and sequencing of total RNA for dRNA-Seq experiments, but there is relatively little guidance available for the detailed bioinformatic analyses required. This protocol outlines a typical dRNA-Seq experiment, based on a Chlamydia trachomatis-infected host cell, with a detailed description of the necessary bioinformatic analyses with currently available software tools.


Figures

Figure 1
Figure 1
Flow chart for the bioinformatic data analysis of dRNA-Seq of host and bacteria.
Figure 2
Figure 2
FASTQ Screen processing report of raw host and bacteria FASTQ sequencing reads. As expected, the majority of reads map to the human genome (70%), while 30% of the reads map to the Chlamydia genome.
Figure 3
Figure 3
FASTQC report for per base sequence quality and adapter content. (A). Sequence quality before removal of adapters with Trimmomatic. (B). Sequence quality after removal of adapters with Trimmomatic.
Figure 4
Figure 4
Screen shot of IGV showing host mapped reads the associated GTF annotation file. The first bar labeled ‘chr1’ indicates which portion of the human genome (or chromosome) is displayed, with the length (8764 bp) and specific genomic region shown underneath. The graphs indicate read coverage, and the sequence alignment tracks are shown below this. The bottom row is the GTF annotation file indicating, which annotated transcripts the reads are aligning to.
Figure 5
Figure 5
The count matrix. Following read quantification with HTSeq, the count files are combined to form the matrix of raw counts for each sample and replicate in the data set.
Figure 6
Figure 6
MDS plot. This is a two-dimensional plot that visualizes the similarity between samples and replicates across conditions. It enables the identification of problematic samples that may obscure the subsequent statistical analysis. In this case, all replicates cluster together as expected.
Figure 7
Figure 7
Hierarchical clustering dendrogram. An extension of the MDS plot, the hierarchical clustering dendrogram illustrates sample similarity. As expected, all replicates for each condition cluster together.
Figure 8
Figure 8
Limma voom plots. The mean–variance trend plot displays the gene-wise square-root residual SDs plotted against average log count, with the LOWESS fit represented by the red line. The sample-specific weights are the result of the ‘voomWithQualityWeights’ function and represents the sample-specific quality weights that can be applied to down-weight outlier samples.

References

    1. Humphrys MS, Creasy T, Sun Y, et al.Simultaneous transcriptional profiling of bacteria and their host cells. PLoS One 2013;8:e80597.. - PMC - PubMed
    1. Oosthuizen JL, Gomez P, Ruan J, et al.Dual organism transcriptomics of airway epithelial cells interacting with conidia of Aspergillus fumigatus. PLoS One 2011;6:e20527. - PMC - PubMed
    1. Lister R, O'Malley RC, Tonti-Filippini J, et al.Highly integrated single-base resolution maps of the epigenome in Arabidopsis. Cell 2008;133:523–36. - PMC - PubMed
    1. Westermann AJ, Gorski SA, Vogel J.. Dual RNA-seq of pathogen and host. Nature 2012;10:618–30. - PubMed
    1. Anders S, McCarthy DJ, Chen Y, et al.Count-based differential expression analysis of RNA sequencing data using R and Bioconductor. Nat Protoc 2013;8:1765–86. - PubMed

Publication types

MeSH terms