. 2017 Sep 15;33(18):2914-2923.
doi: 10.1093/bioinformatics/btx334.

MetaSRA: normalized human sample-specific metadata for the Sequence Read Archive

Affiliations

MetaSRA: normalized human sample-specific metadata for the Sequence Read Archive

Matthew N Bernstein et al. Bioinformatics. .

Abstract

Motivation: The NCBI's Sequence Read Archive (SRA) promises great biological insight if one could analyze the data in the aggregate; however, the data remain largely underutilized, in part, due to the poor structure of the metadata associated with each sample. The rules governing submissions to the SRA do not dictate a standardized set of terms that should be used to describe the biological samples from which the sequencing data are derived. As a result, the metadata include many synonyms, spelling variants and references to outside sources of information. Furthermore, manual annotation of the data remains intractable due to the large number of samples in the archive. For these reasons, it has been difficult to perform large-scale analyses that study the relationships between biomolecular processes and phenotype across diverse diseases, tissues and cell types present in the SRA.

Results: We present MetaSRA, a database of normalized SRA human sample-specific metadata following a schema inspired by the metadata organization of the ENCODE project. This schema involves mapping samples to terms in biomedical ontologies, labeling each sample with a sample-type category, and extracting real-valued properties. We automated these tasks via a novel computational pipeline.

Availability and implementation: The MetaSRA is available at metasra.biostat.wisc.edu via both a searchable web interface and bulk downloads. Software implementing our computational pipeline is available at http://github.com/deweylab/metasra-pipeline.

Contact: cdewey@biostat.wisc.edu.

Supplementary information: Supplementary data are available at Bioinformatics online.


Figures

Fig. 1.
Fig. 1.
Overview of the dataset. (A) Sample-specific key-value pairs describing sample SRS1217219. Note that the values encode natural language text. (B) Sample-specific key-value pairs describing sample SRS872370. Note the reference to an external cell line BJ. We also note that ‘forskin fibroblast’ is an incorrect spelling. Lastly, the value ‘no’ negates the key ‘lentiviral transgenes.’ (C) Histogram of the number of samples per study for human RNA-seq experiments using the Illumina platform. We assert that the 88 studies each with at least 100 samples can be semi-manually normalized using study-specific methods
Fig. 2.
Fig. 2.
An example of the metadata normalization process for sample ERS183215. We extract explicit mappings, consequent mappings, real-value properties and the sample-type category for each set of sample-specific key-value pairs in the SRA
Fig. 3.
Fig. 3.
A subgraph of the TRG constructed from sample SRS1212219 illustrating the graph data structure that our pipeline maintains as it reasons about the sample. This framework allows us to maintain the context of each artifact. For example, we map to the MRC5 cell line only because there is a mapping to the ‘cell line’ ontology term in the graph emanating from the key. We also note the terms for ‘lung’, ‘male organism’ and ‘Caucasian’ were mapped to the MRC5 cell line from the ATCC cell bank data and are thus consequent mappings
Fig. 4.
Fig. 4.
(A) A schematic of an ontology subgraph demonstrating our calculation of recall, specific terms recall, error rate and specific terms error rate. (B) Performance of our pipeline in mapping explicit ontology terms versus BioPortal’s Annotator, ZOOMA and SORTA. We ran SORTA using the three confidence thresholds of 1.0, 0.5 and 0.0. We also ran ZOOMA using the three confidence thresholds of high, good and low. We measured recall, error rate, specific terms recall and specific terms error rate for all programs across all ontologies with the exceptions that ZOOMA only maps to three of the ontologies and only MetaSRA and SORTA map to the Cellosaurus. (C) The error rate, specific terms error rate, average retrieved terms per sample and average specific retrieved terms per sample across all ontologies when considering only consequently mapped terms. No terms from the Cellosaurus were consequently mapped and thus this ontology is omitted. (D) Recall, error rate, specific terms recall and specific terms error rate for versions of our pipeline in which certain stages are disabled. The data points labelled ‘none’ refer to the complete pipeline in which no stage is disabled
Fig. 5.
Fig. 5.
(A) Row-normalized confusion matrix for sample-type category prediction accuracy on the initial test dataset. Element i, j is the fraction of samples in category i that were labelled as category j by the classifier. The diagonal elements are category-specific recall values. The number of samples in each category are shown above the matrix. (B) Transpose of the column-normalized confusion matrix for sample-type category on the enriched test dataset. Element i, j represents the fraction of samples labelled as category i that are truly category j. The diagonal elements are category-specific precision values. The number of samples predicted to be in each category are shown above the matrix. (C) Calibration of the model. The estimated probability of the model (average of confidence values in each bin) is plotted against the empirical probability that the model is correct (accuracy of predictions in each bin). The straight blue-line plots a well-calibrated model. Error bars are drawn according to a bootstrap sampling approach (Bröcker and Smith, 2007). Points are omitted for bins that contain no predictions. This plot was created from the initial dataset of 422 samples
Fig. 6.
Fig. 6.
(A) The number of terms from each ontology that map to a given range of number of samples. Only the most-specifically mapped terms for each sample are considered. (B) Fraction of samples of each predicted sample-type that map to each ontology. The bar plot to the right of the strip-plot shows the number of each predicted sample-type. (C) The most commonly mapped terms for each ontology. Only the most-specifically mapped terms for each sample are considered

Similar articles

Cited by

References

    1. Bard J. et al. (2005) An ontology for cell types. Genome Biol., 6, R21. - PMC - PubMed
    1. Barrett T. et al. (2012) BioProject and BioSample databases at NCBI: facilitating capture and organization of metadata. Nucleic Acids Res., 40, D57–D63. - PMC - PubMed
    1. Barrett T. et al. (2013) NCBI GEO: archive for functional genomics data sets—update. Nucleic Acids Res., 41, D991–D995. - PMC - PubMed
    1. Bartolini I. et al. (2002). String matching with metric trees using an approximate distance In: Proceedings of the 9th International Symposium on String Processing and Information Retrieval, SPIRE 2002, Springer-Verlag, London, UK, pp. 271–283.
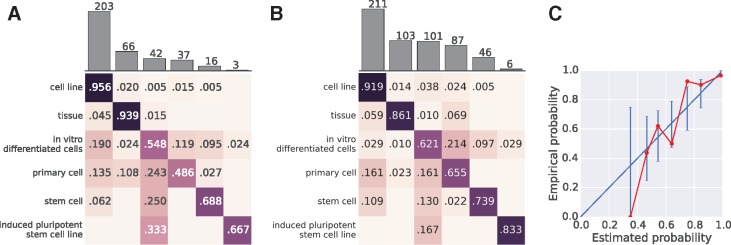
    1. Bröcker J., Smith L. (2007) Increasing the reliability of reliability diagrams. Weather Forecasting, 22, 651–661.