. 2017 May 22;41(4):366-381.e4.
doi: 10.1016/j.devcel.2017.04.014.

A Brain-Region-Specific Neural Pathway Regulating Germinal Matrix Angiogenesis

Affiliations

A Brain-Region-Specific Neural Pathway Regulating Germinal Matrix Angiogenesis

Shang Ma et al. Dev Cell. .

Abstract

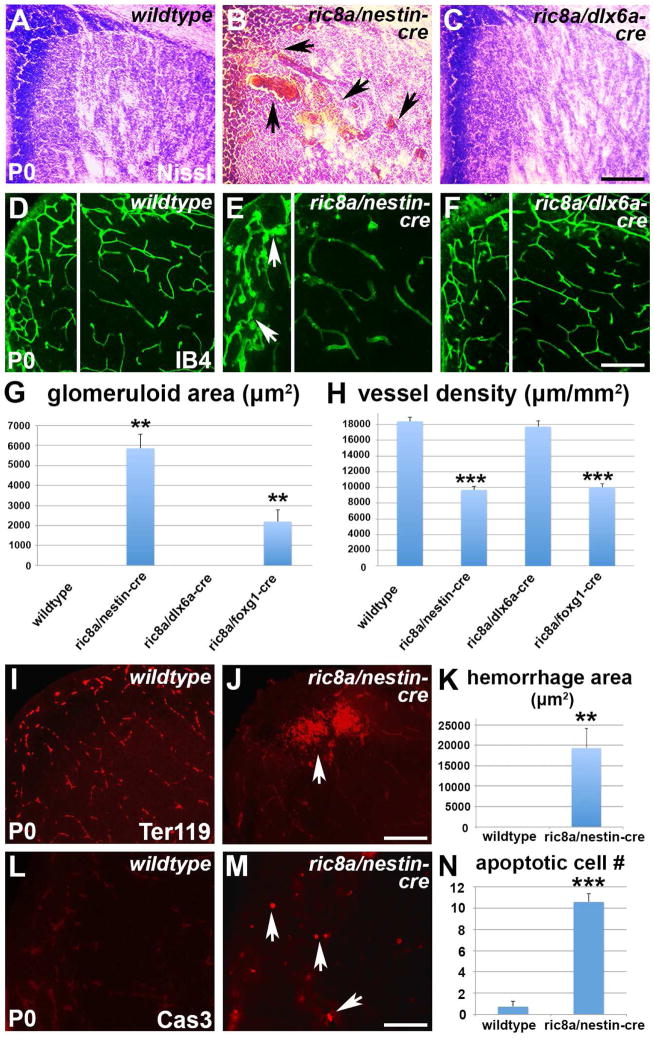
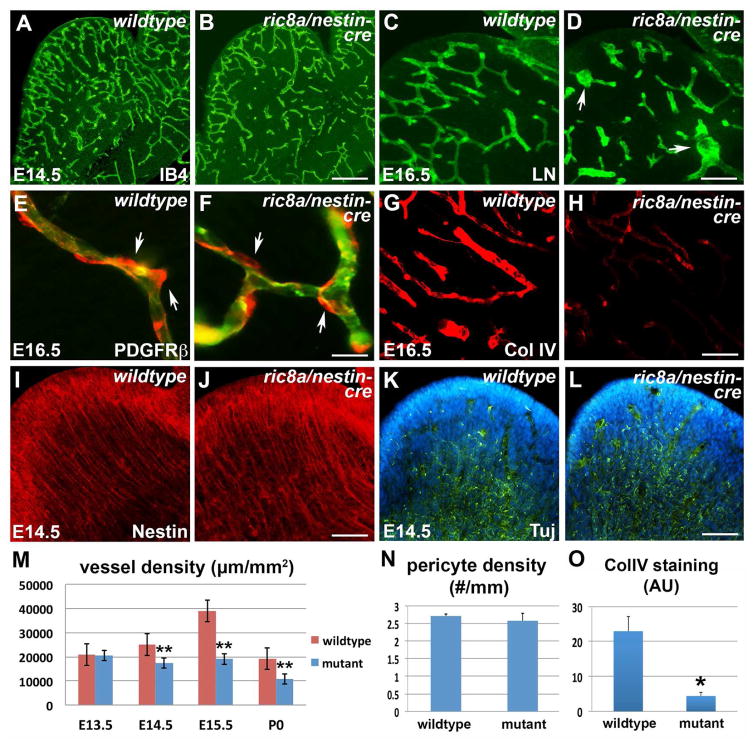
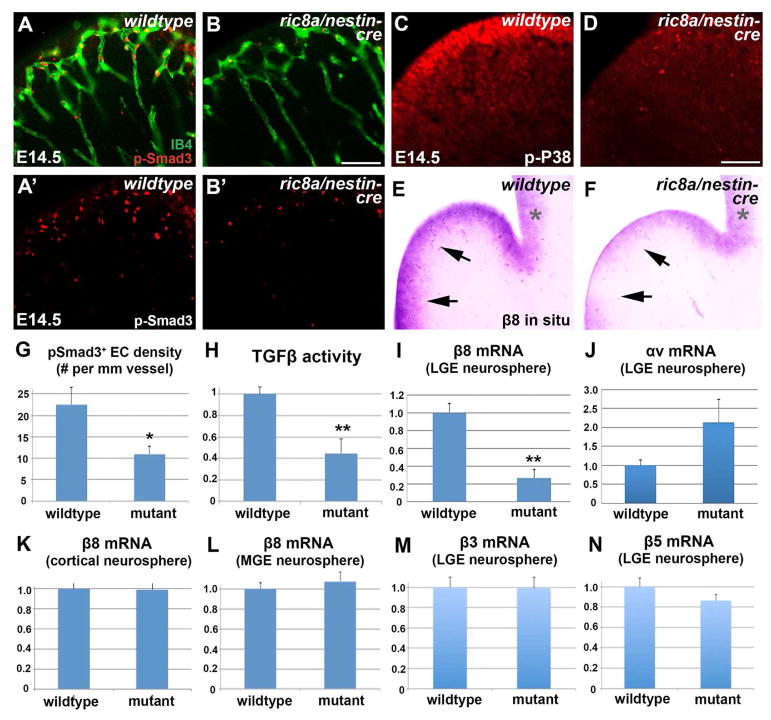
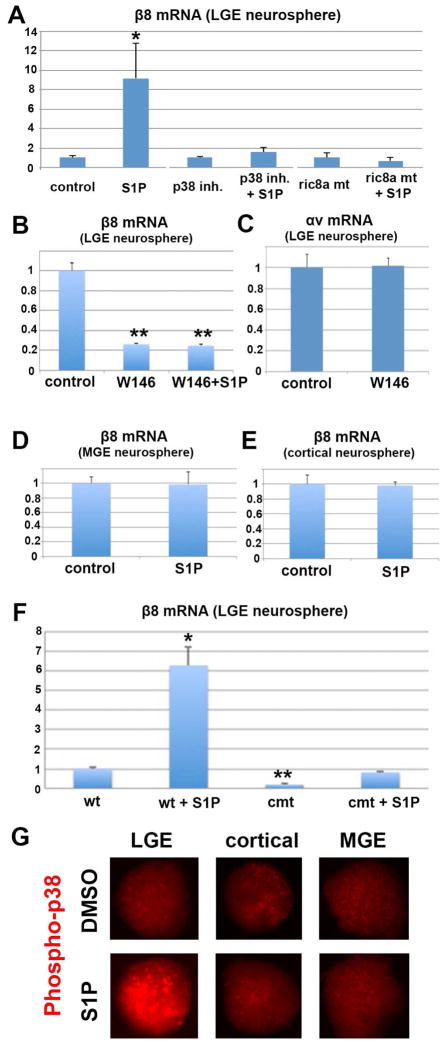
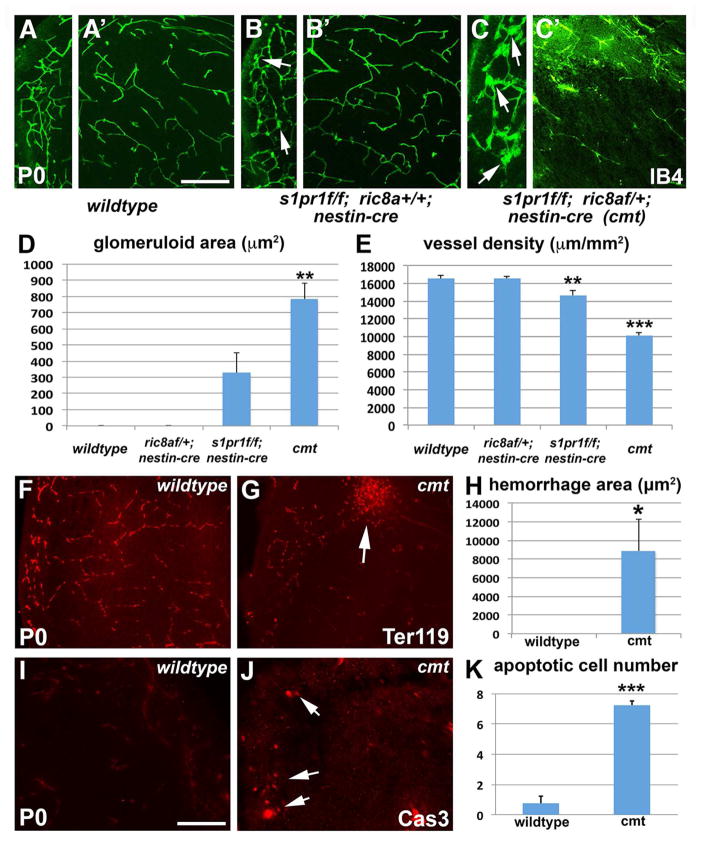
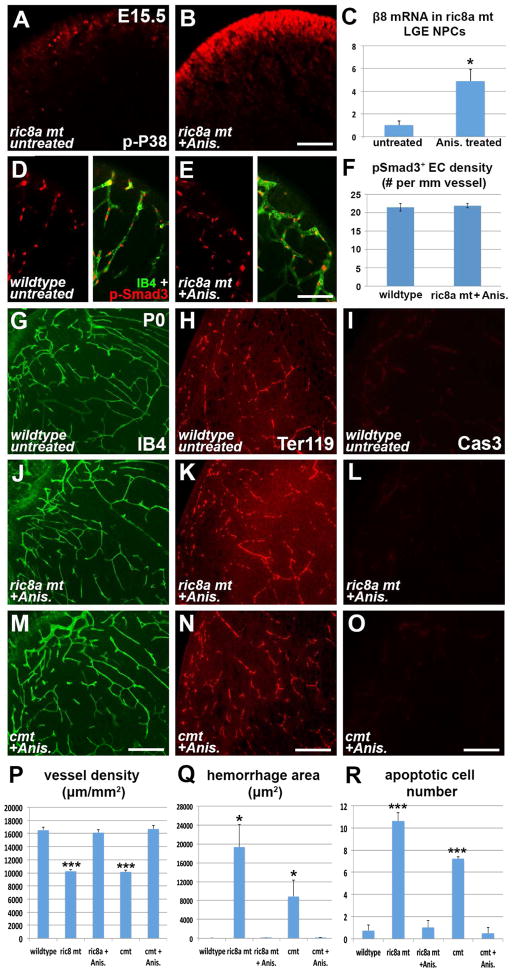
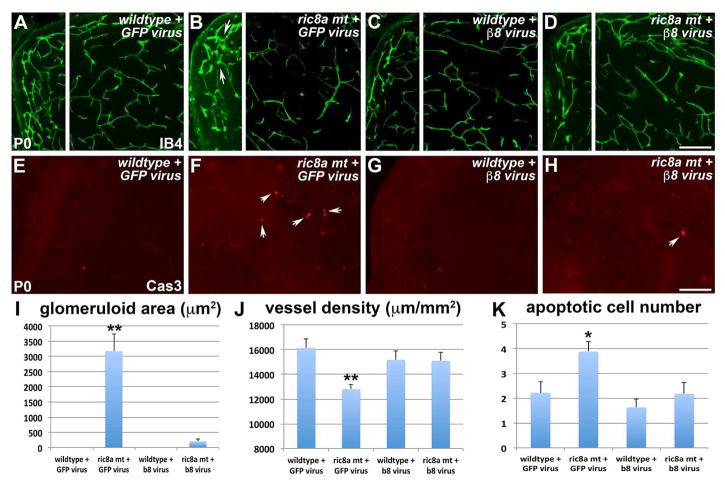
Intimate communication between neural and vascular cells is critical for normal brain development and function. Germinal matrix (GM), a key primordium for the brain reward circuitry, is unique among brain regions for its distinct pace of angiogenesis and selective vulnerability to hemorrhage during development. A major neonatal condition, GM hemorrhage can lead to cerebral palsy, hydrocephalus, and mental retardation. Here we identify a brain-region-specific neural progenitor-based signaling pathway dedicated to regulating GM vessel development. This pathway consists of cell-surface sphingosine-1-phosphate receptors, an intracellular cascade including Gα co-factor Ric8a and p38 MAPK, and target gene integrin β8, which in turn regulates vascular TGF-β signaling. These findings provide insights into region-specific specialization of neurovascular communication, with special implications for deciphering potent early-life endocrine, as well as potential gut microbiota impacts on brain reward circuitry. They also identify tissue-specific molecular targets for GM hemorrhage intervention.

Keywords: G-protein-coupled receptor; TGF-β; angiogenesis; basal ganglia; germinal matrix; integrin; neural stem cell; neurovascular signaling; radial glia; sphigosine-1-phosphate.


Figures

Figure 1
Figure 1. Ric8a is required in neural progenitors to regulate vessel development in the LGE
See also Figure S1. (A–C) Nissl staining of P0 striata from wildtype (A), ric8a; nestin-cre (B) and ric8a; dlx6a-cre (C) mutant animals. Note hemorrhages in B (arrows). (D–F) Isolectin B4 (IB4) labeling of vessels in P0 striata of wildtype (D), ric8a; nestin-cre (E) and ric8a; dlx6a-cre (F) animals. Note glomeruloid structures in E (arrows). (G) Quantification of areas with glomeruloid structures in P0 ventricular zones (VZs) shows significant increases in nestin-cre and foxg1-cre, but not dlx6a-cre mutants. **, p < 0.01; n = 5. (H) Quantification of vessel density in P0 striata shows severe reductions in nestin-cre and foxg1-cre, but not dlx6a-cre mutants. ***, p < 0.001; n = 7. (I–K) Hemorrhage in ric8a; nestin-cre mutant striata. Anti-Ter119 labeling of red blood cells (I–J) shows large accumulations outside vessels in mutants (arrows in L). (K) Quantification of hemorrhage areas. **, p < 0.01; n = 6. (L–N) Cell death in ric8a; nestin-cre mutant striata. Anti-cleaved caspase3 labeling (L–M) shows increased numbers of apoptotic cells in mutants (arrows in M). (N) Quantification of apoptotic cell numbers per field. ***, p < 0.001; n = 5. Scale bars: 200 μm for A–F, I, J, L, and M.
Figure 2
Figure 2. Ric8a mutation results in primary vascular defects in the embryonic LGE
See also Figure S2. (AB) IB4 labeling shows LGE vascular defects in ric8a; nestin-cre mutants (B) in comparison to wildtype (A) at E14.5. (C–D) Anti-laminin staining shows glomeruloid structures (arrows) in mutant LGE (D) at E16.5. (E–F) Anti-PDGFRβ staining (red) shows similar pericyte (arrows) coverage along vessel (IB4, green) in wildtype (E) and mutant LGE (F). (G–H) Anti-collagen IV staining shows defective basement membrane maturation in mutants (H) in comparison to wildtype (G). (IJ) Anti-Nestin staining shows comparable radial glial scaffold between wildtype (I) and mutant (J) LGE at E14.5. (K–L) Anti-Tubulin βIII (Tuj) staining shows comparable neuronal development between wildtype (K) and mutant (L) LGE at E14.5. (M) Quantification of vessel density in wildtype and mutant LGE during embryogenesis. **, p < 0.01; n = 3. (N) Quantification of perciyte density along vessels in wildtype and mutants (p = 0.59, n = 5). (O) Quantification of collagen IV staining intensity shows significant reductions in mutants. *, p < 0.05; n = 4. AU, arbitrary units. Scale bar: 200 μm for A, B, K, L, N and O, 100 μm for D, E, J and I, and 50μm in F and G.
Figure 3
Figure 3. Compromised vascular TGFβ signaling and neural progenitor β8 expression in ric8a mutant LGE
See also Figure S3. (A–B′) Phospho-Smad3 (red) staining shows reduced TGFβ signaling along LGE vessels (IB4, green) in mutants (B & B′) compared to wildtype (A & A″). Phospho-Smad3 staining alone is shown in A′-B′. (C–D) Phospho-p38 staining shows reduced p38 activity in LGE VZ in mutants (D) compared to wildtype (C). (E–F) In situ hybridization shows reduced β8 mRNA levels in LGE VZ in mutants (F) compared to wildtype (E). Note similar levels in cortical VZ (*). (G) Quantification of phospho-Smad3 EC density shows reductions in mutants. *, p < 0.05; n = 6. (H) TGFβ activity, assayed using a reporter cell line, is reduced in mutant striata. **, p < 0.01; n = 6. (I–J) RT-qPCR analysis shows significant reductions of β8 but not αv mRNA in mutant LGE neurospheres. **, p < 0.01; n = 5. (KL) RT-qPCR analysis shows no significant changes in β8 mRNA in either mutant cortical (K) or mutant MGE (L) neurospheres (p > 0.58; n = 4-10). (M–N) RT-qPCR analysis shows no significant changes of β3 (M) or β5 (N) mRNA in mutant cortical LGE neurospheres (p > 0.25; n = 4). Scale bar: 150μm for A–B and 100 μm for I–L, O, and P.
Figure 4
Figure 4. S1P regulates integrinβ8 mRNA in LGE neural progenitors in a region-specific manner dependent on Ric8a/p38MAPK
See also Figure S4. (A) S1P dramatically up-regulates β8 mRNA in LGE neurospheres, an effect blocked by p38 inhibitor and ric8a mutation. *, p < 0.05; n = 5-7. (B) S1PR1 antagonist W146 suppresses basal and S1P-induced β8 mRNA in LGE neurospheres. **, p < 0.01; n = 4. (C) W146 has no effects on αv mRNA in LGE neurospheres (p > 0.05; n = 4). (D–E) S1P does not induce β8 mRNA in MGE (D) or cortical (E) neurospheres (p > 0.45; n = 4). (F) s1pr1/ric8a compound mutation suppresses basal and S1P-induced β8 mRNA in LGE neurospheres. *, p < 0.05; **, p < 0.01; n = 3. (G) S1P treatment (10 minutes) specifically induces p38 phosphorylation in LGE, but not cortical or MGE neurospheres.
Figure 5
Figure 5. S1PR1 and Ric8a act in the same pathway in regulating LGE angiogenesis
See also Figure S5. (AC′) s1pr1 single mutation (s1pr1 flox/flox; nestin-cre) results in subtle (B & B′), while s1pr1/rci8a compound mutation (s1pr1 flox/flox; ric8a flox/+; nestin-cre) results in obvious vessel (IB4, green) defects in P0 striata (C & C′), in comparison to wildtype (A & A′). Note altered vessel morphology in single (arrows in B) and glomeruloid structures in compound mutants (arrows in C). (D) Quantification of glomeruloid areas shows significant increases in compound mutants. **, p < 0.01; n = 6. (E) Quantification of vessel density shows severe reductions in s1pr1/ric8a compound mutants to similar those in ric8a single mutants (see Fig. 1H). **, p < 0.01; ***, p < 0.001; n = 17. (F–H) Hemorrhage in compound mutant striata. Anti-Ter119 labeling of red blood cells (F–G) shows large accumulations outside vessels (arrows in G). (H) Quantification of hemorrhage areas. *, p < 0.05; n = 6. (I–K) Cell death in compound mutant striata. Anti-caspase3 labeling (I–J) shows large numbers of apoptotic cells in compound mutants (arrows in J). (K) Quantification of apoptotic cell numbers. ***, p < 0.001; n = 5. Scale bar: 200μm for A–C, F–G, and I–J.
Figure 6
Figure 6. p38 activation rescues vascular defects in ric8a single and s1pr1/ric8a compound mutants
See also Figure S6. (A–B) Treatment with a low dose of anisomycin at E14.5 dramatically increases phospho-P38 (red) levels in mutant LGE (B) at E15.5 in comparison to the untreated (A). (C) Anisomycin elevates integrin β8 mRNA in mutant LGE neurospheres despite ric8a deficiency. *, p < 0.05; n = 4. (D–F) Anisomycin restores levels of phospho-Smad3 (red) along LGE vessels (IB4, green) in ric8a mutants (see Fig. 3B for untreated mutants) (D–E). Quantification shows a density of p-Smad3+ ECs indistinguishable from wildtype (F) (p > 0.68; n = 6). (G, J, M, P) Anisomycin treatment at E14.5 restores vessel morphology (IB4, green) in P0 ric8a single (J) and s1pr1/ric8a compound mutant (M) striata, to levels similar to wildtype (G). Quantification confirms rescue of vessel density (P) (***, p < 0.001; n = 17). (H, K, N, Q) Anisomycin treatment at E14.5 prevents hemorrhage (Ter119 for red blood cell, red) in P0 ric8a single (K) and s1pr1/ric8a compound mutant (L) striata. Quantification confirms suppression of hemorrhage (Q) (*, p < 0.05; n = 6). (I, L, O, R) Anisomycin treatment at E14.5 suppresses cell death (caspase 3, red) in P0 ric8a single (L) and s1pr1/ric8a compound mutant (O) striata, to levels similar to wildtype (I). Quantification confirms suppression effects (R) (***, p < 0.001; n = 5). Scale bars: 200μm in A, B, G, J, M, H, K, and N. 100μm in D, E, I, L, and O.
Figure 7
Figure 7. Exogenous integrin β8 rescues vascular defects in ric8a mutants
See also Figure S7. (A–D) Exogenous GFP has no obvious effects on vessel morphology in wildtype striata (A) and does not rescue defects in ric8a mutants (B). Exogenous integrin β8 also has no effects on wildtype striata (C), but rescues mutant defects (D). Note absence of glomeruloid structures in (D) in comparison to (B) (arrows). (E–H) Exogenous GFP has no obvious effects on apoptosis (arrows) in wildtype striata (E) and does not rescue apoptosis in ric8a mutants (F). Exogenous integrin β8 also has no effects on wildtype striata (G), but suppresses apoptosis in mutants (H). (I) Quantification of glomeruloid areas shows near complete suppression by β8 expression in ric8a mutants. **, p < 0.01; n = 12. (J) Quantification of vessel density shows restoration to a level indistinguishable from wildtype by β8 expression in ric8a mutants. **, p < 0.01; n = 10. (K) Quantification of apoptotic cell number shows significant suppression by β8 expression in ric8a mutants. *, p < 0.05; n = 12. Scale bars: 200μm in A–D and 100μm in E–H.

References

    1. Abe M, Harpel JG, Metz CN, Nunes I, Loskutoff DJ, Rifkin DB. An assay for transforming growth factor-beta using cells transfected with a plasminogen activator inhibitor-1 promoter-luciferase construct. Analytical biochemistry. 1994;216:276–284. - PubMed
    1. Allende ML, Yamashita T, Proia RL. G-protein-coupled receptor S1P1 acts within endothelial cells to regulate vascular maturation. Blood. 2003;102:3665–3667. - PubMed
    1. Andreone BJ, Lacoste B, Gu C. Neuronal and vascular interactions. Annual review of neuroscience. 2015;38:25–46. - PMC - PubMed
    1. Arentsen T, Qian Y, Gkotzis S, Femenia T, Wang T, Udekwu K, Forssberg H, Diaz Heijtz R. The bacterial peptidoglycan-sensing molecule Pglyrp2 modulates brain development and behavior. Molecular psychiatry. 2017;22:257–266. - PMC - PubMed
    1. Armulik A, Genove G, Betsholtz C. Pericytes: developmental, physiological, and pathological perspectives, problems, and promises. Developmental cell. 2011;21:193–215. - PubMed

MeSH terms

LinkOut - more resources