. 2017 May 22;41(4):424-437.e4.
doi: 10.1016/j.devcel.2017.04.013.

Dephosphorylation of the Ndc80 Tail Stabilizes Kinetochore-Microtubule Attachments via the Ska Complex

Affiliations

Dephosphorylation of the Ndc80 Tail Stabilizes Kinetochore-Microtubule Attachments via the Ska Complex

Dhanya K Cheerambathur et al. Dev Cell. .

Abstract

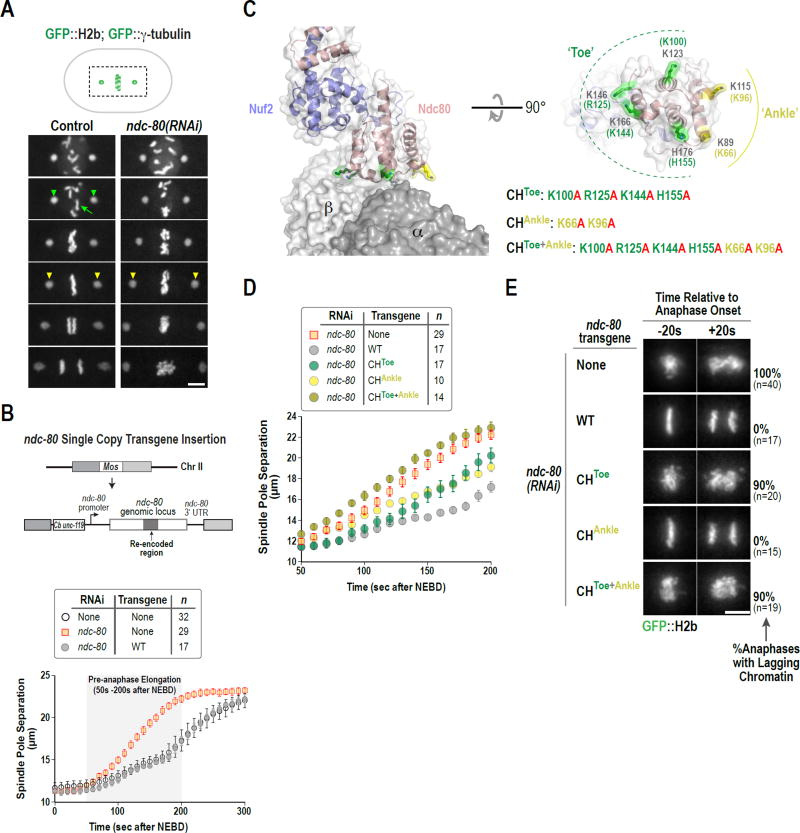
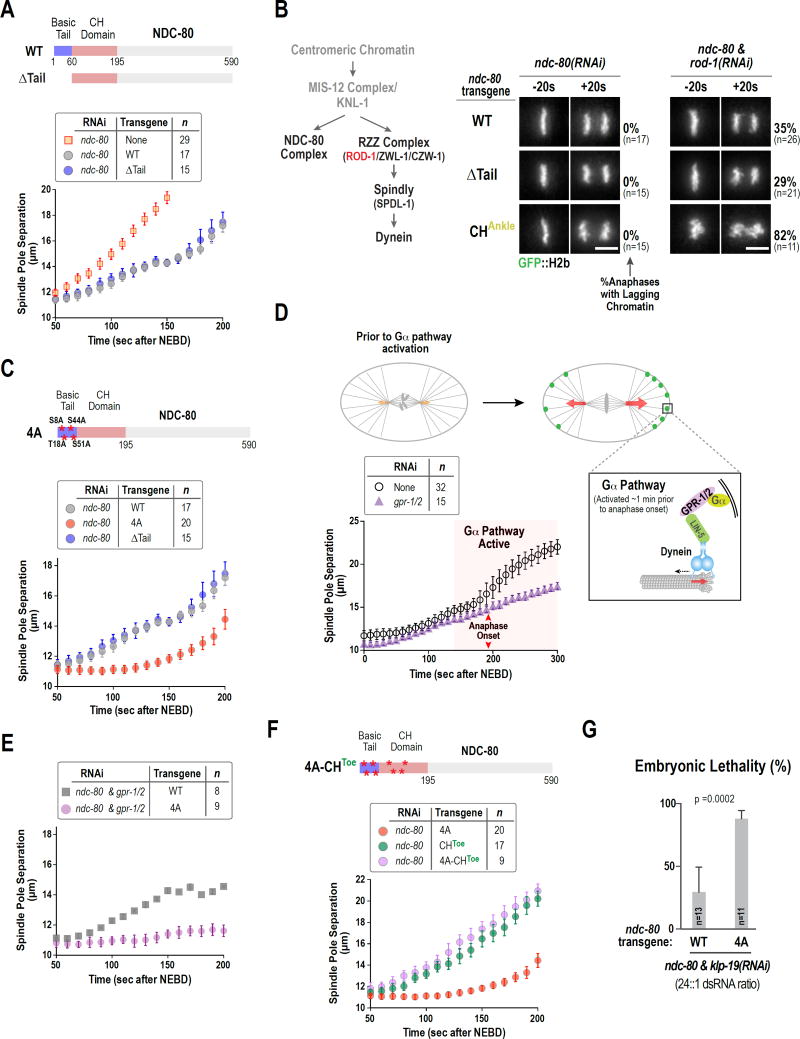
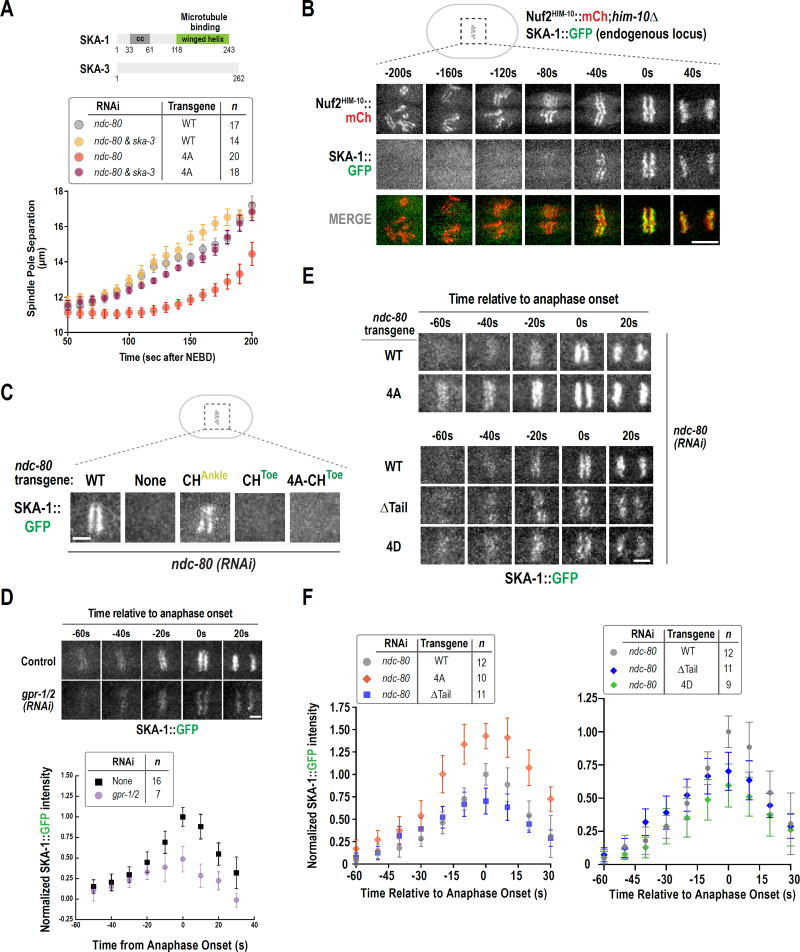
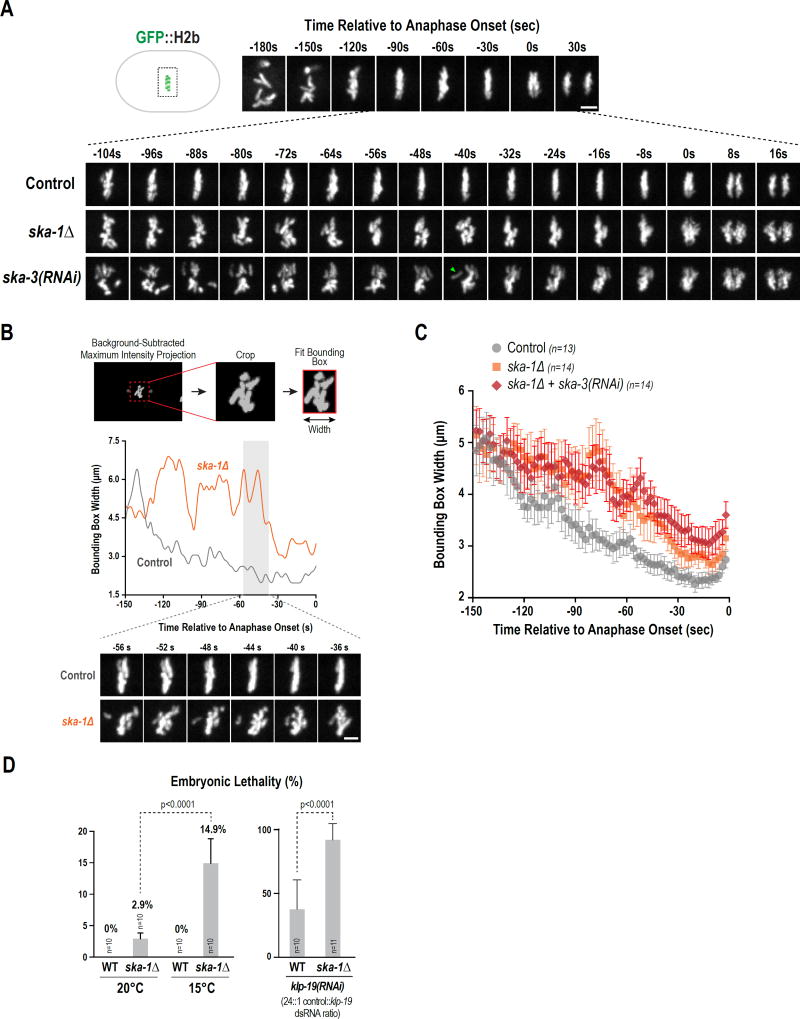
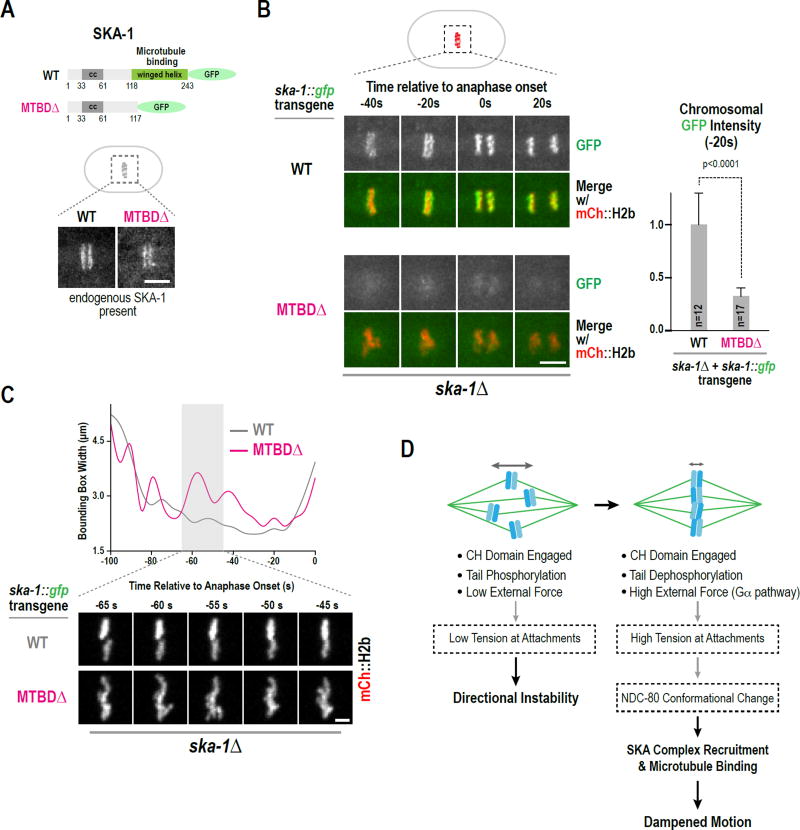
During cell division, genome inheritance is orchestrated by microtubule attachments formed at kinetochores of mitotic chromosomes. The primary microtubule coupler at the kinetochore, the Ndc80 complex, is regulated by Aurora kinase phosphorylation of its N-terminal tail. Dephosphorylation is proposed to stabilize kinetochore-microtubule attachments by strengthening electrostatic interactions of the tail with the microtubule lattice. Here, we show that removal of the Ndc80 tail, which compromises in vitro microtubule binding, has no effect on kinetochore-microtubule attachments in the Caenorhabditis elegans embryo. Despite this, preventing Aurora phosphorylation of the tail results in prematurely stable attachments that restrain spindle elongation. This premature stabilization requires the conserved microtubule-binding Ska complex, which enriches at attachment sites prior to anaphase onset to dampen chromosome motion. We propose that Ndc80-tail dephosphorylation promotes stabilization of kinetochore-microtubule attachments via the Ska complex and that this mechanism ensures accurate segregation by constraining chromosome motion following biorientation on the spindle.

Keywords: Ndc80 complex; Ska complex; cell division; cell polarity; centromere; chromosome segregation; kinetochore; microtubule; mitosis.


Figures

Figure 1
Figure 1. Quantitative analysis of spindle elongation discriminates NDC-80 mutations in vivo that alter microtubule-binding affinity
(A) Stills from movies of control and ndc-80(RNAi) one-cell embryos expressing GFP::H2b and GFP::γ-tubulin, to label chromosomes (green arrow) and spindle poles (green arrowheads), respectively. Time is in seconds after NEBD. Yellow arrowheads highlight premature spindle pole separation in ndc-80(RNAi). Scale bar, 5 µm. (B) Single copy transgene insertion-based NDC-80 replacement system. Spindle pole tracking analysis below shows rescue of ndc-80(RNAi) by transgene-encoded RNAi-resistant wild-type NDC-80. Error bars are the 95% confidence interval. (C) Structure of the human Ndc80-Nuf2 head (pink/blue) bound to a tubulin dimer (gray, labeled α/β) in the microtubule lattice (PDB 3IZ0). The Toe and Ankle residues of the Ndc80 CH domain are colored in green and yellow, respectively. A rotated en face view of the microtubule-binding surface of the CH domain is on the right. Residue numbers are for human Ndc80 (black) and C. elegans NDC-80 (green/yellow). (D) Spindle pole separation analysis for the indicated CH domain mutants following endogenous NDC-80 depletion. The 50s-200s interval after NEBD is plotted. Error bars are the 95% confidence interval. WT and No Transgene data are the same as in Fig. 1B. (E) Chromosome segregation phenotypes for the indicated CH domain mutants highlighted by image stills from time-lapse movies 20 sec prior to and after anaphase onset; percentage of one-cell embryo anaphases with detectable lagging chromatin are indicated on the right. Scale bar, 5 µm. See also Fig. S1.
Figure 2
Figure 2. N-Tail deleted NDC-80 exhibits no defects in kinetochore-microtubule attachments whereas a non-phosphorylatable N-tail mutant restrains spindle elongation
(A) Comparison of WT and ΔTail NDC-80 in the spindle pole separation assay. Error bars are the 95% confidence interval. WT data is the same as in Fig. 1B. (B) Summary of NDC-80 complex and dynein motor recruitment to the C. elegans kinetochore (left) and chromosome segregation phenotypes for the indicated conditions (right). Scale bar, 5 µm. (C) Spindle pole separation analysis of the indicated conditions. WT and ΔTail data are the same as in Fig. 1B and Fig. 2A, respectively. Error bars are the 95% confidence interval. (D) Schematic of the Gα pathway that generates an asymmetric force for spindle displacement starting ~1 min prior to anaphase onset (orange & red arrows indicate forces; black dashed arrow indicates direction of motor; adapted from (Gönczy and Rose, 2005). Graph shows effect of Gα pathway inhibition by depletion of GPR-1/2 in the spindle pole separation assay. Red arrows mark anaphase onset, which is not affected by GPR-1/2 depletion. Error bars are the 95% confidence interval. (E) & (F) Spindle pole separation analysis of the indicated conditions. Error bars are the 95% confidence interval. 4A and CHToe alone data is the same as in Fig. 2C and Fig. 1D, respectively. (G) Embryonic lethality in WT and 4A NDC-80 following weak depletion of KLP-19. n=number of worms. See also Figs. S2 & S3.
Figure 3
Figure 3. The non-phosphorylatable NDC-80 N-tail mutant suppresses spindle elongation via the SKA complex
(A) Schematics of C. elegans SKA complex subunits SKA-1 and SKA-3. Spindle pole separation analysis for the indicated conditions. WT and 4A alone data are same as in Fig. 1B and Fig. 2C, respectively. Error bars are the 95% confidence interval. (B) Stills from a time-lapse movie of a one-cell embryo co-expressing mCherry-tagged NDC-80 complex and GFP-tagged SKA complex. Scale bar, 5 µm. (C) SKA-1::GFP localization in the indicated conditions. 10–12 embryos were imaged per condition. Scale bar, 2.5 µm. (D) (top) Stills from time-lapse movies of SKA-1::GFP localization in control and gpr-1/2(RNAi). (bottom) Quantification of SKA-1::GFP chromosomal intensity relative to anaphase onset. Error bars are the 95% confidence interval. Measured fluorescence intensities were normalized to the averaged maximal intensity value in control. (E) Stills from time-lapse movies of SKA-1::GFP chromosomal localization in the indicated conditions. Scale bar, 2.5 µm. (F) Quantification of SKA-1::GFP chromosomal intensity relative to anaphase onset for the indicated conditions, performed as in Fig. 3D above. See also Fig. S4.
Figure 4
Figure 4. The SKA complex is required to dampen chromosome motion and contributes to embryonic viability
(A) High temporal resolution analysis (6-plane z-stack at 1.5 µm spacing acquired every 2s) of chromosome dynamics. Low time resolution (30s interval) stills from early prometaphase to just after anaphase onset are shown for control on top and higher time-resolution stills for the indicated conditions during the selected interval are shown below. Scale bar, 2.5 µm. (B) Method employed to analyze chromosome distribution along the spindle axis using a bounding box. Individual control and ska-1Δ traces are shown; stills below illustrate chromosome behavior. Scale bar, 2.5 µm. (C) Average plot of chromosome distribution along the spindle axis for the indicated conditions. Error bars are the 95% confidence interval. (D) (left) Comparison of embryonic lethality in WT and ska-1Δ at 20°C and 15°C. (right) Plot of embryonic lethality in control and ska-1Δ following partial depletion of KLP-19. n=number of worms. See also Fig. S5.
Figure 5
Figure 5. The microtubule-binding domain of SKA-1 contributes to SKA complex localization and function
(A) Schematic of transgene-expressed GFP fusions of SKA-1; the microtubule-binding domain deletion (MTBDΔ) is identical to the one characterized in vitro (Schmidt et al., 2012). Images below show metaphase stage embryos in strains where endogenous SKA-1 is present. Scale bar, 5 µm. (B) Stills from time-lapse movies for the indicated conditions. The graph on the right plots background-subtracted chromosomal GFP fluorescence for the frame (−20s) prior to anaphase onset. Measurements were normalized to the mean value of wild-type SKA-1::GFP. Error bars are the 95% confidence interval. Scale bar, 5 µm. (C) Examples of bounding box width analysis of mCherry::H2b timelapse sequences, performed as in Fig. 4B; stills below illustrate chromosome behavior for the two analyzed conditions. Scale bar, 2.5 µm. (D) Model for dampening of chromosome motion after biorientation. Boxes with dashed lines contain speculations discussed in the text. See also Fig. S5.

References

    1. Abad MA, Medina B, Santamaria A, Zou J, Plasberg-Hill C, Madhumalar A, Jayachandran U, Redli PM, Rappsilber J, Nigg EA, et al. Structural basis for microtubule recognition by the human kinetochore Ska complex. Nat Commun. 2014;5:2964. - PMC - PubMed
    1. Alushin GM, Musinipally V, Matson D, Tooley J, Stukenberg PT, Nogales E. Multimodal microtubule binding by the Ndc80 kinetochore complex. Nat. Struct. Mol. Biol. 2012;19:1161–1167. - PMC - PubMed
    1. Alushin GM, Ramey VH, Pasqualato S, Ball DA, Grigorieff N, Musacchio A, Nogales E. The Ndc80 kinetochore complex forms oligomeric arrays along microtubules. Nature. 2010;467:805–810. - PMC - PubMed
    1. Chan YW, Jeyaprakash AA, Nigg EA, Santamaria A. Aurora B controls kinetochore-microtubule attachments by inhibiting Ska complex-KMN network interaction. J. Cell Biol. 2012;196:563–571. - PMC - PubMed
    1. Cheerambathur DK, Desai A. Linked in: formation and regulation of microtubule attachments during chromosome segregation. Curr. Opin. Cell Biol. 2014;26:113–122. - PMC - PubMed

Publication types

MeSH terms

Substances