. 2017 May 23;14(1):33.
doi: 10.1186/s12977-017-0356-3.

Parent-offspring regression to estimate the heritability of an HIV-1 trait in a realistic setup

Affiliations

Parent-offspring regression to estimate the heritability of an HIV-1 trait in a realistic setup

Nadine Bachmann et al. Retrovirology. .

Abstract

Background: Parent-offspring (PO) regression is a central tool to determine the heritability of phenotypic traits; i.e., the relative extent to which those traits are controlled by genetic factors. The applicability of PO regression to viral traits is unclear because the direction of viral transmission-who is the donor (parent) and who is the recipient (offspring)-is typically unknown and viral phylogenies are sparsely sampled.

Methods: We assessed the applicability of PO regression in a realistic setting using Ornstein-Uhlenbeck simulated data on phylogenies built from 11,442 Swiss HIV Cohort Study (SHCS) partial pol sequences and set-point viral load (SPVL) data from 3293 patients.

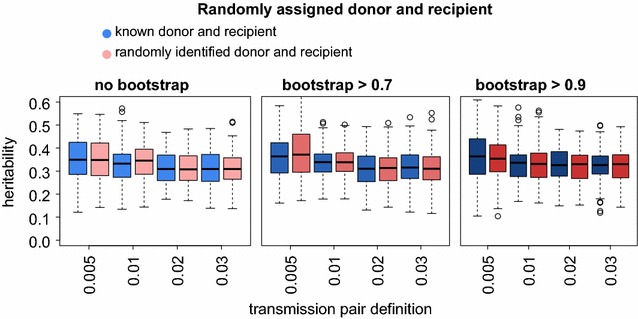
Results: We found that the misidentification of donor and recipient plays a minor role in estimating heritability and showed that sparse sampling does not influence the mean heritability estimated by PO regression. A mixed-effect model approach yielded the same heritability as PO regression but could be extended to clusters of size greater than 2 and allowed for the correction of confounding effects. Finally, we used both methods to estimate SPVL heritability in the SHCS. We employed a wide range of transmission pair criteria to measure heritability and found a strong dependence of the heritability estimates to these criteria. For the most conservative genetic distance criteria, for which heritability estimates are conceptually expected to be closest to true heritability, we found estimates ranging from 32 to 46% across different bootstrap criteria. For less conservative distance criteria, we found estimates ranging down to 8%. All estimates did not change substantially after adjusting for host-demographic factors in the mixed-effect model (±2%).

Conclusions: For conservative transmission pair criteria, both PO regression and mixed-effect models are flexible and robust tools to estimate the contribution of viral genetic effects to viral traits under real-world settings. Overall, we find a strong effect of viral genetics on SPVL that is not confounded by host demographics.

Keywords: HIV-1; Heritability; Mixed-effect model; Ornstein–Uhlenbeck process; Parent-offspring regression; Set-point viral load.


Figures

Fig. 1
Fig. 1
Randomly assigned donor and recipient. For each of 12 transmission pair criteria (combination of allowed genetic distance and bootstrap cutoff), heritability measurements of 100 runs of OU-simulated trait values were obtained using only the 178 transmission pairs for which there was strong evidence for the directionality of transmission [18]. For each of the criteria, the PO estimates using known versus randomly assigned donors and recipients are compared. In each boxplot the black line near the middle of the box is the median value of the group. The top and bottom of the box represent the 25th and 75th percentile of the data and the vertical size of the box is therefore the interquartile range, or IQR. The “whisker”, or the arrows extending out of the box, show the reasonable extremes of the data, which we took as 1.5 × IQR (as it is the default in R). The individual points represent outliers
Fig. 2
Fig. 2
Sparse sampling. For each of 12 transmission pair criteria (combination of allowed genetic distance and bootstrap cutoff) the heritability was estimated using PO regression on the full SHCS phylogeny (blue bars) and on 100 randomly generated sparse trees with sparseness 1/3 (red bars). For both estimations, the same 100 realizations of OU simulations on the full SHCS phylogeny and the 100 sparse phylogenies were used
Fig. 3
Fig. 3
PO regression versus definition of heritability. For each of 12 transmission pair criteria (combination of allowed genetic distance and bootstrap cutoff), three heritability definitions are compared: PO regression with randomly assigned donor and recipient, the true heritability (variance of genetic component over the overall variance) applied only to the transmission pairs that were included in the PO regression and the original definition applied to all SHCS tips of the tree. The boxplots represent heritability measurements from 100 realizations of the OU process
Fig. 4
Fig. 4
PO regression versus mixed effect model. For each of 12 transmission pair criteria (combination of allowed genetic distance and bootstrap cutoff), the heritability estimates of PO regression and mixed effect models are compared using 100 realizations of an OU process. For the mixed effect model no covariates were included in order to allow direct comparison to PO regression
Fig. 5
Fig. 5
SPVL heritability for different transmission pair criteria. On the sparse tree that includes only sequences of patients with available SPVL, we measured heritability of SPVL using the same 12 criteria as were employed in the simulated data (combination of allowed genetic distance and bootstrap cutoff). For the intuition of the tradeoff between statistical power and methodological correctness, also 95% confidence intervals and the number of transmission pairs included in the analysis are shown
Fig. 6
Fig. 6
SPVL heritability—including covariates. Heritability was measured using a mixed-effect model on transmission pairs and transmission clusters using the same definition of genetic distance <0.01 and bootstrap >0. We corrected for the host factors sex, age, risk (MSM, HET, IDU), ethnicity and center of treatment, separately (middle bars) and altogether (rightest bars)

References

    1. Buchbinder SP, Katz MH, Hessol NA, O’Malley PM, Holmberg SD. Long-term HIV-1 infection without immunologic progression. AIDS. 1994;8(8):1123–1128. doi: 10.1097/00002030-199408000-00014. - DOI - PubMed
    1. Mellors JW, Rinaldo CR, Gupta P, White RM, Todd JA, Kingsley LA. Prognosis in HIV-1 Infection predicted by the quantity of virus in plasma. Science. 1996;272(5265):1167–1170. doi: 10.1126/science.272.5265.1167. - DOI - PubMed
    1. Alizon S, von Wyl V, Stadler T, Kouyos RD, Yerly S, Hirschel B, et al. Phylogenetic approach reveals that virus genotype largely determines HIV set-point viral load. PLoS Pathog. 2010;6(9):e1001123. doi: 10.1371/journal.ppat.1001123. - DOI - PMC - PubMed
    1. Hodcroft E, Hadfield JD, Fearnhill E, Phillips A, Dunn D, O’Shea S, et al. The contribution of viral genotype to plasma viral set-point in HIV infection. PLoS Pathog. 2014;10(5):e1004112. doi: 10.1371/journal.ppat.1004112. - DOI - PMC - PubMed
    1. Fraser C, Lythgoe K, Leventhal GE, Shirreff G, Hollingsworth TD, Alizon S, et al. Virulence and pathogenesis of HIV-1 infection: an evolutionary perspective. Science. 2014;343(6177):1243727. doi: 10.1126/science.1243727. - DOI - PMC - PubMed

Publication types